
Every Monday morning, marketing agencies face the same slog — hours lost to manually building reports. Time that should go toward strategy, creative, or client growth instead vanishes into spreadsheets and repetitive charts. Still copying and pasting between spreadsheets? Manually calculating metrics? Rebuilding the same charts every week? You’re not just wasting time — you’re holding back your agency’s growth.
The good news? Looker Studio’s functions are like hiring an invisible analyst. They turn tedious reporting into automated workflows that update themselves — no spreadsheets, no late nights, no lost weekends. What used to take your team an entire afternoon can now be completed in minutes.
What Are Looker Studio Functions?
Functions in Looker Studio are the building blocks for custom metrics and dimensions.
Here’s what they let you do:
- Create new metrics (like ROAS or engagement rate)
- Clean up messy data fields
- Automate comparisons across channels
- Standardize naming, formatting, and categorization
With over 50 built-in functions, you can handle everything from simple math to advanced logic — without touching spreadsheets.

The Add a Field button in the Looker Studio Data Source Editor
Aggregation Functions
Aggregation functions help you roll up raw data — like total ad spend, average CPC, or unique leads — into high-level summaries. They’re essential for multi-channel dashboards because they let you blend, group, and compare data without hitting row limits. Use them to highlight campaign-level trends and keep clients focused on what matters, not buried in spreadsheets.
Looker Studio’s aggregation functions break down into a few practical subtypes. Use them to calculate averages, totals, extremes, and patterns — each has its own sweet spot depending on what you’re measuring and why.
| Totals & Counts | |||
|---|---|---|---|
| Function | What It Does | When to use | Syntax |
| SUM | Returns the total sum of all values of X | Use to calculate total spend, revenue, or conversions for reports | SUM(X) |
| COUNT | Returns the number of values in X | Use to track total actions like clicks, purchases, or form submissions | COUNT(X) |
| COUNT_DISTINCT | Returns the number of unique values in X | Use to measure reach — like unique users, devices, or campaigns | COUNT_DISTINCT(X) |

| Statistical Functions | |||
|---|---|---|---|
| Function | What It Does | When to use | Syntax |
| AVG | Returns the average of all values of X | Use to find average CPC, ROAS, or conversion rate across campaigns | AVG(X) |
| MEDIAN | Returns the midpoint of all values of X | Use when outliers skew results and you need a balanced view of campaign performance | MEDIAN(X) |
| PERCENTILE | Returns the value at the Nth percentile of field X | Use to isolate top performers, like the top 10% of ads by CTR or ROAS | PERCENTILE(X,N) |
| STDDEV | Returns the standard deviation of values in X | Use to understand how consistent or volatile your results are across time or campaigns | STDDEV(X) |
| VARIANCE | Returns the variance of values in X | Use in A/B tests or audience segments to evaluate differences in performance | VARIANVARIANCECE(X) |
| Extreme Value Functions | |||
|---|---|---|---|
| Function | What It Does | When to use | Syntax |
| MAX | Returns the highest value of X | Use to spot your best-performing ad or campaign based on metrics like highest ROAS or CTR | MAX(X) |
| MIN | Returns the lowest value of X | Use to uncover underperforming campaigns with low engagement or revenue | MIN(X) |
Arithmetic Functions
Arithmetic functions let you control how numbers appear — no messy decimals, no misaligned metrics. Use them to clean up profit calculations, smooth out outliers, or compare performance with precision.
Here are the hand-picked Looker Studio functions for your marketing agency:
| Rounding & Cleanup Functions(Clean up messy numbers for client-ready reports) | |||
|---|---|---|---|
| Function | What It Does | When to use | Syntax |
| ABS | Returns the positive version of a number | Use to remove negative values from metrics like profit or spend for easier reporting | ABS(X) |
| CEIL | Rounds a number up to the nearest whole number | Use to round up metrics like cost or conversions for simplified summaries | CEIL(X) |
| FLOOR | Rounds a number down to the nearest whole number | Use to round down CPC or similar values and avoid overreporting | FLOOR(X) |
| ROUND | Rounds a number to a specific number of decimal places | Use to clean up metrics like CPC or ROAS for cleaner, client-facing visuals | ROUND(X, Y) |

| Logarithmic Functions(Make huge numbers easier to compare or visualize) | |||
|---|---|---|---|
| Function | What It Does | When to use | Syntax |
| LOG | Returns the logarithm to base 2 of a number | Use to scale down metrics with skewed distributions so they’re easier to compare | LOG(X) |
| LOG10 | Returns the logarithm to base 10 of a number | Use to manage large values like impressions for better visualizations | LOG10(X) |
| Trigonometric Functions (Advanced Use)(Use in niche math models — rarely needed for most marketers) | |||
|---|---|---|---|
| Function | What It Does | When to use | Syntax |
| ASIN | Returns the inverse sine of a number (between -1 and 1) | Use in custom angle-based formulas — usually for advanced modeling | ASIN(X) |
| ATAN | Returns the inverse tangent of a number | Use for specialized math models involving slope, trends, or projections | ATAN(X) |
| N-Ary Comparison Functions(Compare multiple values at once to find best or worst performers) | |||
|---|---|---|---|
| Function | What It Does | When to use | Syntax |
| NARY_MAX | Returns the largest number from a list | Use to compare multiple KPIs in a single field and spotlight the highest performer | NARY_MAX(X, Y [,Z]*) |
| NARY_MIN | Returns the smallest number from a list | Use to identify the lowest-performing ad, keyword, or channel across a group | NARY_MIN(X, Y [,Z]*) |
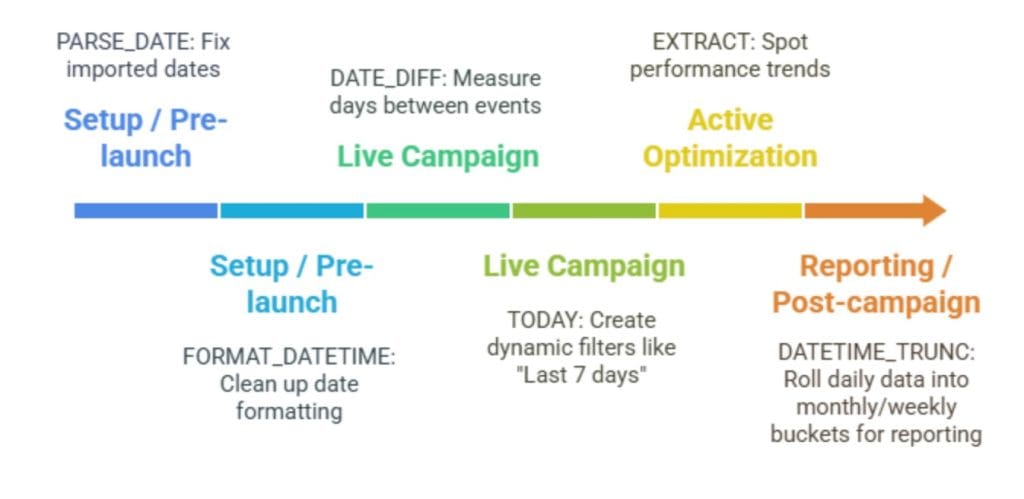
Date Functions
Date functions bring automation to your time-based reporting. They help you track campaign timelines, compare performance across periods, and dynamically filter reports — no manual date changes needed.
Looker Studio has quite a few date functions, but this chart shows the most popular for marketing agencies:
| Date Functions | |||
|---|---|---|---|
| Function | What It Does | When to use | Syntax |
| DATE_DIFF | Returns the number of days between two dates | Use to measure campaign duration or track time between milestones like signup to purchase | DATE_DIFF(X, Y) |
| EXTRACT | Pulls out specific parts like month, week, or day from a full date | Use to break down performance by time of day, weekday, or month and spot timing patterns | EXTRACT(part FROM date_expression) |
| TODAY | Returns the current date based on the user’s time zone | Use to build dynamic reports with filters like “last 7 days from today” | TODAY([time_zone]) |
| DATETIME_TRUNC | Trims dates to a set granularity (e.g., month, week, day) | Use to group metrics into consistent time buckets for trend tracking | DATETIME_TRUNC(date_expression, part) |
| PARSE_DATE | Converts a string into a valid date using the given format | Use to fix date fields that were imported as plain text | PARSE_DATE(format_string, text) |
| FORMAT_DATETIME | Outputs date fields as custom-formatted strings | Use to make dashboard dates more readable, like “Jan 2024” instead of “2024-01-01” | FORMAT_DATETIME(format_string, datetime_expression) |
Think of date functions as tools for each phase of your campaign. This graphic shows when to pull each one out — from kickoff to wrap-up.
Text Functions
Text formulas are handy when you need to clean up messy campaign names and UTM parameters. You can standardize naming conventions, build custom URLs, or pull out specific parts of text strings, so your data looks clean and your segments actually make sense to clients.
Let’s say you’re pulling in campaign names like “fb_q1_brand_upper_funnel” and need to isolate “brand.” With REGEXP_EXTRACT, you can pull just the part you need to build better segments — without touching the raw data.
| Text Functions | |||
|---|---|---|---|
| Function | What It Does | When to use | Syntax |
| REGEXP_EXTRACT | Pulls specific values out of longer strings using a regex pattern | Use to extract source, medium, or campaign type from UTM-tagged URLs | REGEXP_EXTRACT(X, pattern) |
| LOWER, UPPER | Converts all text to lowercase or uppercase | Use to standardize names across datasets, like facebook vs Facebook | LOWER(X) or UPPER(X) |
| CONCAT | Joins two pieces of text into one string | Use to build custom labels, headlines, or URLs by combining multiple fields | CONCAT(X, Y) |
| TRIM | Removes extra spaces at the beginning and end of text | Use to clean up messy names or manual entries from imported files | TRIM(X) |
| REPLACE | Replaces all instances of Y in string X with a new value Z | Use to fix typos, update naming conventions, or rebrand campaign labels | REPLACE(X, Y, Z) |
| SUBSTR | Returns part of a string based on character position | Use to pull specific segments like codes or tags from a longer text | SUBSTR(X, start, length) |
| CONTAINS_TEXT | Returns TRUE if the field contains a specific substring | Use to filter branded vs non-branded campaigns based on URLs or names | CONTAINS_TEXT(X, search_term) |
Geo Functions
Use geo functions to break down performance by location. Spot which cities drive the cheapest conversions. See which countries give you the best bang for your budget. These functions let you stop guessing and start targeting where it really counts.
| Geo Functions | |||
|---|---|---|---|
| Name | What It Does | When to use | Syntax |
| TOCITY | Returns the city name based on the location data you provide | Use to see which cities drive the most conversions or deliver the lowest cost per click | TOCITY(X [,Input Format]) |
| TOREGION | Returns the region or state name for a given location | Use to analyze performance by state or region for local targeting | TOREGION(X [,Input Format]) |
| TOCOUNTRY | Returns the country name from your location input | Use to compare campaign performance across countries | TOCOUNTRY(X [,Input Format]) |
| TOCONTINENT | Returns the continent name from your location input | Use to group performance into broad global regions | TOCONTINENT(X [,Input Format]) |
| TOSUBCONTINENT | Returns the sub-continent name from your location input | Use to build regional summaries for broader campaign reporting | TOSUBCONTINENT(X [,Input Format]) |
| SUBSTR | Returns part of a string based on character position | Use to pull specific segments like codes or tags from a longer text | SUBSTR(X, start, length) |
| CONTAINS_TEXT | Returns TRUE if the field contains a specific substring | Use to filter branded vs non-branded campaigns based on URLs or names | CONTAINS_TEXT(X, search_term) |
Conditional Functions
Conditional functions help your data adapt to rules you define — label campaigns as “High ROI,” fill in missing values, or segment branded vs. non-branded traffic in real time.
| Conditional Functions(Set rules, assign values, or clean up your data based on conditions) | |||
|---|---|---|---|
| Name | What It Does | When to use | Syntax |
| CASE | Evaluates multiple conditions in order and returns the result for the first match | Use to tag campaigns as Brand or Non-Brand based on naming rules or UTM patterns | CASE WHEN condition THEN result […] [ELSE result] END |
| CASE (Simple) | Checks one value against different options and returns the result for the first match | Use to group things like sources or platforms into friendly labels with fewer lines of code | CASE input WHEN match THEN result […] [ELSE result] END |
| COALESCE | Returns the first non-empty value from a list | Use to fill in blank fields with fallback values like “Unknown” or “Other” | COALESCE(X, Y, Z) |
| IF | Checks one condition and returns one result if it’s true, another if it’s false | Use to create quick logic flags like “High CPC” if cost per click is above a set threshold | IF(condition, value_if_true, value_if_false) |
| IFNULL | Returns a backup value if the input is missing | Use to avoid blanks in dashboards by inserting a default value | IFNULL(input, default) |
| NULLIF | Returns null if the input matches a specific value | Use to hide or suppress values like “0” or “n/a” so they don’t skew your reports | NULLIF(input, value_to_hide) |
| CONTAINS_TEXT | Returns TRUE if the field contains a specific substring | Use to filter branded vs non-branded campaigns based on URLs or names | CONTAINS_TEXT(X, search_term) |

Miscellaneous Functions
Use miscellaneous functions to handle the final polish. Turn plain text into clickable links. Add logos, clean up fields, format dates. These are the details that make your dashboard feel sharp and interactive — not just a wall of charts.
| Miscellaneous Functions Chart(Add links, images, or cleanup touches to make dashboards look polished) | |||
|---|---|---|---|
| Name | What It Does | When to use | Syntax |
| CAST | Changes a field’s data type to number, text, date, or time | Use to fix mismatched data types so your fields work properly in charts and formulas | CAST(field_expression AS TYPE) |
| HYPERLINK | Creates a clickable link using a URL and link text | Use to add links to landing pages, reports, or external resources right inside your dashboard | HYPERLINK(URL, link label) |
| IMAGE | Displays an image from a URL with optional alt text | Use to insert brand logos, product photos, or ad previews into your reports | IMAGE(Image URL, [Alternative Text]) |
| NATIVE_DIMENSION | Pushes a SQL expression from the data source and uses it as a dimension | Use to pull calculated values directly from tools like BigQuery using SQL logic | NATIVE_DIMENSION(“SQL”, “TYPE”) |

Calculated Fields for Marketing Metrics
Here are five essential formulas, with step-by-step instructions using real Looker Studio buttons, plus practical advice for when to use (or avoid) each one when building a report to your agency’s clients.
ROAS (Return on Ad Spend)
Don’t use a plain Revenue / Cost formula that only gives row-level ratios and breaks when aggregating. Always wrap metrics in SUM() to get an accurate total ROAS across campaigns. Format as a number with two decimals or a multiplier percentage, for example, 3.50 or 350%.
To add the ROAS calculated field into your Looker Studio report:
- Click Resource, then choose Manage added data sources
- Select your data source and click Edit
- Click + ADD A FIELD in the upper-right corner
- Name the new field ROAS
- Enter this formula: SUM(Revenue) / SUM(Cost)
- Click Save
- In any chart or scorecard, go to Number formatting and adjust the decimals
This metric is useful for comparing how well your paid channels are performing across different campaigns, platforms, or time periods. Just watch out — if your revenue tracking is inconsistent (like some sources not catching offline sales), it can throw off your ROAS numbers.
CTR (Click‑Through Rate)
CTR shows how well your ad creative earns clicks, but a formula without safeguards can break your charts. To avoid division-by-zero errors, wrap the formula with an IF() condition. Format it as a percentage for intuitive reading, especially in visual Looker dashboards.
Add CTR as a calculated field to your report:
- Select Resource from the top menu, then click Manage added data sources
- Choose your data source and click Edit
- Press + ADD A FIELD in the upper-right corner
- Name the field CTR
- Enter the formula IF(SUM(Impressions) = 0, 0, SUM(Clicks) / SUM(Impressions))
- Click Save, then apply Percent formatting with decimals in your widgets
Watch out for zero or null impressions. If you don’t wrap CTR in a safety check — like IF(SUM(Impressions) = 0, 0, SUM(Clicks) / SUM(Impressions)) — your charts might break or display misleading values.
And here’s the strategic catch: CTR only works if your impression data is trustworthy. Many ad platforms track impressions differently, which can skew comparisons. If you’re blending data from multiple platforms, normalize your impression metrics first — or switch to alternate engagement metrics to ensure consistency.
Tip: Always wrap divisions like CTR in IF() logic. This prevents chart-breaking errors when impressions = 0.
CPA (Cost Per Acquisition)
CPA only tells the truth when conversions reflect your campaign goals. Make sure you track leads, sign-ups and purchases — not just generic conversions.
To speed up CPA reporting, add a custom field with a CPA formula:
- Go to Resource > Manage added data sources
- Select and edit your data source
- Click + ADD A FIELD
- Name it CPA
- Enter SUM(Cost) / SUM(Conversions)
- Save and format as Currency
Tip: Prefix “Cost” and “Conversions” with your data source name if blending multiple sources.
Conversion Rate
Conversion rate changes depending on your goal:
- For ads, set it on clicks.
- For on-site behavior like form fills, use sessions.
Separate macro conversions (like purchases) from micro ones (email sign-ups) so each gets its own spotlight. Format the result as a percentage so the data tells a simple and clear story.
Example: If you’re tracking email sign-ups, your conversion rate might be something like 4.2%. But if you’re measuring purchases instead, that number will likely be lower — and that’s expected. Always align your metrics to the goal, and don’t mix them.
To add conversion rate with calculated fields in your Looker Studio report:
To set up conversion rate:
- Go to Resource > Manage added data sources
- Select and edit your data source
- Click + ADD A FIELD
- Name it Conversion Rate
- Enter SUM(Conversions) / SUM(Clicks) (or replace Clicks with Sessions if measuring on‑site activity)
- Set type to Percent and use two decimal places
- Save the field.
Stick to one denominator. Avoid mixing clicks with sessions — that muddies your story.
Always say “Click‑to‑lead %” or “Session‑to‑signup %,” not a bland “conversion rate.”
Use your chosen formula — clicks or sessions — and format as a clear percentage.
Fix unreliable tracking first. A broken event fires nothing, and no metric will save you.
| Conversion Rate Comparison | ||
|---|---|---|
| Type | Formula | Use |
| Ad conversion | SUM(Conversions) / SUM(Clicks) | Use when goal is ad click → action |
| On-site conversion | SUM(Conversions) / SUM(Sessions) | Best for form fills, sign‑ups, video plays |
| Macro vs Micro | Use separate fields for each | Prevents metric overlap |
Customer Lifetime Value (CLV)
You can’t calculate CLV if your user data is a mess. Clean tracking is non‑negotiable. Use customer-level identifiers — like Customer_ID or email — to prevent duplicate counting.
Example: If a returning shopper buys twice but uses different sessions, you’ll overcount them unless you unify with a customer ID.
To calculate CLV with a custom field:
- Go to Resource > Manage added data sources
- Select your data source and click Edit
- Click + ADD A FIELD
- Name the field CLV
- Use this formula: SUM(Revenue) / COUNT_DISTINCT(Customer ID)
- Set the field type to Currency, then save
Note: Don’t use CLV if you’re working with anonymous session data. Clean up your user IDs first — consolidate them across platforms using tags or CRM exports. Only then does CLV tell a story that’s worth showing to clients.
Use CLV to:
- Show client retention strength
- Forecast revenue potential
- Compare against CAC (customer acquisition cost) to prove marketing ROI
Tip: Just make sure your customer-level data is clean before you do any of this — otherwise, your “CLV” is just noise.
| CLV Use Cases & Requirements | ||
|---|---|---|
| Use Case | Recommended? | Requirements |
| Show retention value | Yes | Clean customer-level data (e.g., Customer_ID, Email) |
| Forecast revenue | Yes | Consistent transaction tracking over time |
| LTV vs CAC comparison | Yes | Accurate acquisition cost + distinct user tracking |
| Anonymous session data | No | Cannot calculate distinct customer averages |
Common Mistakes When Using Looker Studio Functions
Looker Studio gives marketing agencies serious reporting power, but without proper setup, client dashboards can mislead or load slowly. So, after you’ve got your client report ready, go ahead and check whether you don’t tick one of these mistakes we’re talking about below.
Aggregation Errors
Don’t wrap already-aggregated fields in SUM() — it breaks your formulas. Google Analytics (and other connectors) often send pre-aggregated data, and applying SUM() again throws this error: “Re-aggregating metrics is not supported.”
Here’s how to avoid it:
- Know your data: Is it raw (row-level) or aggregated?
- Skip SUM() on fields like Sessions, Users, Pageviews from GA — they’re already summed
- DO use SUM() when blending raw data from CRMs or Shopify exports
- Build your complex formulas before blending, so Looker Studio doesn’t get confused
Data Type Mismatches
One of the most common silent killers? Data type mismatches.
- Example: A field looks like a number but is stored as text (“100” instead of 100)
- Result: Your math formulas fail or return null
Avoid this with these fixes:
- Use CAST(Field AS NUMBER) to convert text-based numbers
- Use PARSE_DATE(“%Y-%m-%d”, Date_Field) for string-to-date fixes
- Don’t mix metrics (e.g., Spend) with dimensions (e.g., Campaign Name) inside the same formula unless you’re sure
Data Blending Errors
Blending data across platforms is powerful — but dangerous if done sloppily. Here’s what breaks it:
- Join keys that don’t match — Campaign_A ≠ campaign_a
- Inconsistent time formats — 2025-01 vs Jan 2025
- Different granularities — daily vs monthly data
And here’s how to fix it:
- Normalize join keys: use LOWER() or standard naming before import
- Match your granularity before blending — convert all to monthly or daily first
- Blend only the fields you actually plan to use
- After blending, test with a basic line chart — watch for empty rows or errors
Advanced Tips on Looker Studio Functions
Your marketing agency reports should do more than look pretty. The difference between good agencies and great ones? Going beyond surface metrics to show attribution paths, customer lifetime patterns, and true cross-channel performance.
Multi‑Touch Attribution
Multi-touch attribution (MTA) proves your marketing strategy works across the whole funnel — not just the last click.
Here’s a breakdown of the most common models:
- First-touch: 100% credit to the first interaction
- Last-touch: 100% credit to the final interaction
- Linear: Equal weight to each step
Example: A user first sees a Facebook ad, clicks a Google search result, then converts via an email. Without MTA, only the email gets credit — masking Facebook’s role.
Set up Linear Attribution in Looker Studio with BigQuery:
- Export raw event/session data from GA4 to BigQuery
- In BigQuery, use SQL to flag touchpoint order and calculate touch_count per user
- Go to Resource > Manage added data sources in Looker Studio
- Edit your BigQuery data source
- Click + ADD A FIELD
- Name: Linear Credit
- Formula: Revenue / touch_count
- Save and apply it to a scorecard or bar chart

Cohort Analysis
Cohort analysis tracks how specific groups of users behave over time — perfect for answering: “Are customers acquired in January sticking around longer than those in March?”
Steps to implement:
- Clean and standardize acquisition dates in GA4 or BigQuery
- Create a Cohort Month field:
PARSE_DATE(“%Y-%m”, First_Touch_Date) - Build retention markers:
IF(DATE_DIFF(Event_Date, Cohort_Month, MONTH) = 1, 1, 0) - Visualize using a pivot table:
- Rows: Cohort Month
- Columns: Months since acquisition
- Values: % Retained = SUM(Retention_Flags) / COUNT(Users)
Cross-Channel Reporting
Reporting on Google Ads, Facebook, LinkedIn, and email separately tells you nothing about how they work together. If you want the real story — how each touchpoint helps drive conversions — you need to unify your data.
- Start by cleaning up your naming conventions. Your campaign names, sources, and mediums should match across every platform. If one source says Spring_25 and another says spring25, your blend will break.
- Rename your fields to match. Use the same names — like Spend, Conversions, and Campaign — in every data source, even if you need to create calculated fields to do it.
- Use Date + Campaign as your join key when blending. This gives you a reliable cross-platform match.
- Create combined metrics to track performance in one view:
Total Spend = SUM(GoogleAds.Spend + Facebook.Spend + LinkedIn.Spend)
Drop those metrics into your charts to show what actually worked — not just per platform, but across all of them.

Keep Your Reports Running Smoothly
Slow reports kill trust fast. You can have the smartest functions in the world — if the dashboard stalls, no one stays to see them at work. This section walks you through quick, concrete ways to speed things up and keep your reports clean, fast, and easy to use.
Speed Up Your Load Times
Keep your reports fast — no one trusts a dashboard that takes forever to load.
- Cap calculated fields at 15–20 per data source
- Too many custom fields = slow queries. If your report crawls, trim your formula count
- Pre-calculate heavy metrics before they hit Looker
- Do the math in BigQuery or Sheets first — not in Looker Studio. This keeps your widgets snappy
- Use the Extract Data connector to cache reports
- Instead of querying APIs every time, cache a clean subset of your data with the Extract Data connector
- Pull only what you need
- Don’t load all 75 fields. Stick to the essentials — spend, conversions, campaign name, and maybe one or two calculated fields
This will optimize query time, prevent timeouts, and keep reports responsive to anyone navigating through them.

Work on Report Design
Build dashboards that perform as well as they look.
Make sure to:
- Split content across multiple pages instead of cramming everything onto one screen
- Keep components under 25 per page so the UI is not overloaded
- Keep in mind mobile view too — put essential charts front and center, tuck secondary data behind tabs or separate views
- Explore responsive report settings that automatically group your widgets depending on the device
To enable responsive layout:
- Go to Create, then choose Report
- Connect your data source and authorize the connection, if needed
- In the Theme and Layout settings, choose the Layout tab
- Then, select Responsive instead of Freeform in the Layout mode settings
- After reloading, your report will switch to a 12-column grid with adjustable sections

Manage Your Data Sources
Your data’s only as good as its freshness — and your quota headroom.
Stick to these best practices to keep data and reports up-to-date:
- Turn on caching wherever possible — let Looker reuse query results instead of reloading every time
- Use Extract Data for stable metrics — if data doesn’t change hourly, cache it with Extract Data and refresh daily
- Watch for refresh caps and quotas —Meta Ads, BigQuery, and other high-volume platforms have strict limits
- Match refresh frequency to the campaign’s speed:
- Active campaigns = hourly
- Weekly performance reports = daily
The Limits of Looker Studio’s Built-in Connectors
Looker Studio limits how much data you can blend and how long queries run. Complex functions can slow reports or cause timeouts. This section shows how to manage data size and keep formulas running smoothly.
Looker Studio offers the smoothest experience when you’re working with Google’s own tools. The built-in connectors handle most marketing data out of the box, making setup simple and cost-free.
- Pull data directly from Google Ads, Analytics 4 (GA4), Search Console, YouTube Analytics, and more
- Access campaign, account, website, SEO, and video metrics from inside Google’s ecosystem
- Skip third-party fees — all core features here are free
However, there are some limits you need to work around — we’ve gathered them all in this chart along with the best solutions:
| Key Looker Studio Limitations and Workarounds | ||
|---|---|---|
| Limitation | Description | Recommended Workaround |
| 5-source blending limit | Can only blend up to 5 data sources in a single chart | Pre-blend in Google Sheets or a data warehouse |
| 100 MB Extract Data cap | Datasets larger than 100MB will fail | Slice or pre-aggregate data using BigQuery |
| 6-minute query timeout | Long queries time out and break reports | Simplify formulas or spread calculations by page |
| Third-party connector refresh caps | Some connectors stop refreshing after quota limits | Upgrade to paid tier or cache with Extract Data |
| Chart row display limit (1,000 rows) | Large datasets are clipped | Paginate or summarize metrics |
And the biggest struggle of them all — pulling data from Facebook Ads, LinkedIn, or X means using Looker third-party connectors like Catchr, Supermetrics, or Windsor.ai:
- Catchr: Lightweight and affordable, but limited support for advanced metrics
- Supermetrics: Broad platform support and strong reliability, but no free tier
- Windsor.ai: Flexible and attribution-focused, with a usable free tier but slower syncs
These tools get the job done — just be ready for subscription fees and the occasional refresh delay.
How to Fix Common Looker Studio Errors
A missing bracket or mixing numbers and text can break your formulas silently. These mistakes happen often and can ruin your reports. This section helps you catch and fix them fast so your functions work as intended.
System Errors
When Looker Studio throws a system error, it usually comes down to one of three things:
- A broken or disconnected data connector
- An expired authentication token
- A data source that’s too large or takes too long to load
To troubleshoot:
- Check if all data connectors are live and re-authorized
- If using BigQuery or Sheets, verify you haven’t hit row, cell, or query-size limits
- If errors persist, inspect blended data sources — formula logic might have silently broken after platform updates

Formula Errors
Calculated fields can break for simple reasons — bad syntax, missing fields, or forgotten aggregation functions like SUM() or COUNT(). Even a stray space or typo can kill a formula.

Here are the error messages you’ll probably run into:
- Invalid formula: Usually a syntax issue (e.g., missing brackets or quotes)
- Field not found: The formula refers to a field that doesn’t exist or is misnamed
- Data type mismatch: You’re doing math on a text field or mixing incompatible types
- Expected aggregation: You forgot to wrap a metric like Cost in SUM()
- Result not a valid number: Likely caused by dividing by zero or using a null value
To fix these errors:
- Open the data source and click the fx icon next to the broken field
- Start with a simple test formula like SUM(Cost) to confirm the field works
- Add complexity back in gradually, checking field names and capitalization
- Test the final formula in a temporary scorecard or table to verify it behaves correctly
Data Discrepancies
When Looker Studio numbers don’t match Google Ads, Meta Ads, or GA4, your credibility takes a hit. Here’s how to debug mismatches fast:
- Make sure date ranges, time zones, and filters match exactly between Looker Studio and the source platform
- Download row-level exports from both sides and compare line-by-line
- Look for duplicates, join key mismatches, or dropped rows
- Add the same metric to both a scorecard and a chart
- If the numbers differ, check for hidden filters or report-level control
Example: If your Meta Ads conversions show 1,100 in-platform but only 900 in Looker, inspect the connector’s timezone settings or attribution windows — they may default to different models.
When to Use Looker Studio vs Alternatives
Looker Studio works best when your agency is already deep in the Google ecosystem. It’s ideal for building interactive, self-serve dashboards that clients can explore on their own — no dev team needed, no license fees.
Use Looker Studio when:
- You’re reporting across Google Ads, GA4, Search Console, or YouTube
- You need real-time dashboards that update as data comes in
- Your clients want to click around, apply filters, and drill into details
- You don’t want to manage a paid license or BI infrastructure
Looker Studio isn’t always the right choice for your agency.
Look elsewhere if:
- Most of your data lives outside Google (e.g. HubSpot, Salesforce, TikTok Ads)
- You need deeper collaboration, commenting, or permissions for large teams
- You’re building advanced attribution models or complex multi-touch flows
- Your clients expect white-labeled, highly polished PDF reports
In those cases, consider alternatives built for agencies.
| Looker Studio vs. Reporting Alternatives | ||
|---|---|---|
| Platform | Best For | Drawbacks |
| Looker Studio | Free, interactive dashboards for Google data | Limited cross-channel features, 5-blend cap |
| Swydo | Agency workflows, PDF reporting, KPI alerts | Less customizable visuals |
| Databox | Quick setup, visual KPIs across platforms | Requires paid plan for key features |
| AgencyAnalytics | White-labeled dashboards, client login portals | Fewer customization options for metrics |
| Power BI or Tableau | Deep BI, internal enterprise reporting | High complexity, steep learning curve |
Follow This Checklist for Looker Studio Functions
Get your Looker Studio setup right from the start. Whether you’re creating calculated fields, blending sources, or optimizing performance, this checklist helps you avoid formula errors and dashboard slowdowns.
- Always wrap your metrics in aggregation functions like SUM(), COUNT(), or MAX()
- Try new formulas on a single widget or a narrow date range (like one month) to catch issues early
- Leave yourself a comment when writing advanced formulas so you (or your team) know what it’s doing
- Use clear naming patterns — lowercase with underscores (e.g., total_cost, ctr_rate)
- Use IF() statements to protect against zeros, nulls, or missing values
- Before major changes, duplicate the report and label it clearly (e.g., client_dashboard_v2.1_May2025)
- Review your formulas monthly
- Delete unused fields
- Remove redundant data sources
- Simplify bloated formulas
Looker Functions Speed Up Deep Reporting Insights
Looker Studio gives you advanced tools to automate the reporting grind. With calculated fields, smart functions, and blended sources, you can turn manual ROAS updates and weekly CTR crunching into self-refreshing dashboards. What used to eat up your Monday mornings? Now it runs itself.
Key Things You Need to Know
- Automate where you can — calculated fields keep your reports current without manual updates
- Formulas power the logic — but clear naming and structure make them usable
- Prioritize quality over quantity — it’s better to have a few key metrics that tell a story than a dashboard crowded with noise
- Stay proactive with maintenance — schedule monthly check-ins to prune unused fields, tidy formulas, and boost performance
- Embrace continuous learning — Looker Studio evolves fast; keep up by exploring Google’s docs, community forums, and free courses
Looking for more?
- Check Google’s Looker Studio documentation
- Browse Google Data Studio community forums
- Try free Looker Studio courses from Google Skillshop
Looker Studio works — but it wasn’t made for agencies. Swydo was. Try it free for 14 days and see the difference purpose-built reporting makes.
Looker Studio Functions FAQ
Quick answers to the most searched questions about Looker Studio calculated fields
A calculated field creates new metrics or dimensions using formulas. Instead of manually calculating ROAS in spreadsheets, you create a calculated field that automatically computes Revenue ÷ Cost for every row in your report.
Go to Resource → Manage added data sources → Edit your data source → Click “+ ADD A FIELD” → Enter your formula → Save. Always test with a simple metric first.
Yes, for accurate totals. Use SUM(Revenue)/SUM(Cost) instead of Revenue/Cost. Without SUM(), you get row-level calculations that break when viewing aggregated data across multiple campaigns.
Yes, but avoid re-aggregating pre-aggregated metrics. GA4 fields like Sessions and Users are already summed. Don’t wrap them in SUM() again—it causes “Re-aggregating metrics is not supported” errors.
Dimensions are categories (campaign names, dates, locations). Metrics are numbers you measure (cost, clicks, revenue). Use text functions for dimensions, math functions for metrics.
Formula: SUM(Revenue) / SUM(Cost). Format as number with 2 decimals (3.50) or percentage (350%). Always wrap both metrics in SUM() for accurate aggregation.
Use: IF(SUM(Impressions) = 0, 0, SUM(Clicks) / SUM(Impressions)). The IF statement prevents division-by-zero errors when impressions are missing.
Formula: SUM(Cost) / SUM(Conversions). Format as currency. Make sure your “Conversions” field tracks actual acquisitions, not just clicks or impressions.
Use: CASE WHEN CONTAINS_TEXT(Campaign, “brand”) THEN “Branded” ELSE “Non-Branded” END. Adjust the text pattern to match your naming conventions.
Use COALESCE(field, 0) to replace nulls with zero, or IFNULL(field, “Unknown”) for text replacements. This prevents blank cells from breaking your charts.
Yes. Syntax: IF(condition, value_if_true, value_if_false). Example: IF(SUM(Cost) > 1000, “High Spend”, “Low Spend”) creates spend categories.
Use REGEXP_EXTRACT(Campaign, “pattern”) to pull specific parts. Example: REGEXP_EXTRACT(Campaign, “facebook|google|youtube”) extracts the platform name from campaign strings.
Common causes: missing parentheses, wrong field names, data type mismatches, or missing aggregation functions. Test with SUM(field_name) first to verify the field exists.
The field name in your formula doesn’t exist or is misspelled. Check exact spelling, capitalization, and spaces. Copy field names directly from the available fields list.
Check date ranges, time zones, and attribution windows. Different platforms use different default settings. Also verify that filters match exactly between Looker Studio and your source.
You’re mixing text and numbers. Use CAST(field AS NUMBER) to convert text-formatted numbers, or CAST(field AS TEXT) to convert numbers to text for concatenation.
Charts apply different groupings and filters. A metric aggregated by campaign will differ from the same metric aggregated by date. This is normal behavior—check your chart dimensions.
No hard limit, but keep it under 15-20 per data source for optimal performance. Too many calculated fields slow down queries and report loading times.
Reduce calculated fields, limit data range, use Extract Data connector for caching, or pre-calculate complex metrics in BigQuery/Sheets before importing to Looker Studio.
For complex calculations, do them in BigQuery or Google Sheets first. Use Looker Studio calculated fields for simple metrics that need to adjust based on report filters.
Yes. Looker Studio has a 6-minute query timeout. Complex formulas with large datasets can hit this limit. Simplify formulas or reduce data volume to prevent timeouts.
Use simple formulas, avoid nested calculations, limit date ranges, enable data caching, and delete unused fields. Test performance with sample data before deploying to production.
Skip the complex formulas and automate your client reporting with pre-built templates.
Start Your Free Trial Today