You’re a marketing agency, so you’re constantly looking for ways to make your clients feel good and show them you’re doing a great job. It’s a constant fight to keep clients informed and interested while you’re trying to handle everything else.
You’ve probably been debating dashboards vs. reports for client updates. But what’s the real difference between the two, and when is each one the right tool for the job?
Why Choosing the Right Reporting Tool is Critical
Picking the wrong reporting method can have disastrous consequences for your agency:
- Confused and frustrated clients who can’t understand the data you’re showing them
- Hours wasted building reports that no one reads
- Endless headaches trying to combine data from a dozen different platforms
- Clients questioning your value and expertise, putting retainers and relationships in jeopardy
But when you nail your reporting approach, it changes everything. Suddenly you’re not just another vendor, but an indispensable strategic partner delivering insights your clients can’t get enough of. Reporting becomes your secret weapon for retaining hard-won accounts and beating the competition.
To get there, you first need to fully grasp how dashboards and reports stack up, and where each one shines.
What Are Dashboards? Why Use Them? How They Benefit You
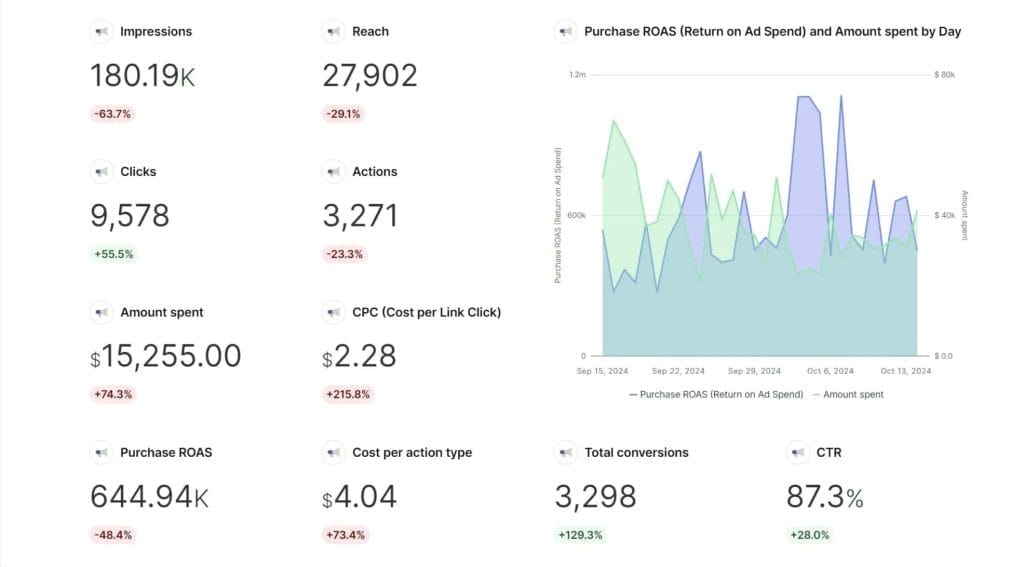
A marketing dashboard is like the mission control center for your campaigns. For agencies managing complex digital campaigns, dashboards serve a similar purpose. They give you a real-time, continuously updated pulse on the metrics that matter most:
- Fuel gauges to monitor budget pacing and burn rate
- Speedometers to track click-through rates, conversion rates, and cost per acquisition
- Altitude meters to keep tabs on reach, impressions, and brand lift
- Trajectory plots to visualize performance trends over time
- Warning lights to alert you to potential issues or anomalies
Having all this data readily available enables you to make split-second adjustments for optimal performance, course correction, and campaign success.
With the right dashboard, you gain x-ray vision into the constantly shifting state of your campaigns and can take action before small problems snowball into major disasters:
| Use Case | How Dashboards Help |
|---|---|
| Pacing ad spend | Catch campaigns burning through budget too fast (or too slow) and make adjustments to hit client targets |
| Optimizing creative and targeting | Identify the variables causing click-through and conversion rate dips. |
| Monitoring key conversions | Stay on top of signups, purchases, or other critical actions and spot troubling dips early |
| Keeping clients informed | Give stakeholders a high-level, jargon-free window into how things are going at any given moment |
The Competitive Advantages of Real-Time Dashboard Insights
Dashboards are much more than fancy window dressing. When used strategically, they give agencies a huge competitive advantage:
- Quicker Insights, Better Results. With real-time data at your fingertips, you can spot and solve issues in hours, not weeks – keeping performance and client satisfaction high.
- Smarter Optimizations, More Impact. Forget guessing or going with your gut. Dashboards help you make every optimization and testing decision based on hard numbers.
- Deeper Client Trust, Longer Engagements. When you give your clients a transparent, always-on view into performance, you build rock-solid credibility and confidence in your agency.
- Streamlined Management, Happier Teams. Automating data pulls and reporting with dashboards frees up your team to focus on interpreting data, not just compiling it.
- Distinctive Expertise, Competitive Separation. Interactive dashboards custom built for a client’s unique KPIs and business needs showcase your agency’s technical chops and strategic thinking in one fell swoop.
- Tailored to Continuous Data for Real-Time Impact. Dashboards handle continuous data like click-through rates and budget pacing effortlessly. Their real-time updates let agencies quickly identify trends, address issues, and keep campaigns running smoothly.
Dashboards aren’t a cure-all, though. They excel at surfacing the what of campaign performance, but often say little about the why behind the numbers.
To truly diagnose the drivers of performance and extract lessons to apply next time, you need to dive deeper. That’s where the tried-and-true marketing report comes in.

What Are Reports? Why Use Them? How They Benefit You
Marketing reports are like a state-of-the-art laboratory for analyzing the results of your campaigns. They allow you to go beyond surface-level observations and dig deep into the data:
- Segment your data by key dimensions like audience demographics, ad placements, or creative variants to isolate top-performing or underperforming elements
- Analyze full-funnel impact to understand how different touchpoints contribute to conversions and revenue
- Identify patterns, trends, and anomalies that can inform future optimizations and tests
- Synthesize your findings into actionable recommendations and strategic insights
- Package your analysis into a compelling narrative that resonates with stakeholders
Marketing reports are used to document findings, draw conclusions, and inform future campaign strategies. They tell the story of your campaigns, highlight key learnings, and chart a data-driven path forward.
In the hands of a skilled agency analyst or strategist, reports become treasure maps leading to powerful optimizations and ideas to dramatically move the needle for clients:
| Use Case | How Reports Deliver |
|---|---|
| Diagnosing campaign issues | Slice data by key dimensions like geo, audience, device to pinpoint what’s working and what’s not |
| Identifying growth opportunities | Analyze full-funnel impact to highlight top-of-funnel segments and tactics to scale |
| Quantifying test results | Prove out winning variants from messaging, creative, landing page and bid tests |
| Extracting audience insights | Profile high-value customers and spot behavioral or demographic patterns to target |
| Proving channel ROI | Show how each piece of the media mix contributes to bottom-line conversions and revenue |
Powerful Storytelling to Make Your Reports Resonate
Of course, even the most insight-packed report is useless if it puts clients to sleep or leaves them confused. To get clients to actually read and act on your reports, you need to bring the data to life through compelling narratives.
Some tips for turning boring numbers into riveting performance stories clients can’t wait to read:
- TL;DR Like a Boss. Busy clients will love you for including a quick hits section right up front with the key takeaways, results, and recommendations that matter most.
- More Exciting, Less Dull. Avoid boring, generic titles and section headers. Use punchy, scannable headers that call out juicy insights and pique curiosity.
- Avoid Creating Cluttered Charts. Visuals should make data easier to digest, not dazzle. Each chart should have a clear point and reinforce key messages.
- Steer Clear of Vanity Metrics. Clients see right through fluff metrics that make things look better than they are. Keep things credible by focusing on the KPIs that actually drive their bottom line.
- Stay Plugged into What Matters. The more you can frame your reports and insights in the context of your client’s larger marketing targets and business objectives, the more essential you’ll become.
The secret to great reports clients love comes down to combining analytical rigor with a knack for storytelling. You need the quant skills of a data scientist, but also the empathy and EQ of a strategist who deeply understands a client’s world and what keeps them up at night.
When you strike this balance, your reports won’t just inform, but inspire – rallying clients around those key opportunities and critical moves that will make or break their marketing success.

Dashboards vs. Reports: Which Tool to Use and When
So when should you turn to dashboards vs. reports to keep clients engaged and informed? As with most things in marketing, it depends.
Different client communication scenarios call for different approaches. Let’s break down a few common ones and which deliverable fits best.
Dashboards for Regular Pulse Checks on Always-On Campaigns
You have a standing weekly meeting to keep a client up to speed on how their always-on digital campaigns are performing.
For tactical, surface-level updates focused on core KPIs and pacing toward monthly or quarterly goals, dashboards are your best friend. A few must-haves:
- Ability to provide different views by channel to compare performance
- Budget pacing and delivery metrics prominently displayed
- Benchmark comparisons to know if you’re on track or behind
- Toggles to adjust spend, CPC and conversion targets and see projections
With the right dashboard guiding your discussion, these weekly downloads become highly efficient and actionable. You can proactively address client questions and make smart optimizations on the spot to keep things humming.
Reports for Quarterly Deep Dives into the Drivers of Performance
For milestone meetings like quarterly business reviews, topline pacing and efficiency metrics only tell part of the story. Here, you’ll want to come prepared with a more substantive report that goes deeper into the why behind the numbers.
To build a compelling QBR report that sets you up for success next quarter, include:
- Executive summary with key learnings, results, and recommendations
- Quarter-over-quarter and year-over-year comparisons for context
- Breakdowns by key dimensions like audience, message, and creative
- Conversion and full-funnel attribution analysis by channel and campaign
- Macro industry and competitive trends impacting performance
- Proposed tests, experiments and strategy tweaks for next quarter
Think of QBR reports as your chance to show off your team’s analytical firepower and strategic thinking. Dig deep into the data, connect dots, and prescribe clear actions that demonstrate your agency is proactively solving for next quarter and beyond.
Rigorous Reports for High-Stakes Marketing Attribution and Media Mix Modeling
As critical as it is to prove the value of your agency’s work, you’ll need to go all out when building reports for marketing attribution, media efficiency and budget planning with senior client stakeholders.
For this high-stakes analysis and modeling, blend performance data from across the full media mix along with custom visuals purpose-built to address a CMO’s burning questions:
- Marketing efficiency ratios and revenue impact by channel
- Conversion rate, CPA and ROAS trends across the buyer journey
- Media contribution to pipeline and closed-won revenue
- Channel overlap and synergies to find chances to re-allocate spend
- Forecasted outcomes and ROI of media at different spend levels
- Recommended media mix and budgets to maximize conversions or ROAS
While a baseline performance dashboard can help lay the groundwork, attribution and media mix reports require a whole other level of statistical rigor and data wizardry. Don’t skimp on the analysis, and be ready to get in the weeds with clients to ensure your recommendations are ironclad.
Picking Reporting Tools That Won’t Slow You Down
Of course, even the smartest approach to dashboards and reports falls flat without the right tech stack to bring it to life.
Speed and flexibility are paramount. You need tools that make it a breeze to turn mountains of data into clear, compelling visuals without burning through hours of billable time.
For dashboards designed to keep tabs on active campaigns and creative, look for platforms that can:
- Automatically sync data from ad platforms, web analytics, and CRM systems
- Deliver real-time or near real-time data without manual refreshing
- Provide interactive, customizable views to slice data on the fly
- Bake in your agency’s own brand style and visual design elements
- Embed seamlessly into your agency’s existing reporting tools or processes
On the reporting side, a flexible business intelligence tool should be your go-to, with key capabilities like:
- Robust data transformation and modeling to tell stories across metrics
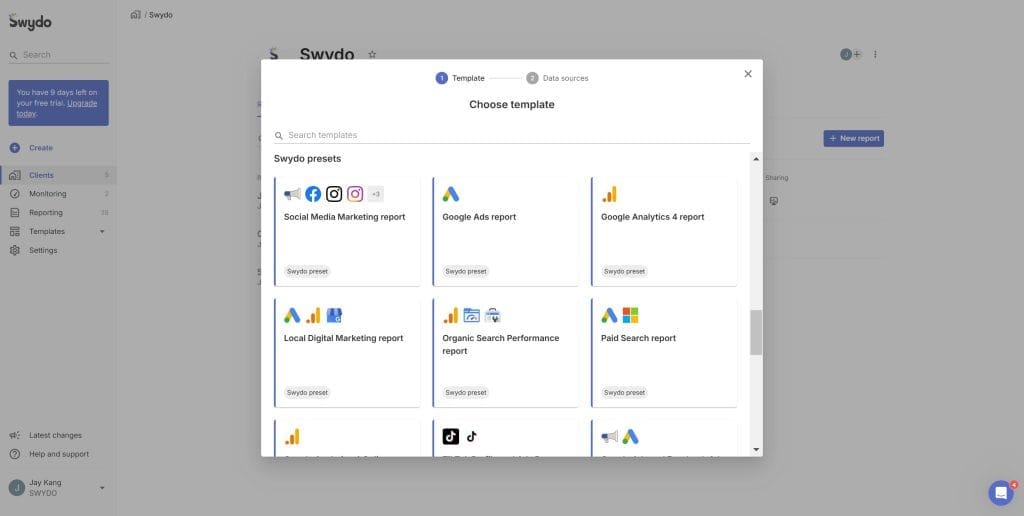
- Extensive library of templates for common reporting scenarios and KPIs
- Ability to create custom visualizations or pull in assets from design apps
- Streamlined workflow for writing, editing, and collaborating on reports
- Support for data security and compliance requirements based on client needs
Whether you build or buy, the holy grail is reporting tools that are simple enough for anyone on your team to use, yet powerful enough to handle the most unique client requests without breaking a sweat.

Making Reporting Your Agency Superpower
Reporting is, for most, a necessary evil at best, and a total afterthought at worst. Dashboards default to the same vanity metrics, reports get hastily slapped together minutes before a client meeting.
But for agencies willing to put in the effort, reporting can be an incredible differentiator – a silver bullet for winning clients’ hearts, minds and budgets.
To turn data into your agency’s secret sauce:
- Dashboards on Demand. Build plug-and-play dashboards for common client use cases so you can deliver live metrics within hours of kickoff instead of weeks.
- Storytelling as a Service. Train your team to spot compelling narratives in the data and bring them to life in reports through clear, concise data stories that hit home.
- Analysis With Attitude. Don’t just describe the data – prescribe it. Always come to reports locked and loaded with data-backed recommendations to improve results next time.
- Less Reporting, More Consulting. Use reporting as a jumping off point to proactively advise clients on broader marketing, audience and funnel optimizations.
- Apply Lessons Learned From Multiple Clients. Identify common reporting challenges or scenarios across accounts and build scalable models to solve them more efficiently.
When your dashboards answer questions before clients even think to ask them, your reports surface hard-hitting insights no one else sees, and your analysis paves a clear path forward – that’s when you become utterly irreplaceable.
Reporting goes from a routine checkbox to a strategic linchpin. You’re not just reporting the news, but writing the headlines. You’re creating a constant feedback loop for clients to continuously measure, learn and improve.
You’re turning data into your agency’s most powerful asset for fueling client success. And that’s how you’ll win their business, trust and loyalty for the long haul.
Frequently Asked Questions About Dashboards and Reports

As a marketing agency, you likely have a lot of questions about how to effectively leverage dashboards and reports to drive results for your clients. Here are some common questions and answers to help guide your reporting strategy.
What is the main difference between a dashboard and a report?
The primary difference lies in their purpose and level of detail. A dashboard is a real-time, high-level overview of key performance metrics, designed for at-a-glance monitoring and quick decision-making. Reports, on the other hand, provide a more comprehensive, in-depth analysis of performance over a specific time period, often with a narrative component to provide context and insights.
What are the key elements of an effective dashboard?
An effective dashboard should:
- Focus on the most critical KPIs and metrics that align with the client’s goals
- Provide real-time or near-real-time data updates
- Offer clear, visually compelling data visualizations that are easy to interpret
- Allow for customization and filtering by key dimensions like channel, campaign, or audience
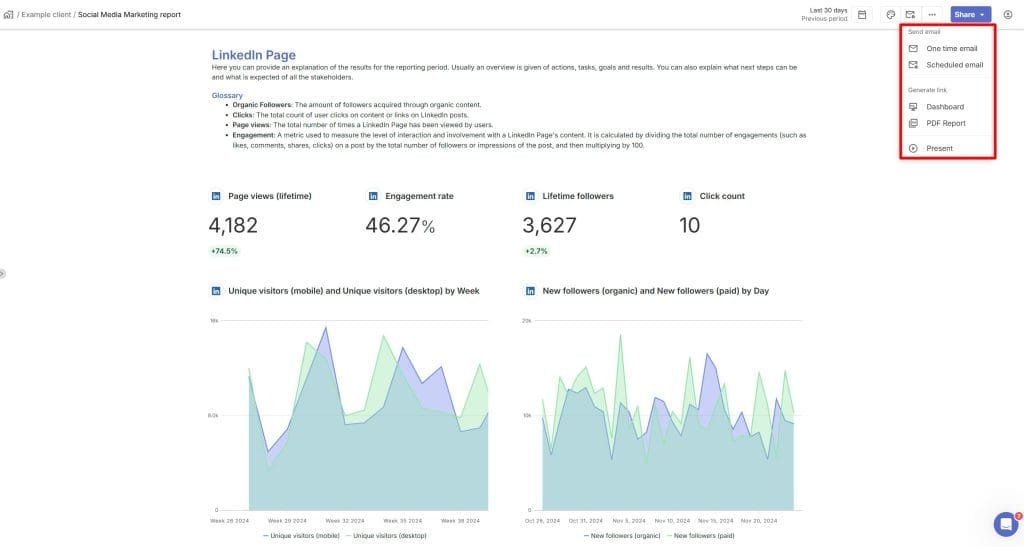
- Be easily shareable and accessible to all relevant stakeholders
What should a comprehensive marketing report include?
A thorough marketing report should encompass:
- An executive summary highlighting key takeaways, results, and recommendations
- Detailed performance metrics and KPIs relevant to the client’s objectives
- Breakdowns and comparisons by channel, campaign, audience, creative, and other key dimensions
- Insights into trends, patterns, and anomalies in the data
- Attribution analysis showing the impact of marketing efforts on conversions and revenue
- Actionable recommendations and next steps based on the data
How often should I send reports to clients?
The frequency of your reporting cadence will depend on the specific needs and preferences of each client, as well as the nature of the campaigns you’re managing. That said, a general rule of thumb is:
- Dashboards: Provide 24/7 access, with real-time or daily updates
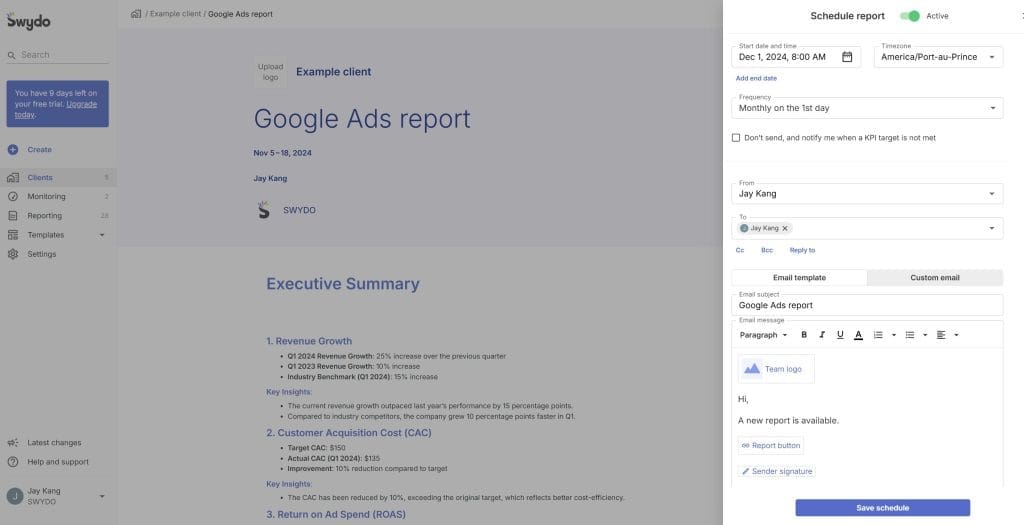
- Weekly Reports: High-level performance summaries focused on key metrics and pacing
- Monthly Reports: More in-depth analysis of monthly performance, trends, and optimizations
- Quarterly Reports: Comprehensive review of quarterly results, learnings, and go-forward strategy
The key is to find a reporting rhythm that provides enough visibility and insight to keep clients informed and engaged, without overwhelming them with too much data too frequently.
How can I make sure my client actually reads and acts on my reports?
To create reports that resonate with clients and drive action, try these tips:
- Keep it concise and scannable, with clear headers, bullet points, and data visualizations
- Lead with the insights and takeaways that matter most to the client’s business
- Tailor the language, metrics, and level of detail to the specific audience and stakeholders
- Provide a mix of high-level summaries and granular details to cater to different reader preferences
- Include specific, actionable recommendations and next steps, not just data dumps
- Follow up with clients to walk through key findings and answer any questions
At the end of the day, the most impactful reports are the ones that not only inform, but also inspire clients to make data-driven decisions and take strategic action.
Key Takeaway
So when it comes down to it, should your agency prioritize dashboards or reports? The answer is both – when used strategically and in the right contexts.
Dashboards are ideal for:
- Always-on campaign monitoring and optimization
- Keeping a pulse on high-level KPIs and performance trends
- Providing clients with self-serve, on-demand access to real-time data
- Quick, ad-hoc analysis and decision-making
Reports are better suited for:
- In-depth performance analysis and insights
- Understanding the why behind the what of the numbers
- Storytelling and synthesizing data into a cohesive narrative
- Providing strategic recommendations and action plans
The most successful agencies know how to wield both dashboards and reports as complementary tools in their analytics arsenal – using dashboards for agile, day-to-day optimization, and reports for more strategic, big-picture planning and communication.
Dashboards or reports? Deliver both with ease and keep clients impressed.
Start Your Free Trial Today