
Facebook Ads metrics are the numbers inside Meta Ads Manager that tell you whether your client’s campaign is profitable, wasteful, or ready to scale. The 15 metrics in this guide are ranked by how directly they affect your client’s bottom line—and they start with the ones that answer the only question every client actually cares about: is this worth my money?
But Meta’s platform looks different than it did a year ago. Advantage+ campaigns are now the default. Over 100 metrics were deprecated from the API. Attribution windows were permanently removed. And a measurement system called Incremental Attribution now lets you prove that your ads actually caused the sale—not just touched it along the way.
For agencies, that opens up a real opportunity. The teams who understand today’s measurement system can deliver sharper reports, set better expectations, and prove value in ways their competitors simply can’t. The ones still relying on last year’s frameworks? They’re reporting numbers that no longer mean what they think.
Whether you’re about to build a client dashboard, prep for a QBR, or figure out why CPA spiked last Tuesday—this is your playbook. Let’s get into it.
The Facebook Ads Metrics Funnel
How all 15 metrics map to each stage of the customer journey — from first impression to revenue
Visibility metrics
Engagement metrics
Consideration metrics
Conversion metrics
What Changed in Meta Ads
Before we get into the individual metrics, you need to understand the platform changes that affect how every single one of them is calculated and reported. Skip this section and your metric analysis will be built on outdated assumptions.
Advantage+ Is Now the Default
Meta eliminated the choice between manual campaigns and Advantage+ Shopping. As of Q2 2025, all Sales, Leads, and App Promotion campaigns start with Advantage+ enabled by default. You can still toggle manual controls, but the platform actively nudges you away from them.
What does this mean for your metrics? Audience-level data gets less granular. Campaign-level metrics become your primary optimization lever. And creative quality metrics like CTR and hook rate matter more than ever, because Meta’s AI now evaluates your creative before it even starts finding users.
Incremental Attribution
This is the biggest measurement shift since iOS 14.5. Launched in April 2025, Incremental Attribution uses holdout testing to measure only the conversions that wouldn’t have happened without your ad. Not conversions the ad touched. Conversions the ad actually caused.
Early results showed a 20–24% improvement in incremental conversions versus standard attribution. It’s available as a campaign-level performance goal and you can view data retroactively from April 1, 2025. If you’re not talking to your clients about this yet, you should be.
Attribution Model Changes
Meta made three changes that directly affect your reported conversion numbers:
- Click-through attribution narrowed. Only link clicks count now. Likes, shares, saves, and comments no longer trigger click-through conversions.
- Engaged-view became engage-through. The threshold dropped from 10 seconds to 5 seconds, and non-click interactions like shares and saves now trigger this attribution category.
- View-through windows removed. The 7-day and 28-day view-through windows were permanently removed from the API on January 12, 2026. Some advertisers lost 30–40% of their reported conversions overnight.
Your default attribution model is now 7-day click, 1-day engage-through, 1-day view. If your client’s numbers look lower than last quarter, this is likely why.
Metric Deprecations
Over 100 metrics were removed from the Meta Ads Insights API on October 30, 2024. You can no longer track unique purchases or unique add-to-carts via API. The 10-second video view metric was deprecated on January 26, 2026. And for organic content, Meta renamed Impressions to Views and Reach to Viewers in Business Suite—though Ads Manager still uses the old terms for paid campaigns. Confusing? Yes. But you need to know this when building reports that combine organic and paid data.
Tracking Infrastructure
If your clients are still running pixel-only tracking, their attribution accuracy is sitting around 40%. That’s not a typo. The Conversions API paired with the Pixel recovers 20–30% of lost conversion data. The Offline Conversions API was deprecated in May 2025. And Event Match Quality scores (rated 0–10) have become a critical health metric—aim for 6.0 or above.
Tracking Infrastructure: The Attribution Accuracy Gap
Your client’s tracking setup determines how much conversion data you actually see
❌ Pixel Only
Meta Pixel Alone
~40%
attribution accuracy
✓ Pixel + Conversions API
Dual Tracking Setup
~60–70%
attribution accuracy
Conversions API recovers 20–30% of lost conversion data that the Pixel alone can’t track
6.0+
out of 10
Event Match Quality Score
Meta’s 0–10 rating for how well your event data matches user profiles. Aim for 6.0 or above — this is now a critical health metric for tracking accuracy.
Poor (0–3)
Fair (4–5)
Good (6–7)
Excellent (8–10)
New Placements
Threads ads went global in mid-2025 and are on by default for new campaigns. Reels Trending Ads showed a 20% boost in unaided awareness and 32% higher ad recall in testing. Over half of Instagram user time is now spent in Reels. If your creative strategy doesn’t account for these placements, you’re leaving reach on the table.
Financial Performance Metrics
These five metrics answer the money questions. They belong at the top of every client report because they directly measure whether the advertising investment is paying off.
1. ROAS (Return on Ad Spend)
ROAS tells you how much revenue your client earns for every dollar they spend on ads. A $1,000 campaign that generates $5,000 in revenue? That’s a 5:1 ROAS. It’s the most important number in your reports because it directly answers the question your client is thinking but might not say out loud: is this actually making me money?
Formula: Revenue ÷ Ad Spend
For benchmarks, e-commerce campaigns typically target 4:1 or higher. Service businesses may find 2:1 perfectly sustainable, especially when customer lifetime value is high. Triple Whale’s analysis of 35,000 e-commerce brands puts the median somewhere between 3:1 and 5:1 depending on vertical and seasonality.
Set ROAS goals with your clients before the campaign launches—not after. Use it to guide budget allocation by shifting spend toward your top performers. And always track ROAS alongside total spend, because a 10:1 ROAS on $100 of spend looks great in a chart but means almost nothing for the business.
Here’s something worth raising in your next client meeting. ROAS behaves differently at each stage of a campaign. In the first two weeks, it often looks rough because Meta’s algorithm is still learning. By weeks three and four, it should improve. If it hasn’t by week four, something needs to change—your targeting, your creative, or your offer.
Context matters more than the number itself. A 2:1 ROAS might sound disappointing, but for a subscription business where customers stick around for 18 months, it could be incredibly profitable. For a low-margin retailer, that same 2:1 might not cover operating costs.
One thing to get ahead of: Meta permanently removed the 7-day and 28-day view-through attribution windows in January 2026. That means your client’s ROAS might appear lower simply because fewer conversions are being attributed. That’s not a performance problem—it’s a measurement change. Explain it before they see the numbers and panic.
Related metrics: CPA, AOV, Incremental Conversions
2. CPA (Cost Per Action/Conversion)
CPA tells you the average cost of getting someone to do the thing you want—buy something, submit a form, install an app. If ROAS is your profitability check, CPA is your efficiency check.
Formula: Total Ad Spend ÷ Number of Conversions
What’s a good CPA right now? Triple Whale’s full-year 2025 data puts the median e-commerce CPA at $38.19. That varies wildly by vertical—lifestyle brands average around $30 while electronics sit closer to $50. WordStream puts the cross-industry average for leads campaigns at $16.22.
So if you’ve been telling clients that a CPA under $30 is “ideal,” it might be time to revisit. For many verticals, $30 is aspirational, not typical.
Low CPA sounds great in a report. But is it actually great? Sometimes a higher CPA brings in better customers. Akvile DeFazio of AKvertise makes this point well: website traffic campaigns directing users to landing page forms often yield higher-quality leads than native forms. You get fewer leads and pay more, but those leads actually convert downstream because they cared enough to leave Facebook and learn more.
Are your cheapest leads actually your best leads? That’s worth investigating before you optimize purely for the lowest number.
How CPA Behaves Over a Campaign Lifecycle
Typical CPA pattern from launch through audience saturation — know what to expect and when to act
Cost Per Acquisition →
Week 1
Learning
Week 2
Dropping
Wk 3–4
Optimizing
Wk 5–8
Efficient
Week 9+
Saturation
Learning
Don’t panic. Resist big changes. Let Meta’s algorithm calibrate.
Optimizing
Small tweaks only. Test one variable at a time.
Efficient
Scale what’s working. Optimize with data, not gut feeling.
Saturation
Refresh creative. Test new audiences before CPA climbs further.
With Advantage+ now controlling more targeting decisions by default, CPA optimization depends increasingly on creative quality and landing page experience rather than audience selection. The algorithm handles the who. You handle the what and the where they land.
Related metrics: ROAS, Conversion Rate, Landing Page Views
3. Conversion Rate
Conversion rate is the percentage of people who actually do something after clicking your ad. It’s the bridge between getting attention and getting results.
Formula: (Conversions ÷ Total Clicks) × 100
Triple Whale’s 2025 data puts the median e-commerce conversion rate at 1.57%. Hitting 2% or above means you’re outperforming most advertisers. Hitting 5%? Exceptional. But these numbers shift a lot depending on whether you’re targeting cold audiences or retargeting warm ones.
The single biggest lever is message match. Does your landing page deliver exactly what your ad promised? If your ad shows a specific product at a specific price and the landing page drops visitors on a generic category page, your conversion rate will suffer. It’s that straightforward.
Beyond message match, here’s what moves the needle:
- Retargeting: Re-engage people who visited but didn’t convert. They already know you—they just need a nudge.
- Social proof: Testimonials, reviews, and case studies reduce the mental friction of buying from someone new.
- Mobile experience: Mobile conversion rates are almost always lower than desktop. Before blaming your ad, check whether the landing page actually works well on a phone.
- Testing: A/B test layouts, headlines, and CTAs. Small changes compound into big lifts over time.
Your conversion rate tells a richer story when you pair it with other metrics:
| Pattern | What It Means | Where to Look |
|---|---|---|
| High CTR, low conversions | Ad grabs attention, page disappoints | Landing page relevance, speed, UX |
| Low CTR, high conversions | Targeting is narrow but accurate | Expand audience while maintaining quality |
| High conversions, low ROAS | Converting well but at too high a cost | Bidding strategy, AOV, product mix |
Related metrics: CTR, CPA, Landing Page Views
4. Incremental Conversions
Here’s a question that should make every agency pause: how many of your client’s conversions would have happened even without the ad?
That’s exactly what Incremental Attribution answers. It uses holdout testing—showing ads to one group and withholding them from another—to isolate only the conversions your ad actually caused. Not touched. Caused.
Standard attribution is generous. It counts conversions from people who might have bought anyway through organic search, direct visits, or brand loyalty. Incremental Attribution strips those out. Early adopters saw 20–24% more incremental conversions versus standard attribution, meaning the algorithm got better at finding people who genuinely needed the ad nudge.
Run this alongside your standard ROAS and CPA to give clients a more honest picture. It’s especially powerful for justifying prospecting spend, where standard attribution tends to undercount true impact. When comparing strategies, incremental data shows you which approach drives net-new business versus which one just captures demand that already existed.
It does need sufficient sample size and campaign duration to reach statistical significance. But for any client spending meaningful budget, this should be part of the conversation.
Related metrics: ROAS, CPA, Conversion Rate
5. Average Order Value (AOV)
AOV measures the average amount a customer spends per order. It’s the context that makes ROAS and CPA meaningful. Think about it—a $50 CPA sounds expensive until you learn the average order is $200.
Formula: Total Revenue ÷ Number of Orders
How do you move AOV up? A few tactics that work:
- Bundles and upsells: If customers who buy Product A frequently also buy Product B, create bundle offers or use dynamic ads to suggest the pair.
- Free shipping thresholds: Set them just above your current AOV. If average orders are $65, offer free shipping at $80.
- Audience segmentation: Your high-AOV and low-AOV customers respond to very different messaging. Treat them differently.
One thing to keep in mind: customers who start with a low AOV aren’t necessarily bad customers. Sometimes they become your most valuable buyers over time through repeat purchases. So before you write off a campaign with a low AOV, check whether those buyers are coming back.
Related metrics: ROAS, CPA, Conversion Rate
Campaign Efficiency Metrics
Now that you know whether the money side is working, these five metrics help you figure out why—and where to optimize.
6. CPC (Cost Per Click)
CPC is what you pay every time someone clicks your ad. Simple enough. But the number alone can be misleading without context.
Formula: Total Ad Spend ÷ Total Clicks
WordStream’s September 2025 data shows traffic campaign CPC averaging $0.70 (down 6.7% year over year) and leads campaigns at $1.92. The old benchmark of $0.50–$3.50 still holds, but it’s so wide it’s almost useless without specifying the campaign type.
A low CPC isn’t always a win. If you’re paying $0.30 per click but those clicks never convert, you’re just buying cheap traffic that goes nowhere. A $2.00 click that converts at 5% might be dramatically more profitable.
If CPC rises suddenly, it usually means one of three things: more competitors are bidding on your audience, your ad relevance is dropping, or seasonal trends are heating up auction prices. Check your Relevance Diagnostics before assuming the worst.
Related metrics: CTR, ROAS, CPM
7. CPM (Cost Per 1,000 Impressions)
CPM is how much you pay for every 1,000 times your ad is shown. It’s the delivery cost that sits underneath CPC and CPA—and it’s been climbing.
Formula: (Total Ad Spend ÷ Impressions) × 1,000
Triple Whale reports a 2025 median CPM of $14.19 across e-commerce, up roughly 20% year over year. Every industry vertical saw increases. That means even if your campaigns perform identically to last year, they cost more to deliver.
Why care about CPM specifically? Because it’s your early warning system. A CPM spike usually shows up in CPC and CPA a few days later. Catching it early gives you time to react—broaden your audience, test different placements, or refresh creative—before the downstream metrics start suffering.
Reels, Stories, and Audience Network often have different CPM floors than feed placements. If your CPM is high, test placement combinations before assuming you need to change the audience.
Related metrics: CPC, Reach, Frequency
8. CTR (Click-Through Rate)
CTR tells you what percentage of people who saw your ad actually clicked it. It’s your best quick read on whether your creative is working.
Formula: (Clicks ÷ Impressions) × 100
The current benchmark is 1.5–2.5%. If you’re still citing 1–2%, your targets are outdated. E-commerce median sits around 2.19%. Traffic campaigns average about 1.71%.
CTR matters more now than it used to. Meta’s AI systems evaluate your creative quality before finding users, so a strong CTR signals that your ad is worth showing to more people. That creates a positive loop—better creative leads to higher CTR, which leads to better delivery, which leads to lower CPM. It compounds.
One thing to keep in mind: click-through attribution now only counts link clicks. So your CTR might include engagement clicks like likes and comments, but only actual link clicks contribute to attributed conversions. Keep that distinction clear when analyzing the CTR-to-conversion relationship.
Related metrics: CPC, Conversion Rate, Hook Rate
2025 Facebook Ads Benchmark Reference
Current median benchmarks across e-commerce — use as starting points, not absolute targets
ROAS
3:1 – 5:1
E-commerce median range. Service businesses may sustain 2:1 with high LTV.
Source: Triple Whale 2025 (35,000 brands)
CPA (E-commerce)
$38.19
Median. Lifestyle ~$30, Electronics ~$50. Varies wildly by vertical.
Source: Triple Whale 2025 full-year data
Conversion Rate
1.57%
Median. 2%+ is outperforming. 5%+ is exceptional.
Source: Triple Whale 2025
CPC (Traffic)
$0.70 ↓ 6.7%
Traffic campaigns. Leads campaigns average $1.92.
Source: WordStream Sept 2025
CPM
$14.19 ↑ ~20%
E-commerce median. Every vertical saw YoY increases.
Source: Triple Whale 2025
CTR
1.5% – 2.5%
Current range. E-commerce median 2.19%. Traffic campaigns ~1.71%.
Source: Triple Whale / WordStream 2025
Add-to-Cart Rate
5% – 8%
E-commerce target. Higher signals strong product interest.
Source: Industry benchmarks
ThruPlay Rate
> 50%
Target for most videos. Push for 70%+ on sub-15s content.
Source: Industry benchmarks
These benchmarks reflect 2025 data. Since January 2026, reported numbers may appear lower due to the removal of view-through attribution windows — that’s a measurement change, not a performance decline. Always contextualize benchmarks for your client’s vertical and business model.
9. Landing Page Views
Landing page views count how many people clicked your ad and actually loaded the destination page. That’s different from link clicks—and the gap between them reveals a problem most advertisers don’t know they have.
Say you’re getting 1,000 link clicks but only 600 landing page views. That means 40% of your paid traffic never sees your page. They clicked, but the page didn’t load before they bounced. No amount of creative optimization fixes that.
Divide landing page views by link clicks. If the ratio is below 70%, you’ve got a page speed problem, a broken URL, or a redirect chain that needs immediate attention. Check mobile separately—it’s almost always worse there.
This metric requires your Pixel or Conversions API to be installed on the landing page. Without it, the data simply won’t appear. And speaking of tracking—if your clients are still running pixel-only setups, their overall attribution accuracy is around 40%. The Conversions API paired with the Pixel recovers 20–30% of lost data. Event Match Quality scores above 6.0 are the target for reliable measurement.
Related metrics: CPC, Conversion Rate, Add-to-Cart Rate
10. Frequency
Frequency is the average number of times each person has seen your ad. Too low and your message doesn’t stick. Too high and you annoy people.
Formula: Impressions ÷ Reach
Ad Frequency Sweet Spots by Campaign Type
Recommended weekly frequency ranges — too low and your message doesn’t stick, too high and you drive ad fatigue
1×/week
2×
3×
4×
5×
6×+
Brand Awareness
3–4× / week
Engagement
2–3× / week
Conversion
1–2× / week
Retargeting
3–5× / week
1
2
3
4
5
6+
Ad fatigue signal: When CTR declines while frequency increases, and CPC starts rising simultaneously — that’s your confirmation. Refresh creative or expand your audience before downstream metrics suffer.
The clearest sign of ad fatigue? Declining CTR while frequency goes up. If CPC also rises at the same time, you’ve confirmed it. The fix isn’t always new creative—sometimes expanding your audience is the smarter first move, especially if you’re targeting a small group that’s already seen the message a dozen times.
Related metrics: Reach, Impressions, CTR, CPM
Engagement and Visibility Metrics
These metrics guide your creative decisions and audience strategy. They’re not the headline numbers in a client report, but they explain why the headline numbers look the way they do.
11. Add-to-Cart Rate and Cost per Add-to-Cart
These mid-funnel metrics tell you whether people are interested enough in your client’s product to put it in their cart—even if they don’t buy yet. The gap between add-to-cart and purchase reveals exactly where friction lives.
Formulas: Add-to-Cart Rate = (Add-to-Cart Actions ÷ Landing Page Views) × 100. Cost per Add-to-Cart = Total Spend ÷ Add-to-Cart Actions.
Aim for a 5–8% add-to-cart rate in e-commerce. Higher than that means strong product interest.
When add-to-cart looks healthy but purchases are low, that’s almost always a checkout problem. Unexpected shipping costs, complicated forms, limited payment options—something between the cart and the confirmation page is killing the sale. Low add-to-cart with high CTR usually means a disconnect between what the ad promised and what the product page delivers.
Note that the unique add-to-cart metric was deprecated as part of Meta’s API changes. You’re now tracking total actions rather than unique user counts for this event.
Related metrics: Conversion Rate, Landing Page Views, AOV
12. Post Engagement
Post engagement covers all the actions people take on your ad—reactions, comments, shares, saves, clicks, video views. Even for direct-response campaigns, this isn’t just a vanity metric.
Ads with strong engagement get better delivery at lower CPMs because Meta’s algorithm reads engagement as a quality signal. And post comments give you something no other metric does: qualitative feedback. What are people saying? Excited about the product? Confused by the offer? Complaining about shipping? That’s gold for optimizing both the ads and your client’s business.
As Akvile DeFazio points out, even upper-funnel engagement campaigns can drive unexpected conversions. Track performance metrics across all campaign types—not just the ones labeled “conversion.”
Be aware that engagement clicks no longer trigger click-through attribution. Someone who likes your ad and later buys won’t appear in click-through numbers. They might show up under engage-through attribution if they interacted within a 5-second window.
Related metrics: CTR, Frequency, Ad Relevance Diagnostics
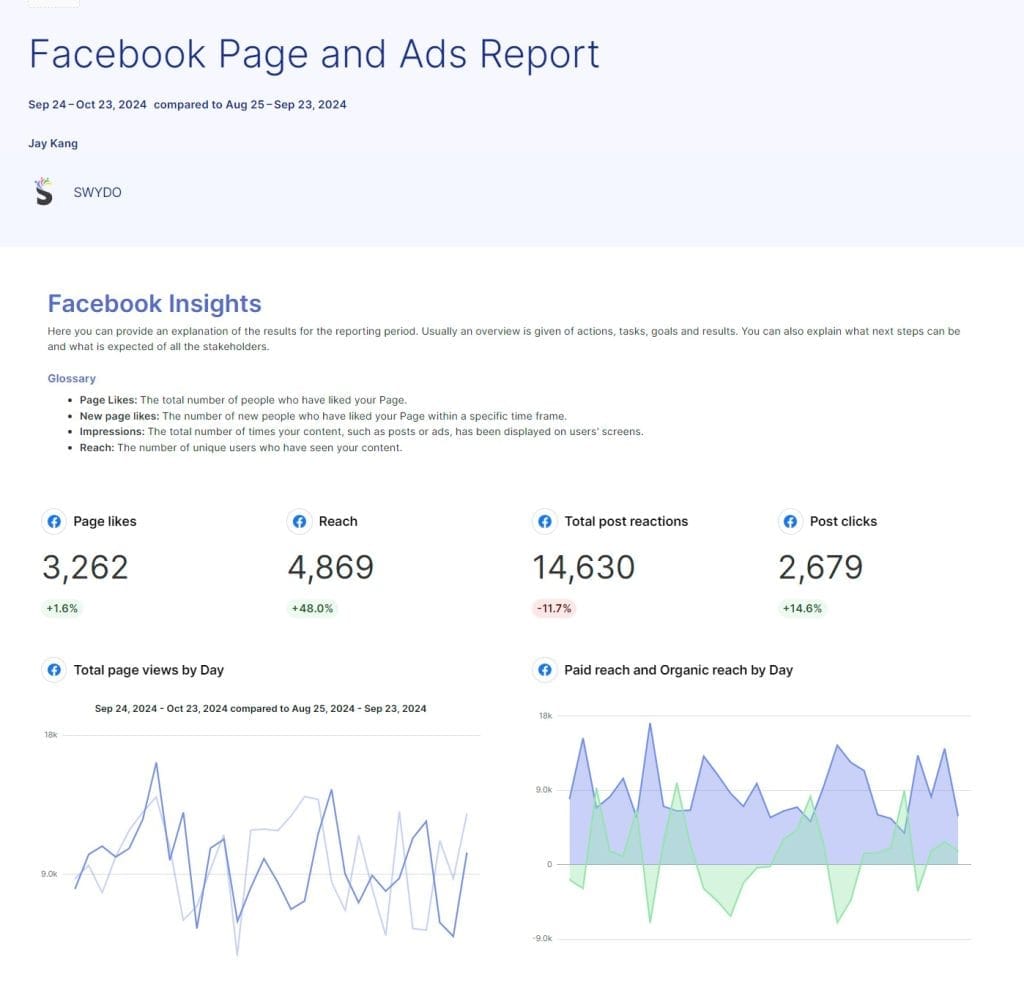
13. Impressions and Reach
Impressions count total ad displays. Reach counts unique people who saw it. The relationship between them gives you frequency, and together they show how far your message is traveling.
For awareness campaigns, prioritize reach—get in front of as many relevant people as possible. For retargeting, care more about impressions—you need repeated exposure to a smaller audience to drive action.
Watch for this: high impressions with barely any reach growth means you’re showing the same ad to the same small group over and over. That’s saturation, and it usually precedes ad fatigue. High reach with impressions close to the same number means wide distribution with almost no repeat exposure—which might mean your message isn’t getting enough frequency to stick.
A note on terminology—Meta renamed Impressions to “Views” and Reach to “Viewers” for organic content in Business Suite. Ads Manager still uses the old terms for paid campaigns. If you’re combining organic and paid data in reports, clarify this distinction for your clients.
Related metrics: Frequency, CTR, CPM
14. Video Completion Rate and Hook Rate
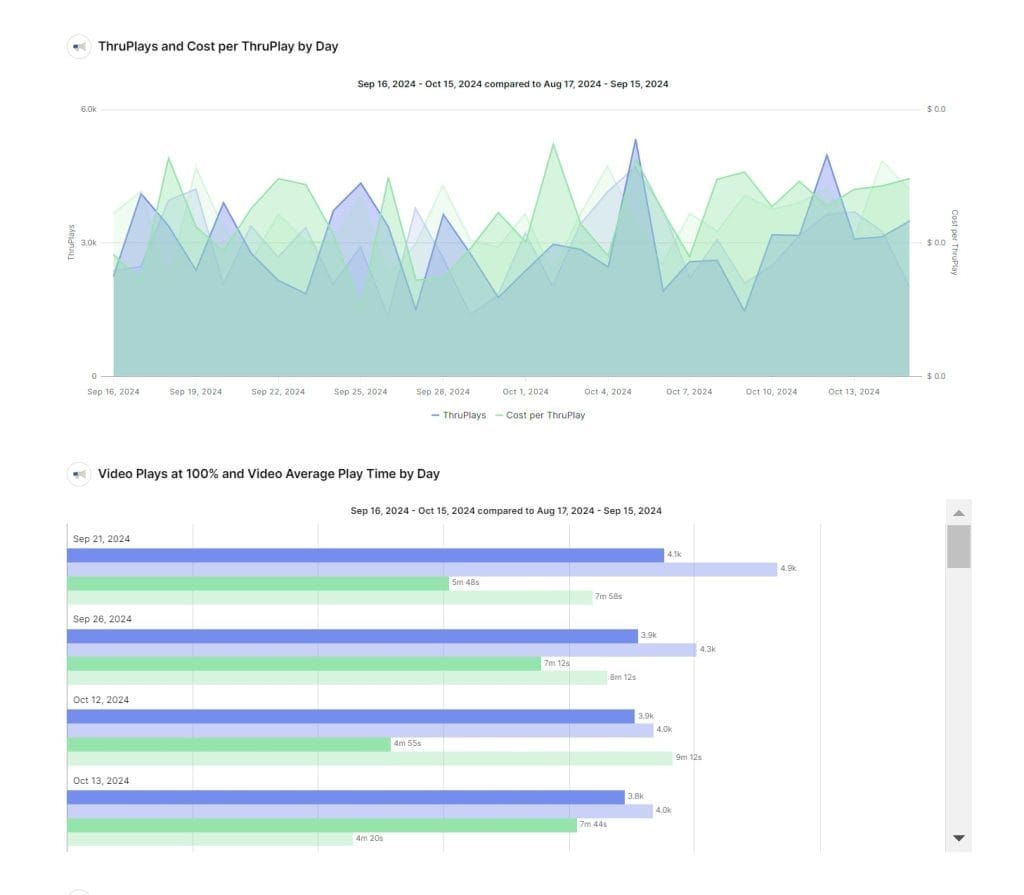
Two metrics, two different questions. Hook rate (video plays divided by impressions) asks: did people stop scrolling? Completion rate asks: did they keep watching?
The key video metrics to track:
- ThruPlays: Videos played to completion or at least 15 seconds, whichever comes first. This is your primary video engagement metric.
- Video plays at 25%, 50%, 75%, 95%, 100%: These show exactly where viewers drop off so you can pinpoint weak spots.
- Hook Rate: Video plays divided by impressions. Low hook rate means your opening isn’t stopping the scroll.
Aim for ThruPlay completion rates above 50%. On shorter videos under 15 seconds, push for 70%+. The 10-second video view metric was recently deprecated, so update your reporting templates if you were still using it.
A common pattern: high ThruPlays but low clicks. People watch the whole video but don’t take action. That usually means your CTA is weak, missing, or buried at the end. Front-load it.
As Akvile DeFazio explains, ThruPlays and Video Plays measure very different things. ThruPlays confirm meaningful engagement. Video Plays just count any time a video starts, including people who scroll past after half a second. For most objectives, ThruPlays is the one you actually want.
Related metrics: CTR, Engagement Rate, CPM
15. Ad Relevance Diagnostics
Three rankings—Quality, Engagement Rate, and Conversion Rate—that compare your ad against others competing for the same audience. Think of them as Meta’s report card on your creative and targeting.
Each is rated Above Average, Average, or Below Average. What makes them useful is that they pinpoint the specific problem:
- Below Average Quality + Average Engagement: Your ad grabs attention, but the post-click experience disappoints. Fix the landing page.
- Below Average Engagement + Good Conversion: Targeting works, but the creative needs help. People who do engage are converting—you just need more of them to engage.
- Below Average Conversion + Good Engagement: People like and click the ad, but something breaks between click and conversion. Check your checkout flow.
These diagnostics directly influence CPM. Higher-ranked ads get better auction prices. So improving relevance doesn’t just look good in reports—it literally makes your advertising cheaper.
They’re only available after roughly 500 impressions, and they’re comparative. A score that’s “Average” today might slip to “Below Average” next month if competitors step up their creative.
Related metrics: CTR, CPM, CPC, Conversion Rate
Which Metrics to Prioritize by Campaign Objective
Not every metric matters equally for every campaign. Here’s a quick reference for which numbers to lead with based on what you’re trying to achieve:
Which Metrics to Prioritize by Campaign Objective
Select an objective to see which metrics should lead your reporting.
Primary Metrics — Lead With These
Supporting Metrics — For Diagnostics
For sales campaigns, ROAS and CPA are non-negotiable report headers. Use Incremental Conversions to prove your ads caused the sale, not just touched it.
Primary Metrics — Lead With These
Supporting Metrics — For Diagnostics
Don’t optimize for the cheapest leads. Landing page forms often produce higher-quality leads than native forms — even at a higher cost per lead.
Primary Metrics — Lead With These
Supporting Metrics — For Diagnostics
Even awareness campaigns can drive conversions. Track conversion metrics alongside top-of-funnel numbers — don’t miss unexpected downstream results.
Primary Metrics — Lead With These
Supporting Metrics — For Diagnostics
Engagement campaigns boost algorithm signals. Ads with strong engagement earn better delivery at lower CPMs across all campaign types.
Primary Metrics — Lead With These
Supporting Metrics — For Diagnostics
An install that never opens is a wasted conversion. Track post-install behavior to differentiate real users from accidental downloads.
Primary Metrics — Lead With These
Supporting Metrics — For Diagnostics
ThruPlays count meaningful engagement (15+ seconds). Raw Video Plays include people who scroll past after half a second — always report ThruPlays, not Plays.
Even for upper-funnel campaigns, keep an eye on conversion metrics. Conversions can and do come through from awareness and engagement campaigns. Don’t miss them by only tracking top-of-funnel numbers.
Putting It All Together
Individual metrics can mislead you. The real insights come from how they interact. Here are the patterns to watch for:
Cross-Metric Diagnostic Patterns
When one metric tells a partial story, pair it with another to find the real problem
CPC Rising
CTR Stable
Competitive pressure increasing
More competitors bidding on your audience. You’re paying more for the same quality traffic. Test new audience segments or adjust bid strategy.
CTR Improving
Conversions Flat
Landing page disconnect
Your ad wins the click, but the page doesn’t close the deal. Optimize landing page speed, messaging, and mobile UX.
Add-to-Cart High
Purchases Low
Checkout friction
People want the product but something between cart and confirmation kills the sale. Check shipping costs, payment options, and form complexity.
Frequency Rising
CTR Declining
Ad fatigue confirmed
Your audience has seen this ad too many times. Refresh creative first. If that doesn’t help, expand your audience — you may be targeting too narrow a group.
Reach High
Conversions Low
Targeting too broad
You’re reaching lots of people, but the wrong ones. Narrow your audience or improve the relevance of your messaging to the people you’re reaching.
ThruPlays High
Clicks Low
Engaging content, weak CTA
People watch the entire video but don’t take action. Front-load or strengthen your call-to-action — it may be buried or too subtle.
When you’re building client reports, don’t just list numbers. Tell the story those numbers reveal. What’s happening, why it’s happening, and what you recommend doing about it. That’s the difference between being an ad manager and being a strategic partner.
Account for external factors too. Seasonal trends, competitor activity, and platform updates all affect performance. The agencies who proactively explain these impacts to clients look smart. The ones who wait for the panicked phone call do not.
Metrics That Can Mislead You
Not every number in Ads Manager deserves space in your client report.
Likes and reactions feel good but don’t predict purchases. Video Views as a raw count inflate perceived reach without any real engagement signal. “Clicks (All)” lumps together accidental taps, image expansions, and “See More” clicks alongside actual link clicks—it makes your traffic look healthier than it is. Impressions without reach context can’t tell you whether you’re in front of new people or just wearing out the same small group.
The fix isn’t to ignore these entirely. It’s to pair them with outcome metrics. Likes matter when they correlate with increased brand search volume. Video views mean something when ThruPlay rates are strong and viewers convert. Build your reports around the numbers that connect to your client’s goals. Use everything else as context.
Facebook Ads Metrics FAQ
Clear answers to the most common questions about measuring and optimizing Meta ad performance
For most e-commerce campaigns, a 4:1 ROAS (earning $4 for every $1 spent) is the standard target. The median across e-commerce brands falls between 3:1 and 5:1 depending on vertical and seasonality. Service businesses often sustain profitability at 2:1 or even lower when customer lifetime value is high.
Context matters more than the number itself. A 2:1 ROAS can be incredibly profitable for a subscription business where customers stay for 18 months, while a low-margin retailer might need 5:1 just to cover operating costs. Always evaluate ROAS alongside total spend—a 10:1 ROAS on $100 of spend looks impressive on paper but has minimal business impact.
ROAS = Revenue ÷ Ad Spend. If you spend $1,000 on a campaign and it generates $5,000 in revenue, your ROAS is 5:1. Meta Ads Manager calculates this automatically using the purchase events tracked by your Pixel and Conversions API.
Set ROAS goals with your client before the campaign launches, not after. Use it to guide budget allocation by shifting spend toward top-performing ad sets. And expect ROAS to look rough during the first two weeks while Meta’s algorithm is in its learning phase—if it hasn’t improved by week four, it’s time to revisit targeting, creative, or the offer itself.
CPA (Cost Per Action) is the average cost of getting someone to complete a desired action—a purchase, form submission, or app install. The formula is Total Ad Spend ÷ Number of Conversions.
Current median benchmarks: e-commerce CPA sits around $38 (ranging from ~$30 for lifestyle brands to ~$50 for electronics). Lead generation campaigns average roughly $16 across industries. These vary widely by vertical, so always benchmark against your specific industry rather than a universal number.
Important: a low CPA isn’t always better. Campaigns that drive higher-cost leads often produce better-quality customers who convert downstream. Landing page forms typically yield higher-quality leads than native Facebook forms—fewer leads at a higher cost, but the ones who bothered to leave Facebook and learn more are far more likely to buy.
Incremental Conversions measure how many conversions your ad actually caused—not just touched along the way. Meta’s Incremental Attribution uses holdout testing (showing ads to one group, withholding from another) to isolate only the sales that wouldn’t have happened without the ad.
This matters because standard attribution is generous—it counts conversions from people who may have purchased anyway through organic search or brand loyalty. Incremental Attribution strips those out. Early adopters saw 20–24% more incremental conversions identified, meaning Meta’s algorithm got better at finding people who genuinely needed the nudge.
It’s especially powerful for justifying prospecting spend, where standard attribution tends to undercount true impact. Run it alongside your standard ROAS and CPA to give clients a more honest performance picture.
Average Order Value (Total Revenue ÷ Number of Orders) is the context that makes ROAS and CPA meaningful. A $50 CPA sounds expensive until you learn the average order is $200.
Three tactics to increase AOV: create bundles and upsells based on products customers frequently buy together; set free shipping thresholds just above current AOV (if average orders are $65, offer free shipping at $80); and segment audiences by spending behavior since high-AOV and low-AOV customers respond to different messaging.
Don’t dismiss campaigns with lower AOV too quickly—those customers may become your most valuable buyers over time through repeat purchases.
The median e-commerce conversion rate from Facebook Ads is roughly 1.5–2%. Hitting 2% or above means you’re outperforming most advertisers. Hitting 5% is exceptional. However, these numbers shift depending on whether you’re targeting cold audiences (lower) or retargeting warm ones (higher).
The single biggest lever for improving conversion rate is message match—your landing page must deliver exactly what the ad promised. If the ad shows a specific product at a specific price and the landing page drops visitors on a generic category page, conversion rate suffers immediately.
Traffic campaigns currently average around $0.70 CPC, while lead generation campaigns sit closer to $1.92. The broad benchmark range of $0.50–$3.50 holds, but it’s only useful when you specify the campaign type and industry.
A low CPC isn’t automatically a win. Paying $0.30 per click for traffic that never converts is just cheap waste. A $2.00 click that converts at 5% can be dramatically more profitable. Always evaluate CPC in the context of what happens after the click—pair it with conversion rate and ROAS.
CPM (Cost Per 1,000 Impressions) has been trending upward across all verticals, with e-commerce medians around $14 and rising roughly 20% year over year. The most common causes of high CPM are increased competitor bidding on your audience, narrow targeting that limits available inventory, seasonal demand spikes (especially Q4), and creative fatigue signaling low quality to Meta’s algorithm.
Before changing your audience, test placement combinations—Reels, Stories, and Audience Network often have different CPM floors than feed placements. CPM is also your early warning system: a spike typically shows up in CPC and CPA a few days later. Catching it early gives you time to broaden your audience or refresh creative before downstream metrics suffer.
Rising CPC with stable CTR almost always means more competitors are bidding on your audience. Your ad quality hasn’t changed—you’re just paying more for the same quality of traffic because the auction is more competitive.
To address this, test new audiences to find less competitive segments, experiment with different placements (Reels and Stories often have lower CPCs), and check whether seasonal trends are driving up auction prices. If the higher CPC is still delivering profitable ROAS, it may not actually need fixing.
The current benchmark is 1.5–2.5%. E-commerce median CTR sits around 2.2%. If you’re still targeting the older 1–2% range, your benchmarks are outdated.
CTR matters more now than it used to. Meta’s AI evaluates creative quality before finding users, so a strong CTR signals your ad is worth showing to more people—better creative leads to higher CTR, which improves delivery, which lowers CPM. It compounds.
One important distinction: click-through attribution only counts link clicks. Your CTR metric may include engagement clicks like likes and comments, but only actual link clicks contribute to attributed conversions.
Link clicks count when someone clicks your ad. Landing page views count when someone clicks and the destination page actually loads. The gap between them reveals how much paid traffic you’re losing before they ever see your page.
Divide landing page views by link clicks. If the ratio is below 70%, you have a page speed problem, broken URL, or redirect chain that needs immediate attention. Always check mobile separately—it’s almost always worse. This metric requires your Pixel or Conversions API to be installed on the landing page.
Advantage+ campaigns are now Meta’s default, which shifts your optimization levers significantly. The algorithm handles targeting decisions (the “who”), so CPA optimization depends increasingly on creative quality and landing page experience rather than audience selection. You handle the “what” and “where they land.”
This means creative testing and landing page optimization are now your primary competitive advantages. Focus on producing diverse ad creative to give the algorithm more options, and ensure your landing pages deliver on what the ad promises. Agencies that rely on manual audience tweaks will find diminishing returns as Advantage+ takes over more targeting decisions.
The clearest signal is declining CTR while frequency (Impressions ÷ Reach) goes up. If CPC also rises at the same time, it’s confirmed—your audience has seen this ad too many times.
| Campaign Type | Ideal Frequency |
|---|---|
| Brand Awareness | 3–4x per week |
| Engagement | 2–3x per week |
| Conversion | 1–2x per week |
| Retargeting | 3–5x per week |
The fix isn’t always new creative—sometimes expanding your audience is the smarter first move, especially when targeting a small group that has already seen the message a dozen times. Also watch for high impressions with barely any reach growth, which means you’re saturating a small pool.
Aim for 5–8% for e-commerce (Add-to-Cart Actions ÷ Landing Page Views × 100). Anything above that signals strong product interest.
If add-to-cart looks healthy but purchases are low, the problem is almost always in checkout—unexpected shipping costs, complicated forms, or limited payment options. If add-to-cart is low but CTR is strong, there’s a disconnect between what the ad promised and what the product page delivers. Note that the unique add-to-cart metric was deprecated, so you’re now tracking total actions rather than unique users.
A ThruPlay counts when someone watches your video to completion or for at least 15 seconds, whichever comes first. It’s your primary video engagement metric because it confirms meaningful viewing—unlike Video Plays, which count any time a video starts, including people who scroll past after half a second.
Aim for ThruPlay completion rates above 50%. For shorter videos under 15 seconds, push for 70%+. If you see high ThruPlays but low clicks, your call-to-action is likely weak, missing, or buried at the end—front-load it. The 10-second video view metric was deprecated, so update any reporting templates still using it.
Hook rate is video plays divided by impressions. It answers one question: did people stop scrolling? A low hook rate means your opening frames aren’t compelling enough to capture attention in the feed.
To improve it, lead with movement, bold visuals, or a provocative statement in the first 1–3 seconds. Avoid logo intros or slow builds. Pair hook rate with the percentage-based dropoff metrics (25%, 50%, 75%, 100%) to see exactly where viewers lose interest so you can pinpoint weak spots in the content.
Yes. Ads with strong engagement get better delivery at lower CPMs because Meta’s algorithm reads engagement as a quality signal. More reactions, comments, and shares tell the algorithm your ad is worth showing to more people—which creates a compounding benefit of lower costs and wider reach.
Post comments also give you qualitative feedback no metric provides: what people actually think about the product, offer, or shipping experience. Even upper-funnel engagement campaigns can drive unexpected conversions, so track performance metrics across all campaign types.
Three rankings—Quality, Engagement Rate, and Conversion Rate—that compare your ad against competitors targeting the same audience. Each is rated Above Average, Average, or Below Average. They directly influence your CPM: higher-ranked ads get better auction prices, so improving relevance literally makes advertising cheaper.
| Pattern | Diagnosis | Fix |
|---|---|---|
| Low Quality + OK Engagement | Post-click experience disappoints | Improve landing page |
| Low Engagement + Good Conversion | Creative isn’t grabbing attention | Refresh ad creative |
| Low Conversion + Good Engagement | Something breaks after the click | Fix checkout or offer |
These diagnostics are only available after ~500 impressions and are comparative—scores can shift as competitors change their creative.
For smaller accounts spending a few thousand dollars per month, refresh creative monthly. For larger budgets, refresh weekly. The key signal is rising CPM combined with declining CTR—that’s creative fatigue in action.
Meta now provides Creative Fatigue and Creative Similarity scores in Ads Manager. High Creative Similarity (meaning your ads lack diversity) can actually raise your CPMs because the algorithm views repetitive content as fatiguing. Aim for a variety of angles, formats (static images, carousels, video, text-only), and messaging themes to give the algorithm more options to test.
The Pixel alone is no longer enough. Ad blockers, cookie restrictions, and iOS privacy updates have degraded its effectiveness significantly—pixel-only setups have an overall attribution accuracy of around 40%. Pairing the Conversions API (CAPI) with the Pixel recovers 20–30% of lost data by sending conversion events directly from your server, bypassing browser limitations entirely.
The Conversions API sends the same event types as the Pixel but through a server-side connection, so it captures conversions even when a browser blocks tracking. After implementing both, monitor your Event Match Quality score in Events Manager—aim for above 6.0 for reliable measurement, and above 8.0 for maximum matching accuracy.
Event Match Quality (EMQ) is a score from 0 to 10 that Meta assigns to your server events. It indicates how effectively the customer information you send can be matched to a Meta account. A higher score means more accurate attribution, better lookalike audiences, and improved ad delivery optimization.
Aim for above 6.0 as a minimum. Above 7.0 is excellent. Above 8.0 means you’re sending comprehensive customer data (email, phone, name, IP, user agent) and maximizing matching accuracy. Improve your score by adding more customer information parameters to both your Pixel and Conversions API event payloads.
Lead with the metrics that match the campaign objective:
| Objective | Lead With | Support With |
|---|---|---|
| Sales | ROAS, CPA, Conversion Rate, AOV | CTR, Add-to-Cart, Landing Page Views |
| Lead Gen | Cost per Lead, Lead Quality | Landing Page Views, Form Completion Rate |
| Awareness | Reach, Frequency, Video Completion | CPM, ThruPlay Rate, Engagement |
| Engagement | Engagement Rate, Cost per Engagement | Reach, Shares, Link Clicks |
Don’t just list numbers—tell the story they reveal. What’s happening, why it’s happening, and what you recommend. That’s the difference between being an ad manager and a strategic partner. Account for external factors like seasonal trends and platform changes proactively.
Likes and reactions feel good but don’t predict purchases. Video Views (raw count) inflate perceived reach without showing real engagement. “Clicks (All)” lumps accidental taps, image expansions, and “See More” clicks alongside actual link clicks—making traffic look healthier than it is. Impressions without reach context can’t tell you whether you’re reaching new people or hitting the same small group repeatedly.
The fix isn’t ignoring these metrics—it’s always pairing them with outcome metrics. Likes matter when they correlate with increased brand search volume. Video views mean something when ThruPlay rates are strong. Build reports around the numbers tied to your client’s goals and use everything else as supporting context.
Several major changes impact reporting accuracy. Meta permanently removed the 7-day and 28-day view-through attribution windows, which means your ROAS may appear lower simply because fewer conversions are being attributed—that’s a measurement change, not a performance problem. Over 100 metrics were deprecated from the API, including unique add-to-cart counts and the 10-second video view metric.
Engagement clicks no longer trigger click-through attribution—only link clicks count. Someone who likes your ad and later buys may appear under engage-through attribution (if they interacted within a 5-second window) but won’t show in click-through numbers. Meta also renamed Impressions to “Views” and Reach to “Viewers” for organic content in Business Suite, though Ads Manager still uses the old terms for paid campaigns.
Work through these diagnostic patterns to isolate the cause:
| What You See | Most Likely Cause | What to Do |
|---|---|---|
| CPA up + CTR down + Frequency up | Ad fatigue | Refresh creative or expand audience |
| CPA up + CPM up + CTR stable | Increased auction competition | Test new audiences or placements |
| CPA up + CTR up + Conversion rate down | Landing page problem | Check page speed, message match, mobile UX |
| CPA up + Add-to-cart stable + Purchases down | Checkout friction | Review shipping costs, forms, payment options |
| CPA up + All metrics stable | Attribution or tracking issue | Verify Pixel and CAPI setup, check EMQ score |
Always check whether external factors (seasonality, competitor launches, platform updates) coincide with the change before making campaign adjustments.
The learning phase is the period when Meta’s algorithm is figuring out the best way to deliver your ad. During this time (typically the first 1–2 weeks), performance metrics like CPA and ROAS will fluctuate and usually look worse than they will once the algorithm stabilizes.
Resist the urge to make big changes during week one. By week two, CPA should start dropping. By weeks three through eight, it should settle into an efficient range you can optimize around. If performance hasn’t improved by week four, something fundamental needs to change—targeting, creative, or the offer itself. Major edits to an ad set (budget, audience, creative) reset the learning phase, so make changes deliberately rather than reactively.
Track all 15 of these metrics in one place with Swydo’s automated reporting.
Start Your Free Trial Today