In this article, GA4 experts unravel the difference between the reporting in Universal Analytics vs. the new Google Analytics 4 for digital marketers
In this article, we are going to discuss:
- What has changed?
- How Google Analytics 4 improves reporting?
- Best ways to use Google Analytics 4 reports
- Google Analytics 4 reporting identity and how to configure it
- Migration and next steps
Ever find yourself sitting at your desk thinking, “I still have to migrate to GA4 – it’s a nightmare!”?, No? Okay, that might just be some of our friends. But yes, GA4 is here and it officially takes over from Universal Analytics on July 1, 2023, and from Universal 360, on Oct 1, 2023.
Google Analytics has changed a lot since its birth in 2005, the new GA4 promises to be better, faster, and, fairer. But this migration comes with its own challenges, and we are here to help you. Getting started with GA4 migration now will help you get accustomed to the new interface, access the unique features of the platform, and get familiar with how you can use reports in GA4 to improve the effectiveness of analysis and deliver better insights to your clients/stakeholders.
GA4: What has changed?
The most significant change in GA4 is how it collects and structures data in comparison with Universal Analytics (UA). The GA4 measurement model is more flexible and robust with better visualizations and report snapshots.
UA uses the measurement model which is based on sessions and pageviews. In GA4, every user interaction type is an event – page views, conversions, clicks, etc.
Why is that important? GA4 is designed to create custom reports that are more user journey-focused. This way you can track active users engaging on the website rather than total users.
The new GA4 metrics to keep track of
UA metrics that are no longer available in GA4 include bounce rate, pages per session, or average session duration.
Essential dimensions and metrics you now have are engaged session durations, engagement rates, and engaged sessions per user.
Engagement rate and bounce rate are supplementary metrics and those who are keen to use bounce rate can calculate it by the below formula:
Bounce rate = 100% – Engagement rate
**the numbers will differ a bit from what you see in UA because the engagement metric not only counts sessions with 2 or more pageviews but also counts sessions that have spent more than 10 seconds or have triggered a conversion event.
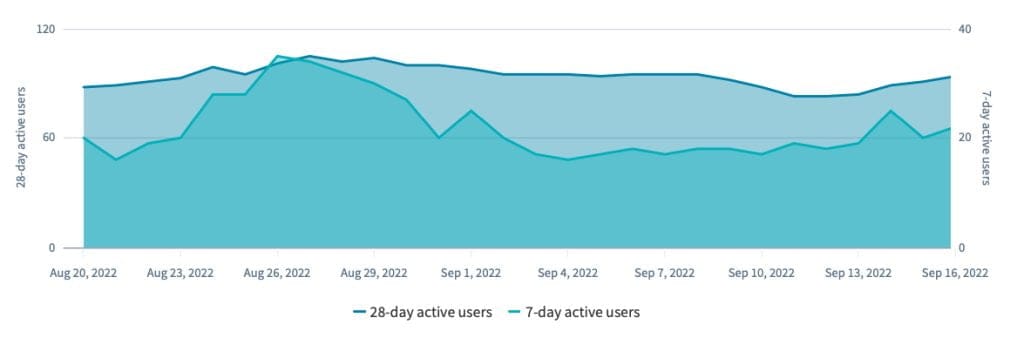
Another big change among metrics is the introduction of active users. An active user is someone who has an engaged session or has triggered the below events:
- first_visit event or engagement_time_msec parameter (website)
- first_open event or engagement_time_msec parameter (Android app)
- first_open or user_engagement event (iOS app)
In all Universal Analytics reports ‘total users’ were shown as users while GA4 shows ‘active users’ as users in all reports.
What are GA4 events?
In the case of GA4, everything is an event, and there are four categories of events you need to know:
- Automatically collected events – Are collected by default if you have GA4 installed on your website or app, such as page_view.
- Enhanced measurement events – Are collected when enhanced measurement is enabled for a web data stream. No code-level changes are needed for this.
- Recommended events – Have predefined names and parameters and are only collected when you implement, such as a purchase or generate_lead event. Recommended events are shown in your standard reports making them even more insightful.
- Custom events – Are events that need to be defined and don’t show up in most standard reports. To perform meaningful analysis, you’ll need to set up custom reports or explorations.
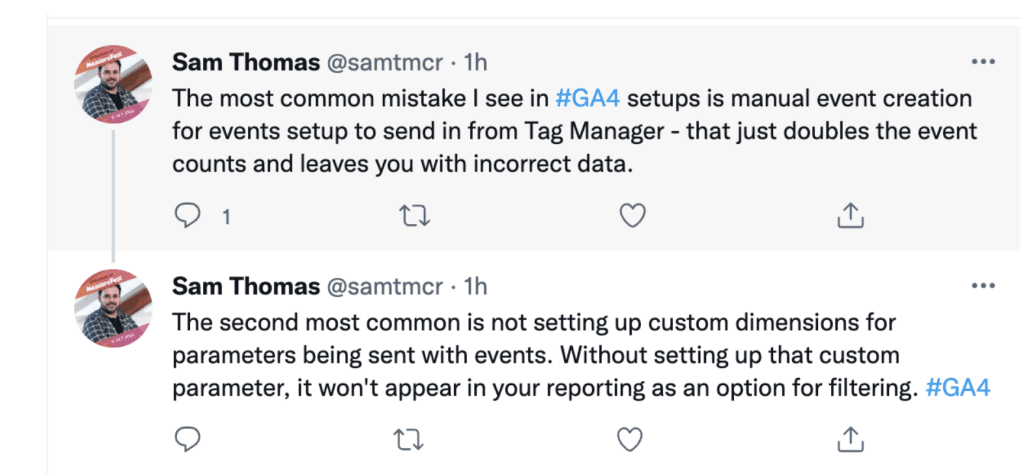
Things to keep in mind while setting up your GA4 events
**Highlighting the importance of events, it is recommended that you track event data in Google Tag Manager by setting up tags and triggers via GTM. For example, if you want to track things like page timers, clicks on a page, link clicks, external link clicks, or video views, there’s a corresponding tag and trigger in Google Tag Manager that can be used to push the data to GA4.
How GA4 improves reporting
It is crucial to understand that the change in the GA4 data model is focused on increasing the effectiveness of data analytics and minimizing irrelevant information. Here are some essentials in Google Analytics 4.
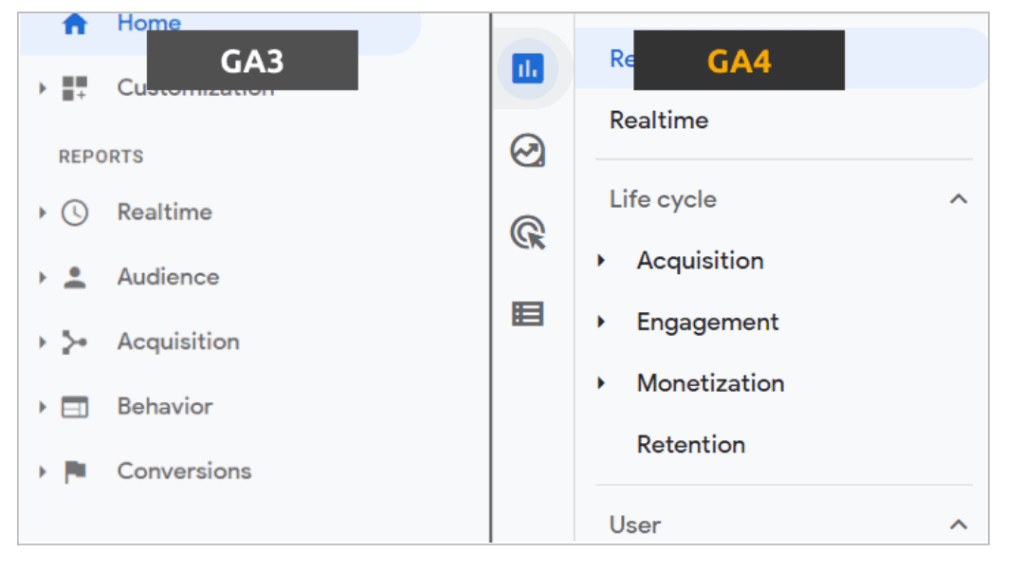
The difference in reporting UA vs. GA4
- A better idea of the user journey – The UA sections like ‘audience’, ‘behavior’, and ‘conversion’ are replaced by ‘engagement’, ‘monetization’, and ‘retention’. This enables marketers to break down the user activity through each stage in the customer user journey funnel from acquisition to retention.
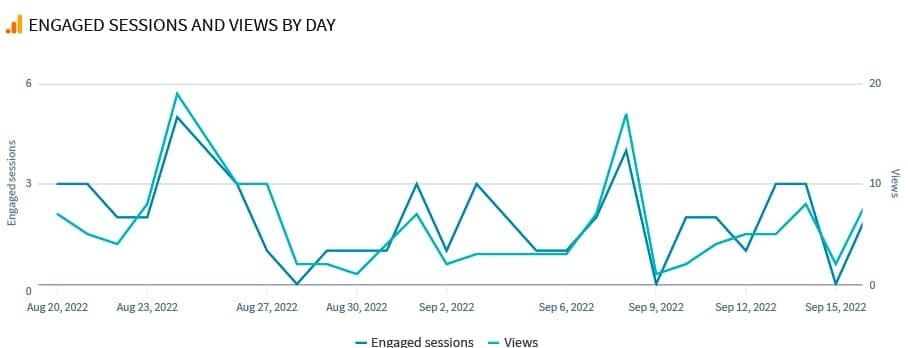
- An eagle eye view on engagement – In GA4 you can view Engaged Sessions and Engagement Rate compared to UA which uses ‘bounce rate’ as one of the metrics to measure site engagement. Arguably engagement rate is more useful than bounce rate as it also accounts for time spent on the page and conversions.
- Tracking specifics – The reports in GA4 can be generated when you track events using a measurement ID tag. GA4 allows you to track the specific things you care about. For example, you can track when a user clicks a specific button on a specific webpage, making segment comparisons easy.
- Determine what conversion means to you – In GA4, there is no need to set up goals based on a restricted set of conversion criteria. For example – let’s say you are tracking an event finished_reading on your blog article pages that gets fired when a user scrolls through 90% of the article page. To make this more accurate you can add a condition of time spent = 4 minutes.
- Wider view in one glance – GA4’s enhanced AI allows for better data visualization capabilities. The real-time data visualization is enhanced to avail a wider view of all the real-time data in just one glance.
- Cross-device reporting – GA4 provides significantly better and more accurate cross-device tracking than UA. This helps you get a better picture of your marketing campaigns across devices and fixes cross-device attribution issues.
Important to note: Because of the changes in the new GA analytics, the user count and the session count can drop from UA to GA4. Why? Because you’re looking at users interacting with your site rather than viewers with zero interactions, so don’t get alarmed if the data on GA4 doesn’t match UA.
Best ways to use GA4 reports
On a broader level, we have two types of reports – Standard reports and Custom reports (aka the Explorations section)
- Standard reports in GA4 are prebuilt reports. They provide data in visually appealing summary cards that can be used to quickly identify user trends and anomalies.
- The Explorations section gives you advanced techniques to go beyond the standard reports. You can answer complex questions, explore your data in depth and create audiences that can be used in Google Ads.
Let’s go through various reports available in GA4 one by one.
Life Cycle
The Life Cycle collection in GA4 comprises four reports and are categorized as follows:
It showcases the story of the journey that users take with your website by mirroring the funnel of acquiring, engaging, monetizing and retaining users.
Compared to Universal Analytics, GA4 lifecycle reports are more focused on the customer user journey as it helps marketers get a better picture of how customers coming from different sources/mediums move through the funnel.
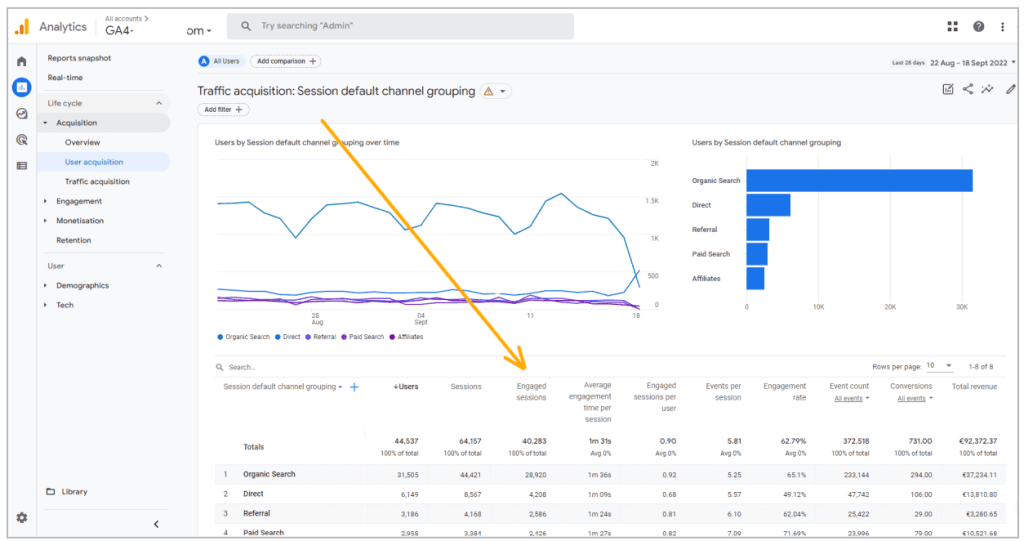
Acquisition
In UA, there is a huge collection of 30 standard reports that can be created within the Acquisition reports. In GA4, there are only three standard reports.
The Acquisition reports highlight where new and returning users come from. It’s one of the most valuable datasets GA4 offers. It can even be customized for comparing the data you care about the most within a few clicks.
Engagement
In past versions of GA, there was no direct way to measure engagement. One was forced to use metrics like bounce rate to create calculations for engagement. With the Engagement report, you can measure how users engage with the website based on the conversion events the user triggers when they visit web pages and app screens.
Monetization
Monetization in GA4 shows data for websites to track revenue-based events like in-app purchases and eCommerce. Note that you will not see any data in the report until the specific events are set up.
The Monetization report in GA4 provides an easy way to view in-depth details about the money generated and the revenue sources, identify user trends and determine the efficiency of your campaigns. Additionally, the Monetization report offers many customizable elements that enable you to monitor any revenue you wish.
Retention
Retention reports in GA4 show the overall percentage of visitors who return each day in the first 42 days after visiting your website. This set of reports will help you understand how frequently and for how long users engage with your website or mobile app after their first visit. For example, you can check user retention by cohort to see new vs. returning users. This section of GA4 reports is an excellent place to go if you’re looking to explore how you have retained users from a specific campaign or promotion.
User Reports
GA4 includes a User collection comprising two reports, the Demographics report and the Tech report.
The data within the collection helps you gain insights into the type of users visiting the website.
Demographics
It’s one thing to know what visitors are doing on the website, but to fully understand your target users, you must know who those visitors are.
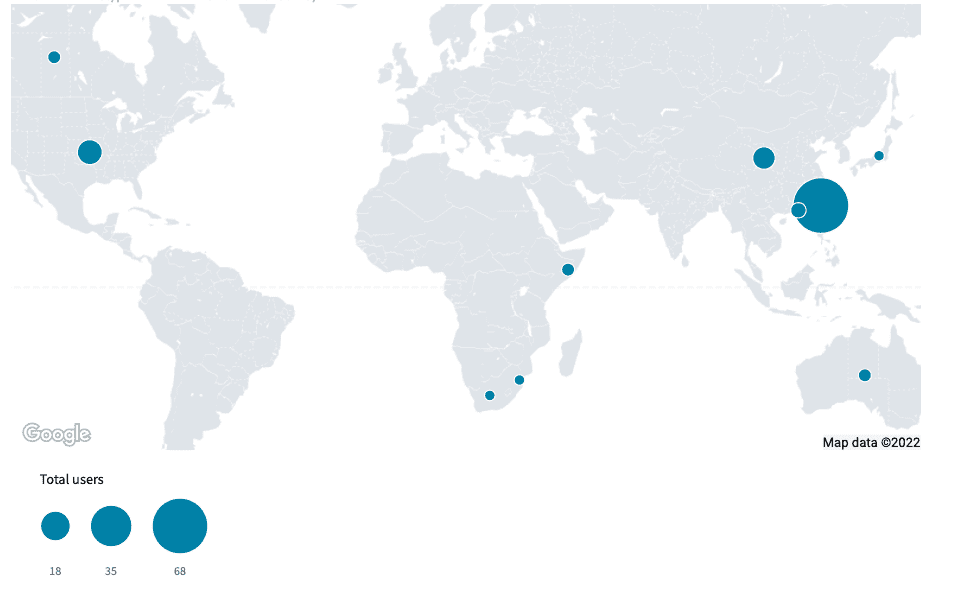
The Demographics report in GA4 highlights information about users who visit your client’s websites, their average age, country, language, city, interests and gender.
This information can help you hone in on your target audience and better tailor your marketing efforts toward them.
Tech
The Tech report displays information about users’ smart devices. Device categories are split between desktops, mobile devices and tablets. The Tech reports also show users’ methods of accessing the website content. For example, visitors could view the website from an iOS app, web browser or Android app.
You can utilize the data collected in reports to understand how users view the website’s content and then improve that content or plan future execution to fit user preferences better.
The game changer for analysis – Explorer Reports
Universal Analytics, this feature was only available to paid GA 360 users, but in GA4 Explore Reports are available to everyone.
The Exploration section goes beyond standard reporting to build your own custom reports and uncover much deeper insights that were not possible with Universal Analytics.
To give you an example – using Funnel exploration, you can map the complete journey that your visitors take on your website and easily identify where the majority of them are dropping off and signing up, evidently informing you what is working and what you need to improve next.
GA4 currently provides the following Exploration analysis techniques:
- Free-form exploration – used when you want to visualize data in tabular or graph form.
- Funnel exploration – used when you want to visualize the user’s journey throughout your site by looking at the steps needed to complete a goal.
- Path exploration – you’ll use this to explore your user journeys in a tree graph.
- Segment overlap – lets you compare up to 3 segments to analyze how they correlate and overlap with each other.
- Cohort exploration – gathers data based on common attributes of a group of users, such as acquisition date range.
- User explorer – used to gather data about a specific user at the session level.
- User lifetime report – data about how individual users behaved as customers and their lifetime value.
The default reports in GA4 help you monitor the key business metrics. But Explorations give you access to data and analytical techniques unavailable in the pre-built reports. You can use Explorations to analyze the data in-depth and answer different complex questions about it, such as:
- How many users are passing through each step of the website funnel? And at which steps are drop-offs happening?
- What is the click-through rate of various CTAs (or forms) on my lead generation website?
- Which products have the highest view-to-add-to-cart ratio and which ones have the lowest?
Special note for PPC marketers using GA4
All users of the GA4 property can access the Advertising workspace segment. Reports within the workspace look and function differently than other GA4 reports. There are currently three reports in the Advertising workspace:
- Advertising snapshot: Get an overview of business metrics and then get deeper access into the areas you want to explore.
- Model comparison: Compare different attribution models that impact the valuation of your marketing platforms.
- Conversion paths: See your client’s customer paths to conversion, and learn how attribution models distribute credit on those paths.
You can use advertising reports to answer questions like:
- What roles did searches, referrals, and ads play in conversions?
- How much time passed between a user’s initial interest and purchase?
- What are the common paths customers initiate that lead up to conversions?
Real-time Reporting
Like UA, the real-time report in GA4 enables you to monitor app and website activity as it happens. It also provides the data in an easy-to-read format with visuals that include information about:
- The number of users that visited your site in the last 30 minutes.
- The source of the visitors.
- The description of users.
- The content type details with higher engagement.
- The type of events the audience triggers and the conversions they complete.
Both UA and GA4 provide powerful real-time reporting. However, Google Analytics 4 properties come with AI-powered improvements, one of which is a major facelift.
With GA4, you can access more interactive visuals, which can help you dive deeper into certain widgets like event triggers.
GA4 provides an immediate snapshot of the data using cards. You can utilize the cards to navigate data from one main viewpoint easily.
How to set up a default reporting identity?
Reporting identity is the method that GA4 employs to unify the journey of a single user as they move across devices.
GA4 uses the following four different methods for identity:
- User ID
- Google Signals
- Device ID
- Modeling
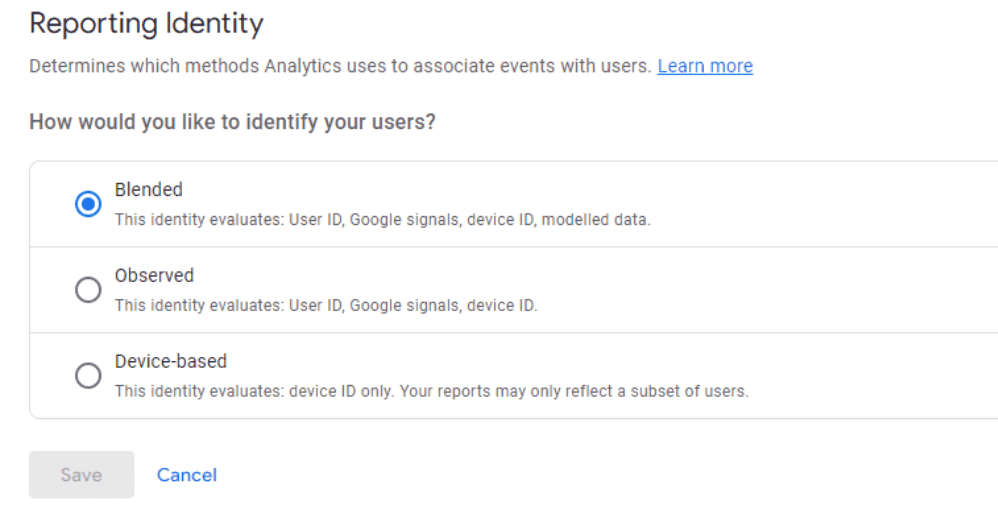
You have three options to select from – Blended, Observed, or Device-based.
In blended, it first relies on the User Id if you have implemented this.
In case of no User Id, the analytics will fall back to the second option – Google Signals (if enabled).
If neither the User Id nor Google Signal is enabled, it will fall back to the Device Id and if that is also not available, GA4 will use modeling.
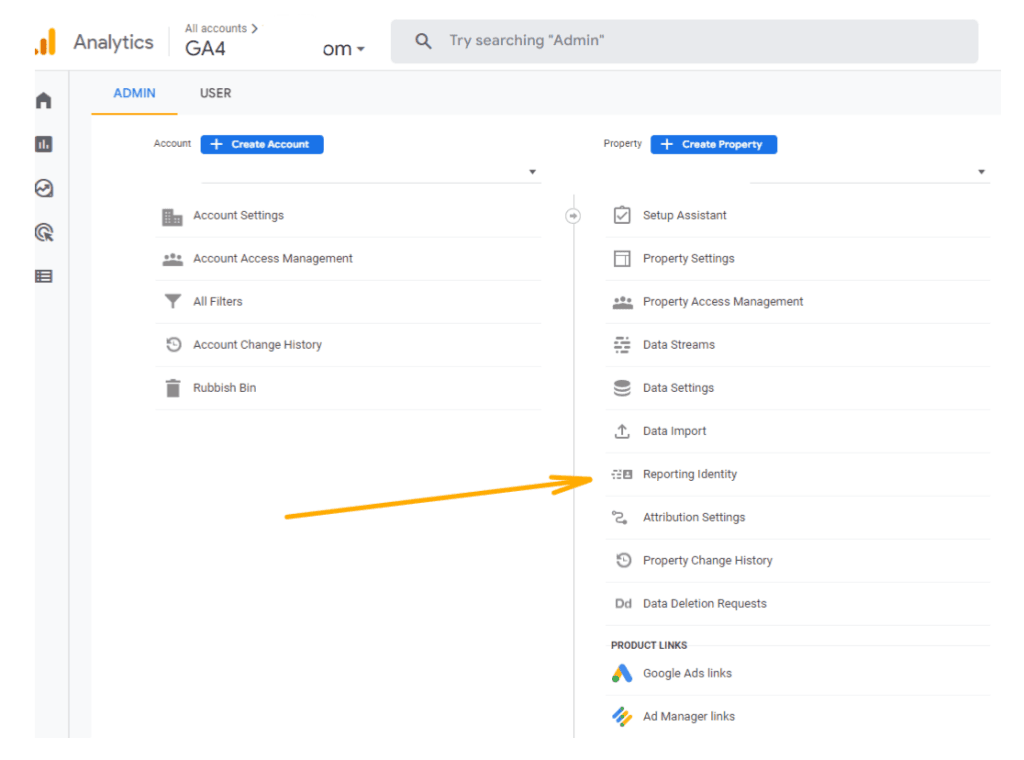
You can follow these steps to set up your default reporting identity
- Log into the GA4 property and click “Admin” on the bottom left of the dashboard
- Under “Property,” click “Default reporting identity”
- Select your preferred option among – Blended, Observed and Device-based
- Once you select your preferred reporting identity, you click save to implement the changes
Switching to GA4 and the next steps?
If you want year-over-year data for next year, you should set up GA4 now. The more you wait, the longer you’ll have to wait for the year-over-year comparison data.
You can use GA4 alongside UA until it is officially retired. For this, you can dual-tag GA4 in parallel to your existing UA so that your reporting system remains interrupted while you make this transition.
Follow the migration process with precision. Here are the easy steps can start with:
- Step 1: Create your GA4 property and launch it
- Step 2: Make a list of the key elements that you’ll be migrating to GA4 – events, goals, etc.
- Step 3: Begin migrating all elements to GA4
- Step 4: Link all other tools (Google Ads, Search console, etc) to your GA4
- Step 5: Finish the migration. Test and validate your data.
- Step 6: Define the date when you’ll be using GA4 as your primary source.
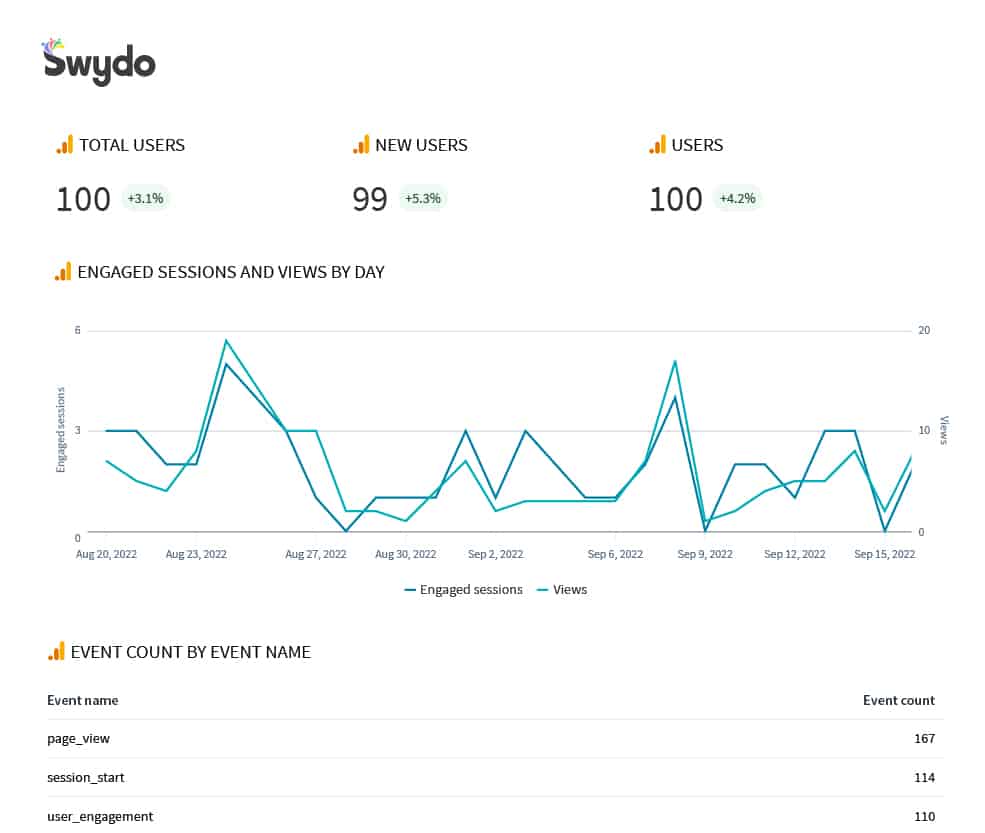
All your Google Analytics 4 marketing insights in one holistic report with Swydo
We understand that migration from UA to GA4 is challenging for most of us. Swydo is offering both integrations and appropriate templates to facilitate reporting on both UA and GA4. This means our clients can include both their UA and GA4 properties together in one Swydo report via separate pre-built widgets and customize their marketing campaign reporting the way they want. Once you’ve connected your analytics account to Swydo, you can include and customize essential GA4 metrics with data from 30+ other marketing channels to get a comprehensive look at your marketing efforts in one automated report or dashboard.