
In this third part of our Demystifying Google Analytics 4 series, we discuss the GA4 reporting interface and how to make the GA4 UI your own. Yes, it also explains how you can replicate many of your favorite Universal Analytics (UA) reports in GA4.
With only months before Universal Analytics stops collecting data, getting to grips with GA4 is essential. So why not take advantage of our special offer to all Swydo customers for 10% off each ticket with code ‘SWYDO10’ on our 6-week GA4 Immersion course.

In the previous article in this series, we discussed how to collect data with GA4 using the different event types and how these can be marked as conversions to report performance against.
So in this article, we will dive into the GA4 reporting interface, showing you some different customization options you can use to tailor the presentation of the data you are collecting to suit your own reporting requirements.
Then in the final two articles we will discuss the following:
Part 4 – GA4 and Swydo: How to get the data you need in the place you need it
Part 5 – What’s next? Get the answers to what the future holds, what do you need to do, and when
You may also want to check out the recording of our recent Measurelabs/Swydo joint webinar exploring the most common GA4 questions marketers have.
Back to the GA4 reporting interface, the reports workspace in GA4 is highly usable right out of the box and you can read more about this in our Measurelab blog posts Understanding and using GA4’s default reports and How to use the real-time report in GA4.
However, one of the main benefits of the GA4 reporting interface is how highly customizable it is and that will be our focus in this article.
You can edit the overview and detail reports, as well as the reports navigation menu, and even add your own reporting collections and topics.
Important notes:
- You need to be an editor or administrator to make report customizations
- You can undo any report customizations you make
- Everyone with access will see your customizations
Let’s do this step-by-step.
Overview and detail reports
You can edit any existing report in GA4 by simply clicking on the “Customize Report” button in the top right corner (the pencil icon).
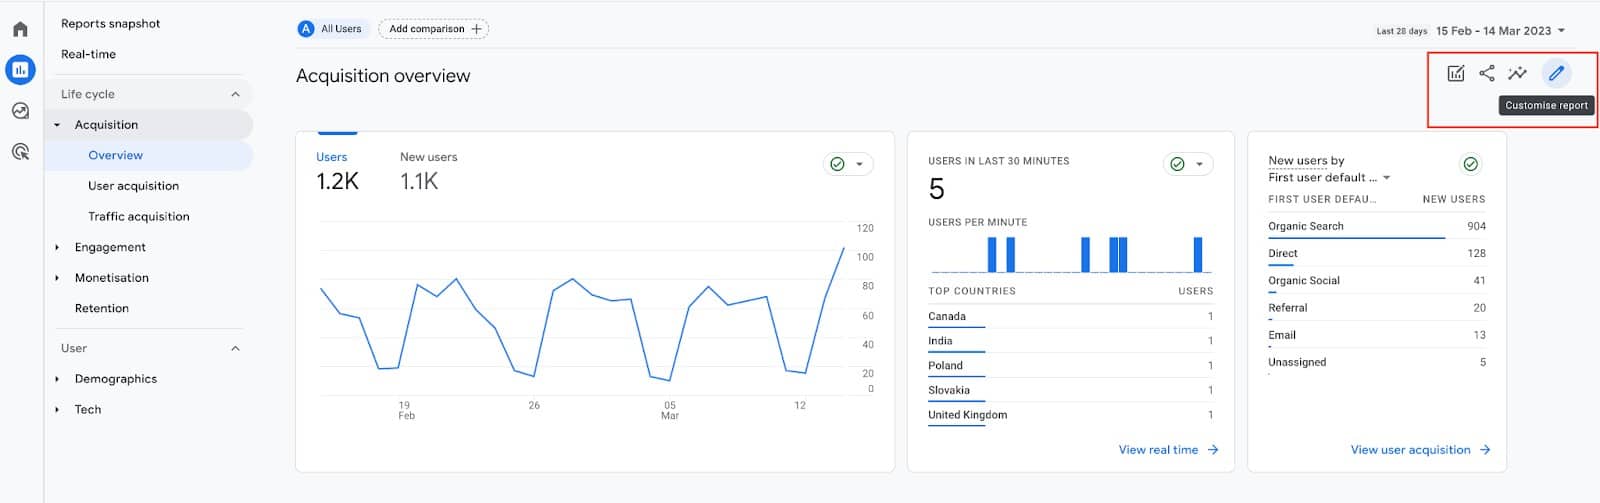
This will bring up the report editor panel on the right-hand side of the report.
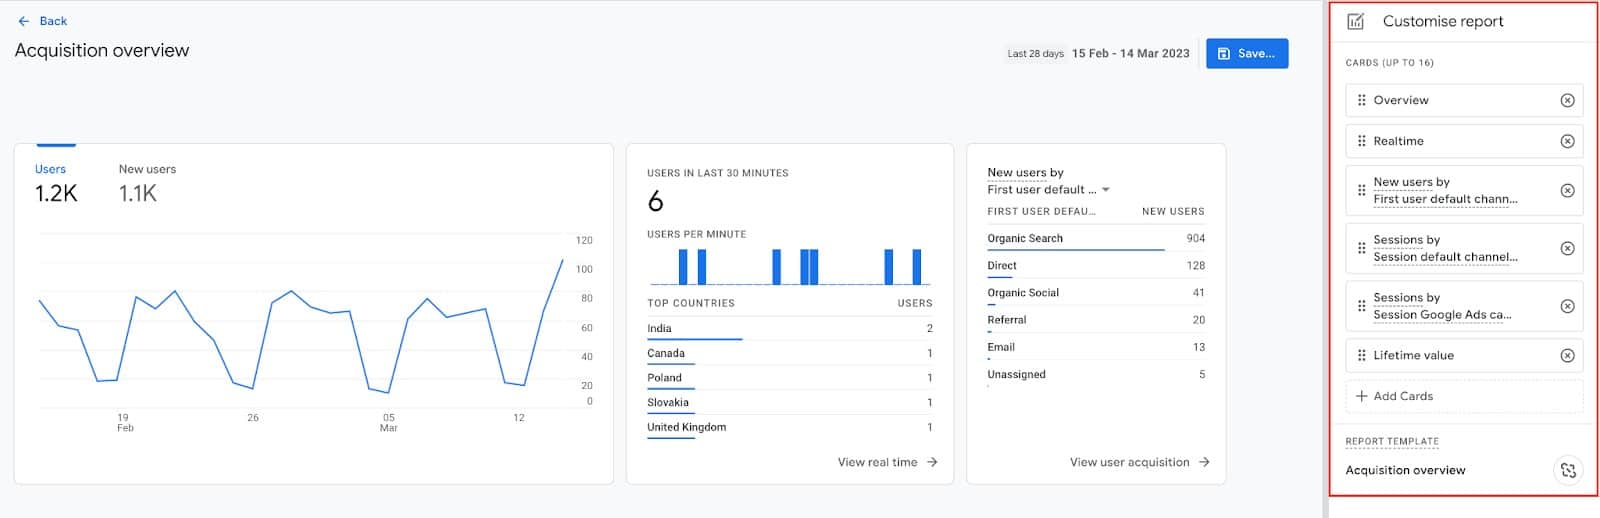
Within this report editor panel, you can remove existing reporting cards (each block of data in the report), reposition them, and add new ones – up to a maximum of 16 cards per report.
The default reports are standard across all GA4 properties so they are likely to include some data that won’t be relevant to your business. In the example above for the Acquisition overview report, one of the default cards included is for Google Ads traffic. This particular website does not advertise with Google Ads so this reporting card could be removed as it will never show any data. We could also add in Conversions by Default Channel Grouping.
Once you are happy with your changes you just need to click “Save” and view your newly customized overview report.
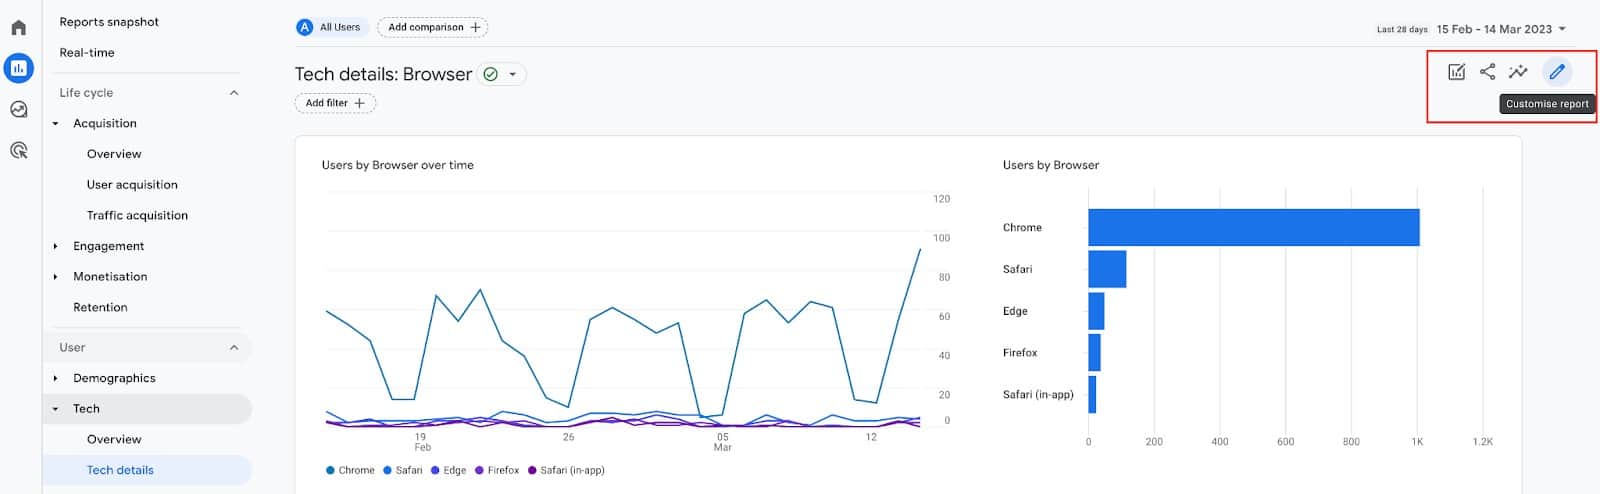
Editing detail reports is very similar so let’s take the example of the “Tech Details” page shown below. Again click the pencil icon in the top right corner.
This will open up the report editor panel.
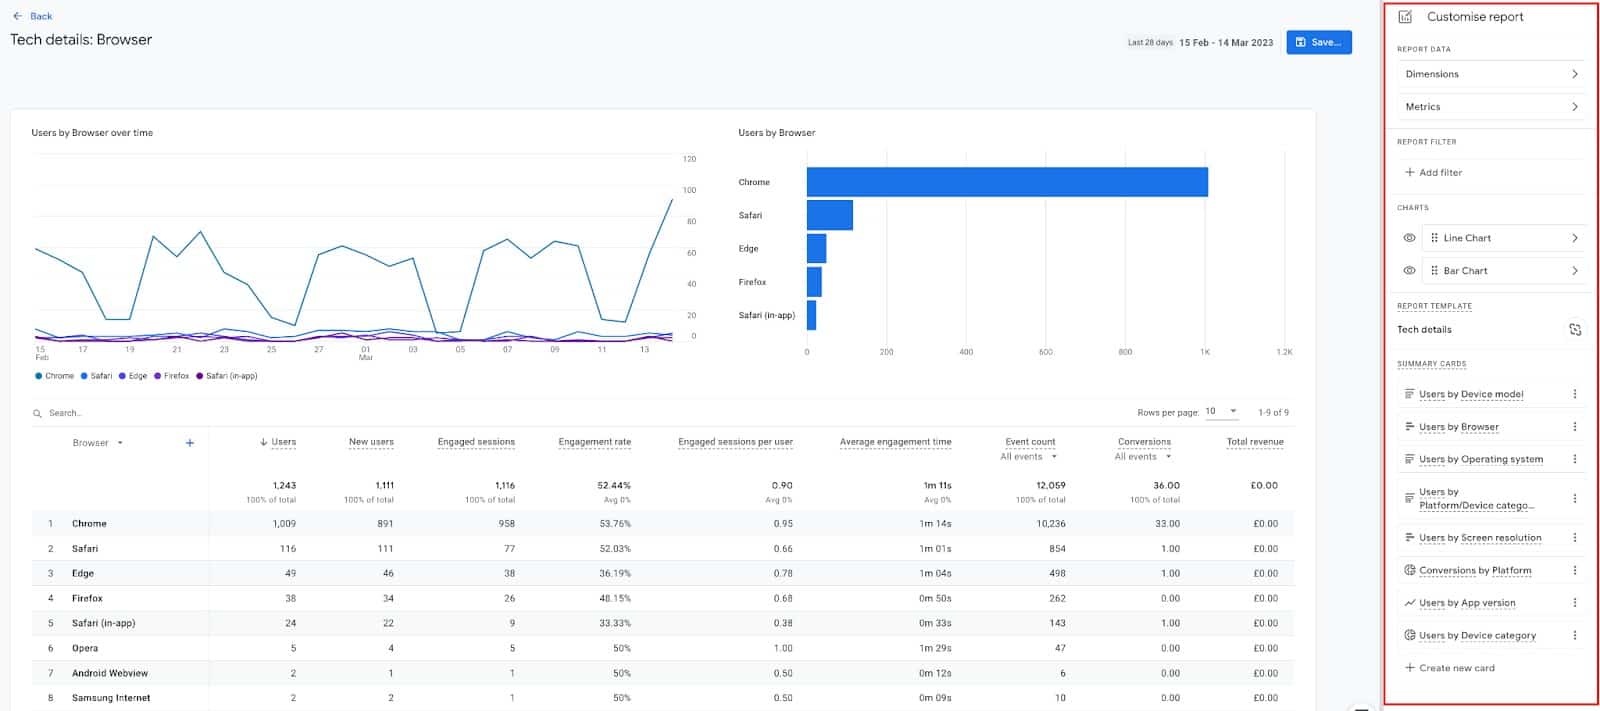
It’s the same report editor panel that we saw with an overview report but this time we have a few more customization options.
For the two charts shown on the page, we can change the chart type between bar, scatter and line. If you think this is limited, bear in mind this is not dashboard building (like you can do more comprehensively in Google Looker Studio) but simply editing some existing interface reports. You can also hide one or both of the charts and reorder them (left or right) if you wish. You can also change the dimension used in the charts by clicking on the Dimensions list and then choosing a different default dimension, as shown below.
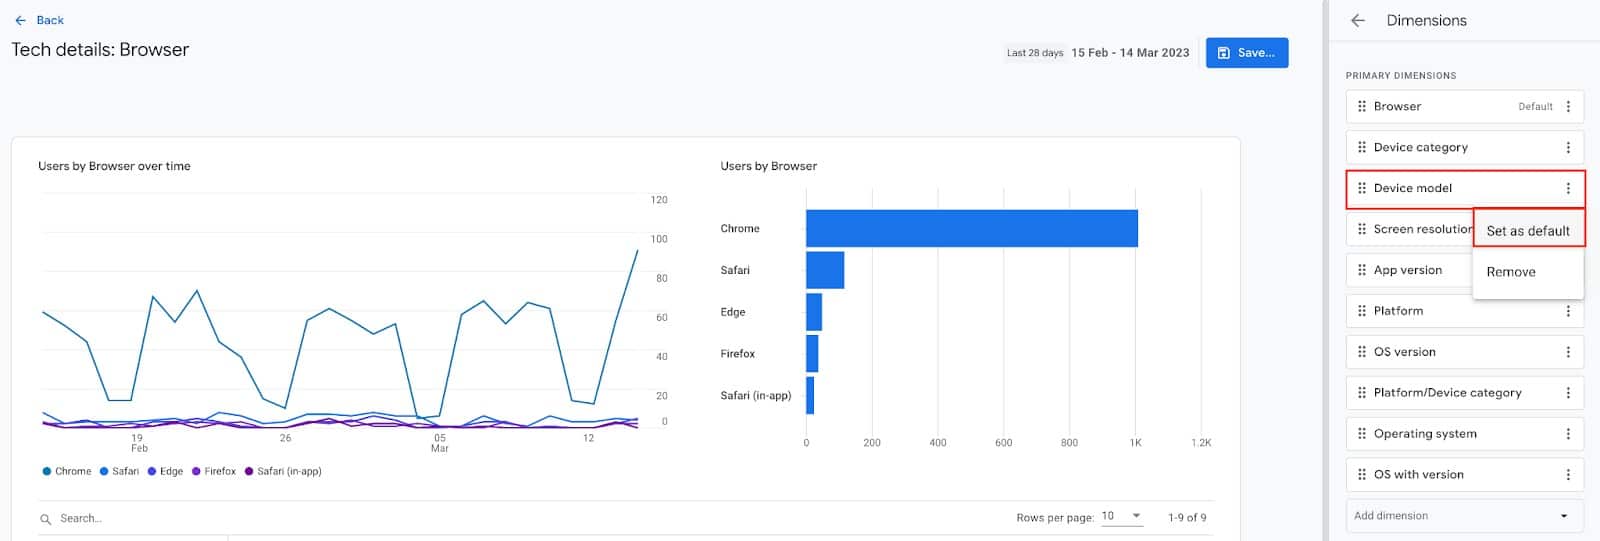
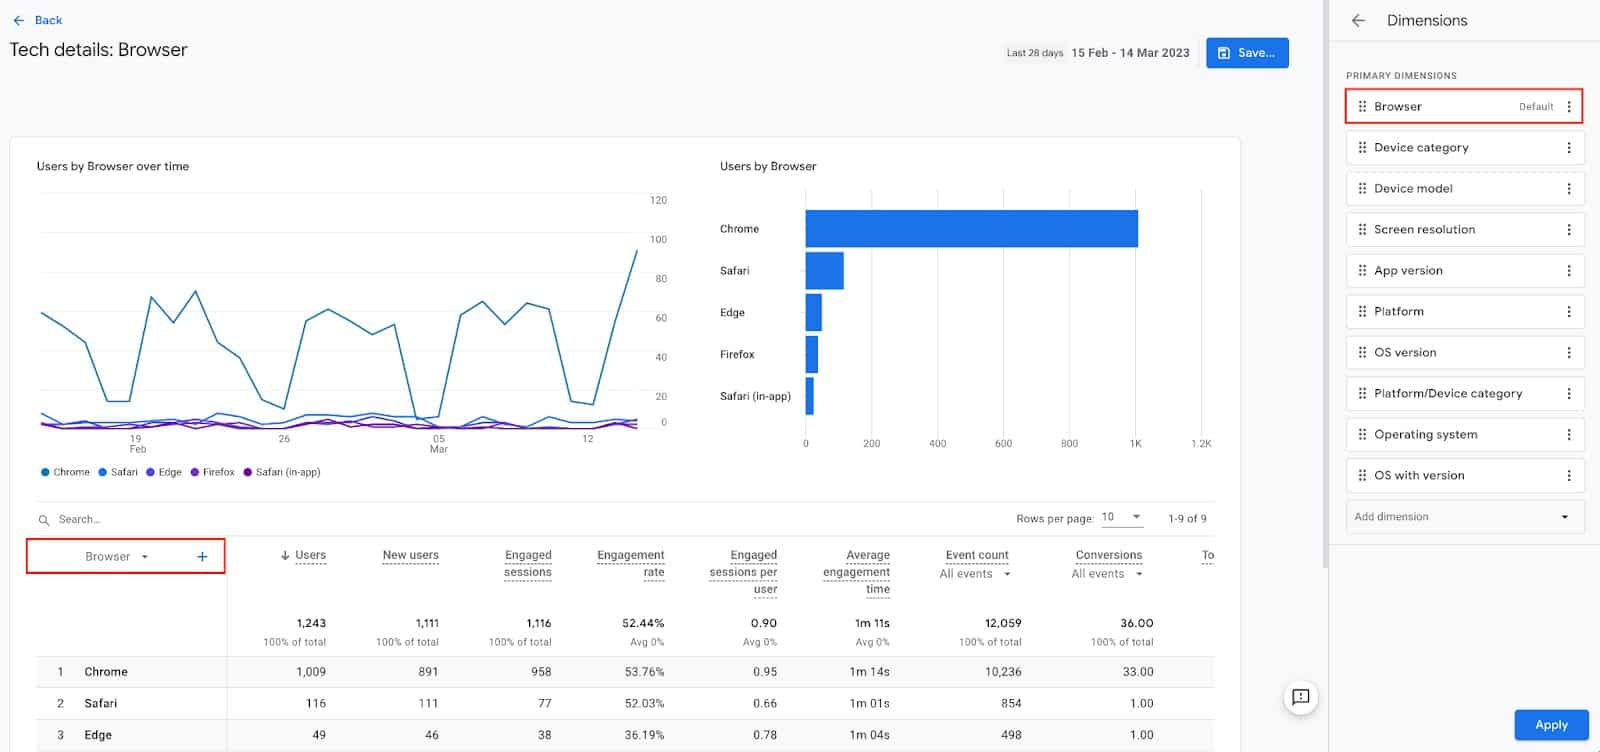
Whichever dimension is set to default in this list will also be the primary dimension in the report table.
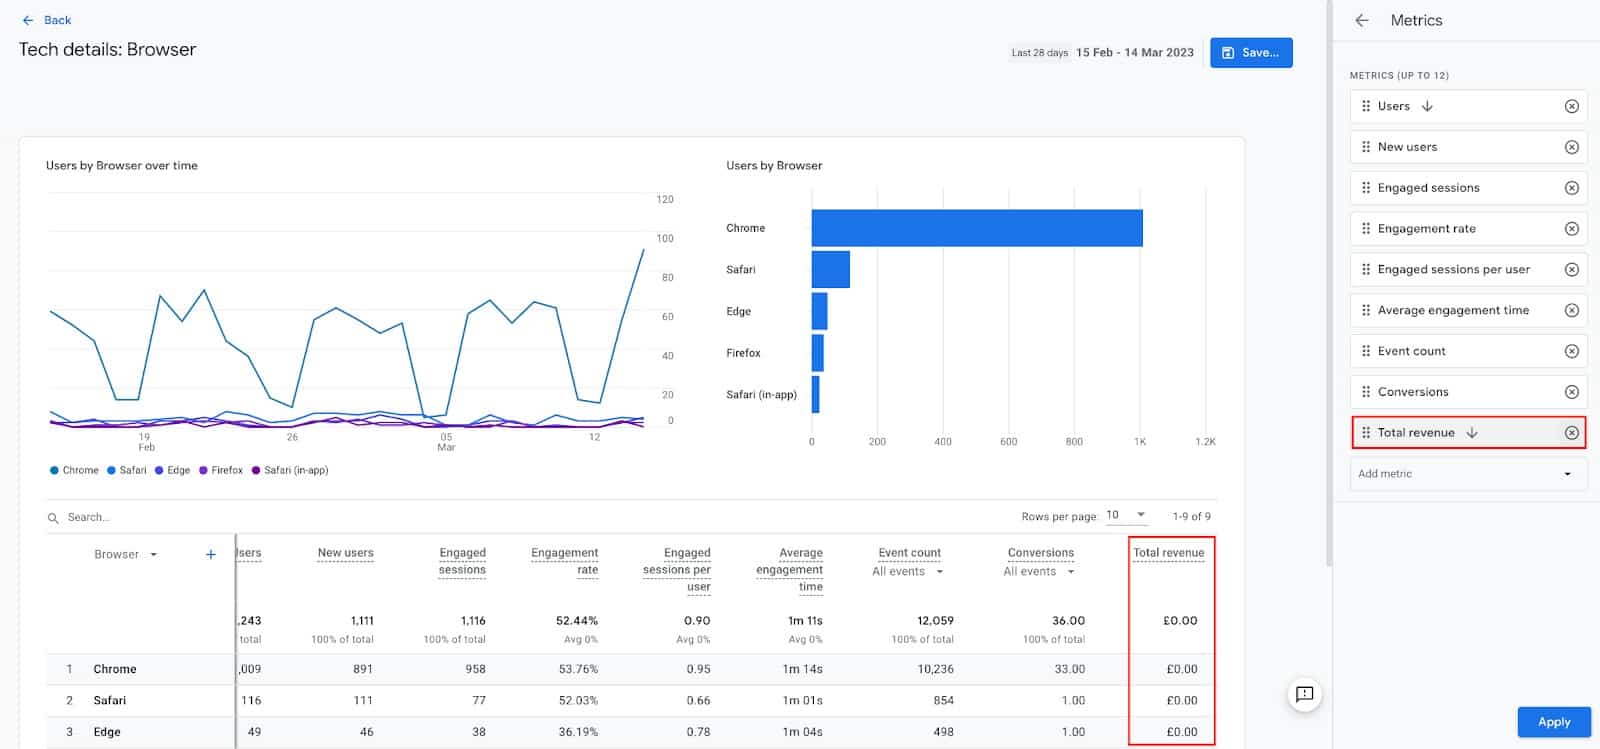
Whereas clicking into the metrics list will allow you to control which metrics are shown in this table. You can remove existing metrics, add new ones and reorder the list to suit your preference. In this example, there is no revenue being collected as this is not an E-commerce business so the “Total Revenue” metric could be removed from this report.
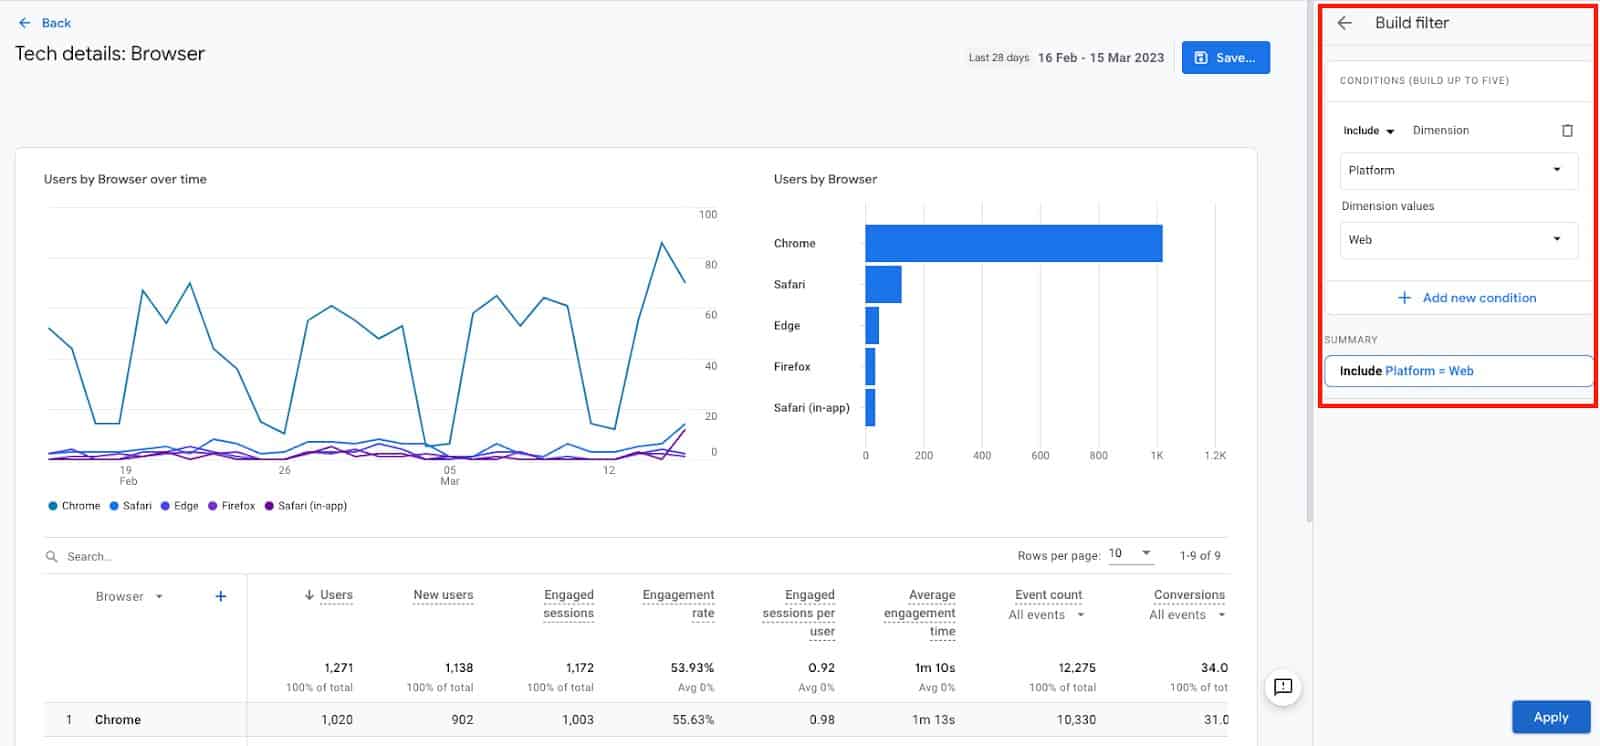
One other customization you can make to the detail reports in GA4 is to save a custom report filter to show only a subset of the overall data to users of this report. A good example would be to filter to include only web data if you are collecting both web and app data into your GA4 property (or vice versa). The screenshot below shows how you would configure this report filter only to include web data.
Customize the navigation menu for the reports workspace
So far, we have shown how to edit the reports themselves, customizing the dimensions, metrics, and charts shown to users of the reports. Now we will zoom out a level and look at customizing the navigation menu for the reports workspace.
By default, we see the menu below when we click into the reports workspace.
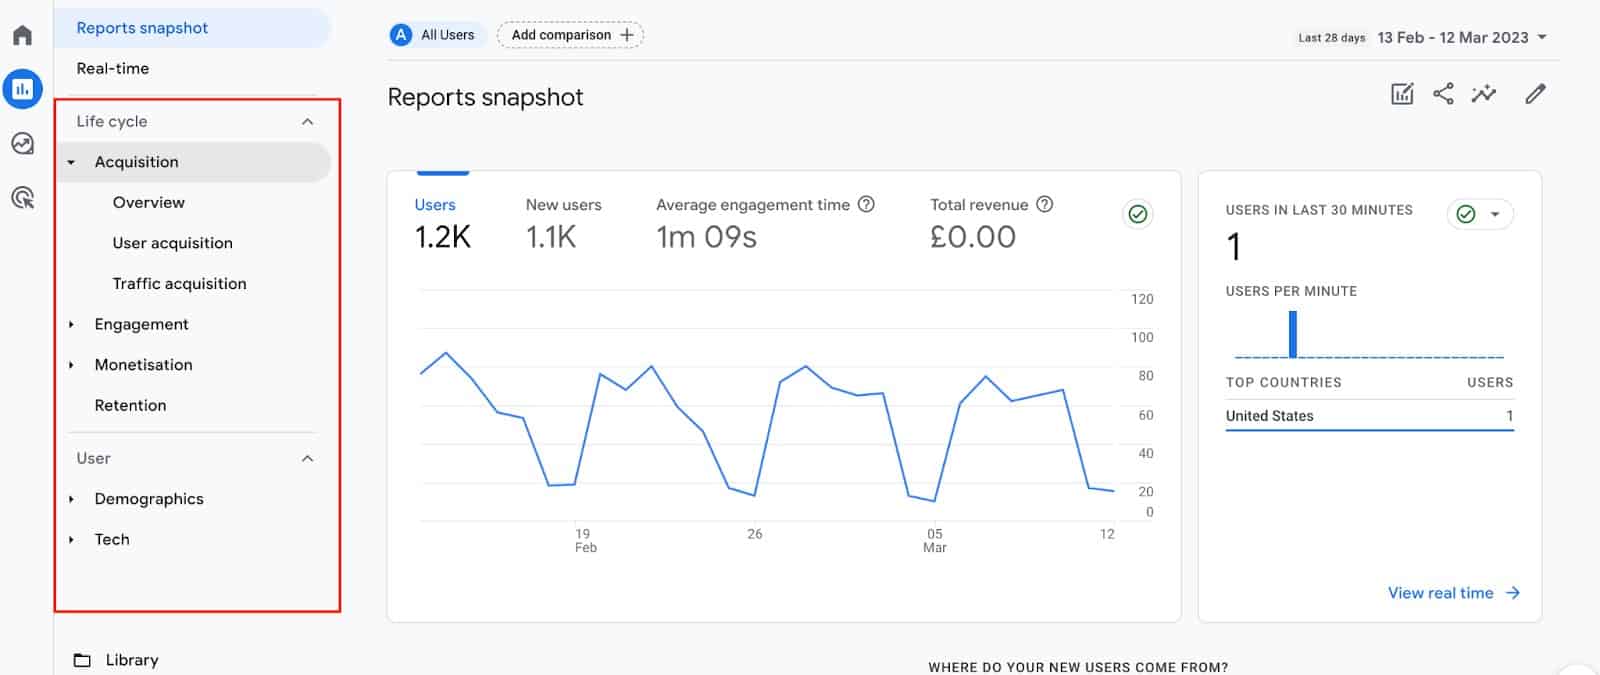
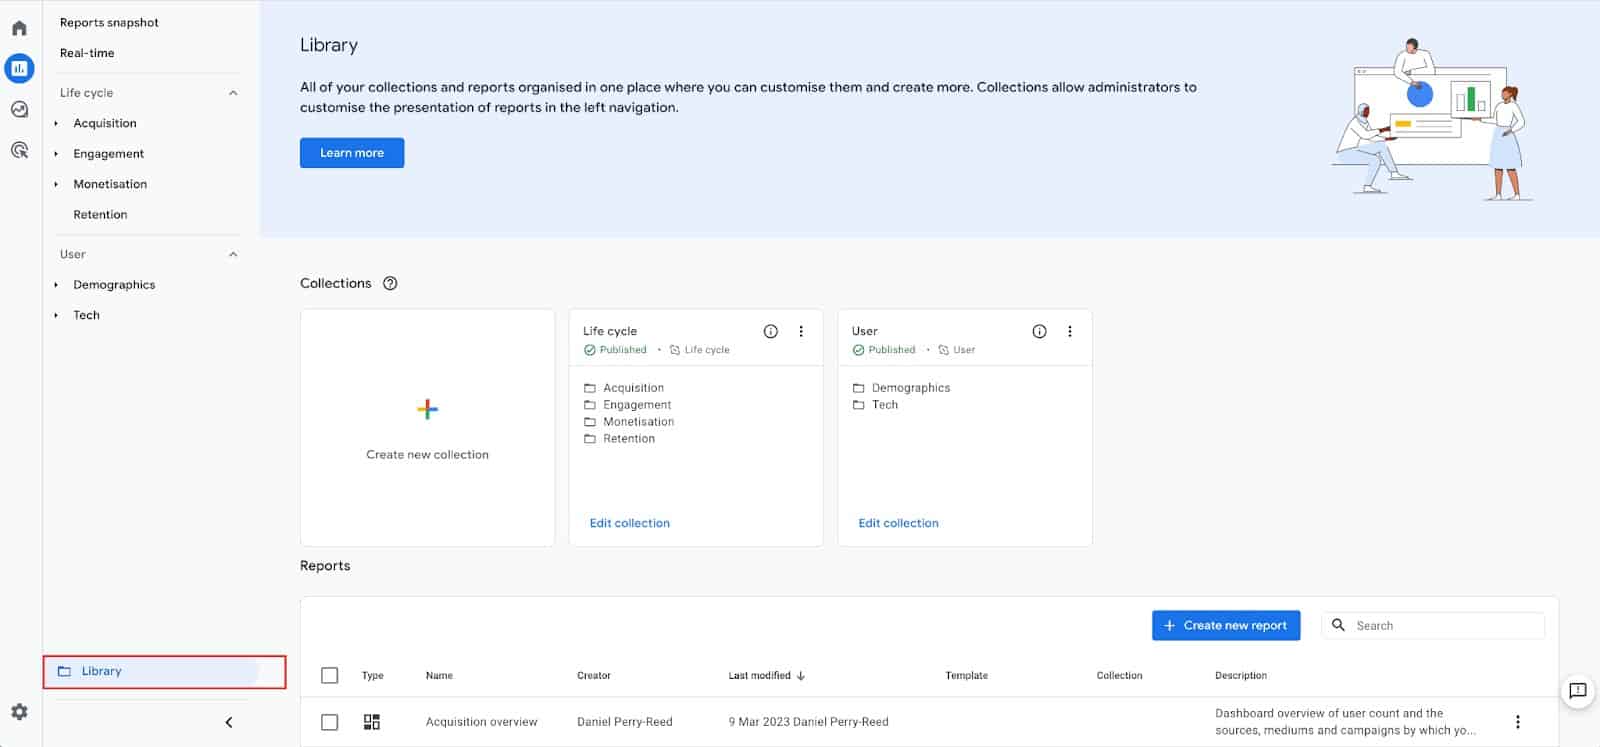
We have two default reports, “Collections”: Life cycle and User, and within each of these, we have “Topics” (e.g., Acquisition) and Reports (e.g., Traffic acquisition). We can edit the existing Collections, Topics, and Reports included by default as well as add new ones by clicking into the Library (link at the bottom of the menu).
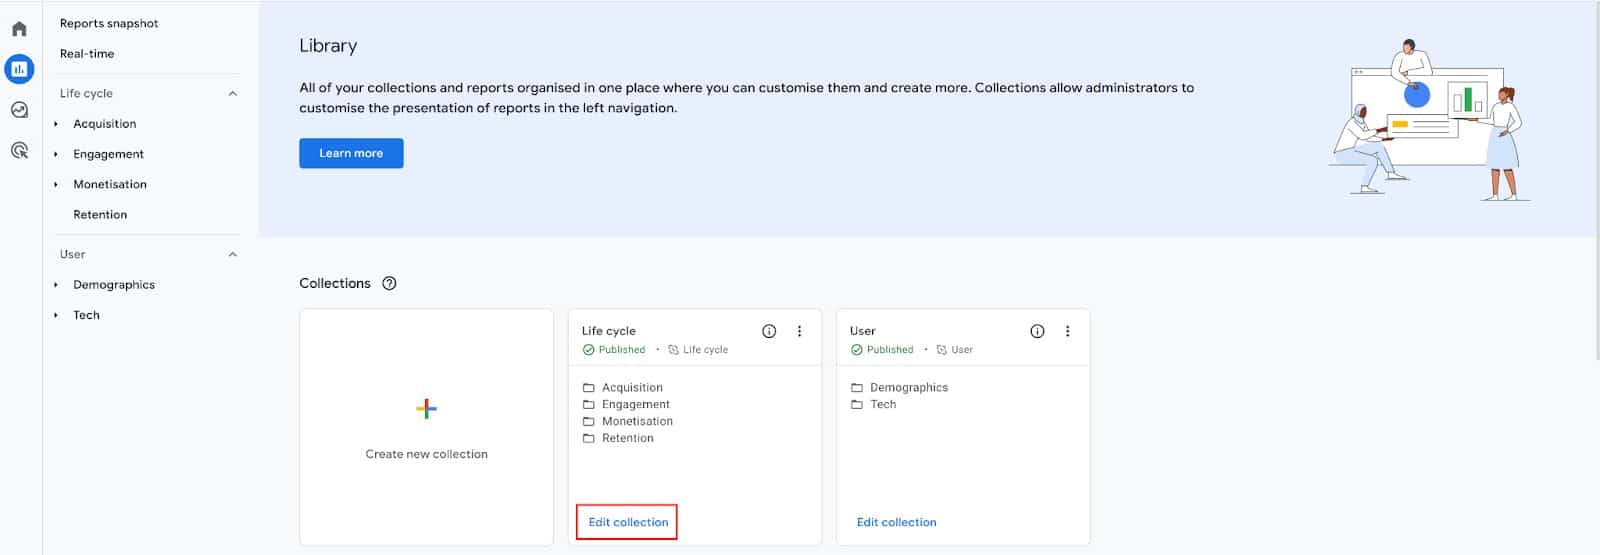
If we are not collecting any revenue data, then we might want to remove the Monetisation “Topic” from the Life cycle “Collection”. To do this, we would click on the blue “Edit Collection” link at the bottom of the Life cycle “Collection” card.
Then scroll down to find the Monetisation “Topic” and click the “x” icon to “Remove Topic”.
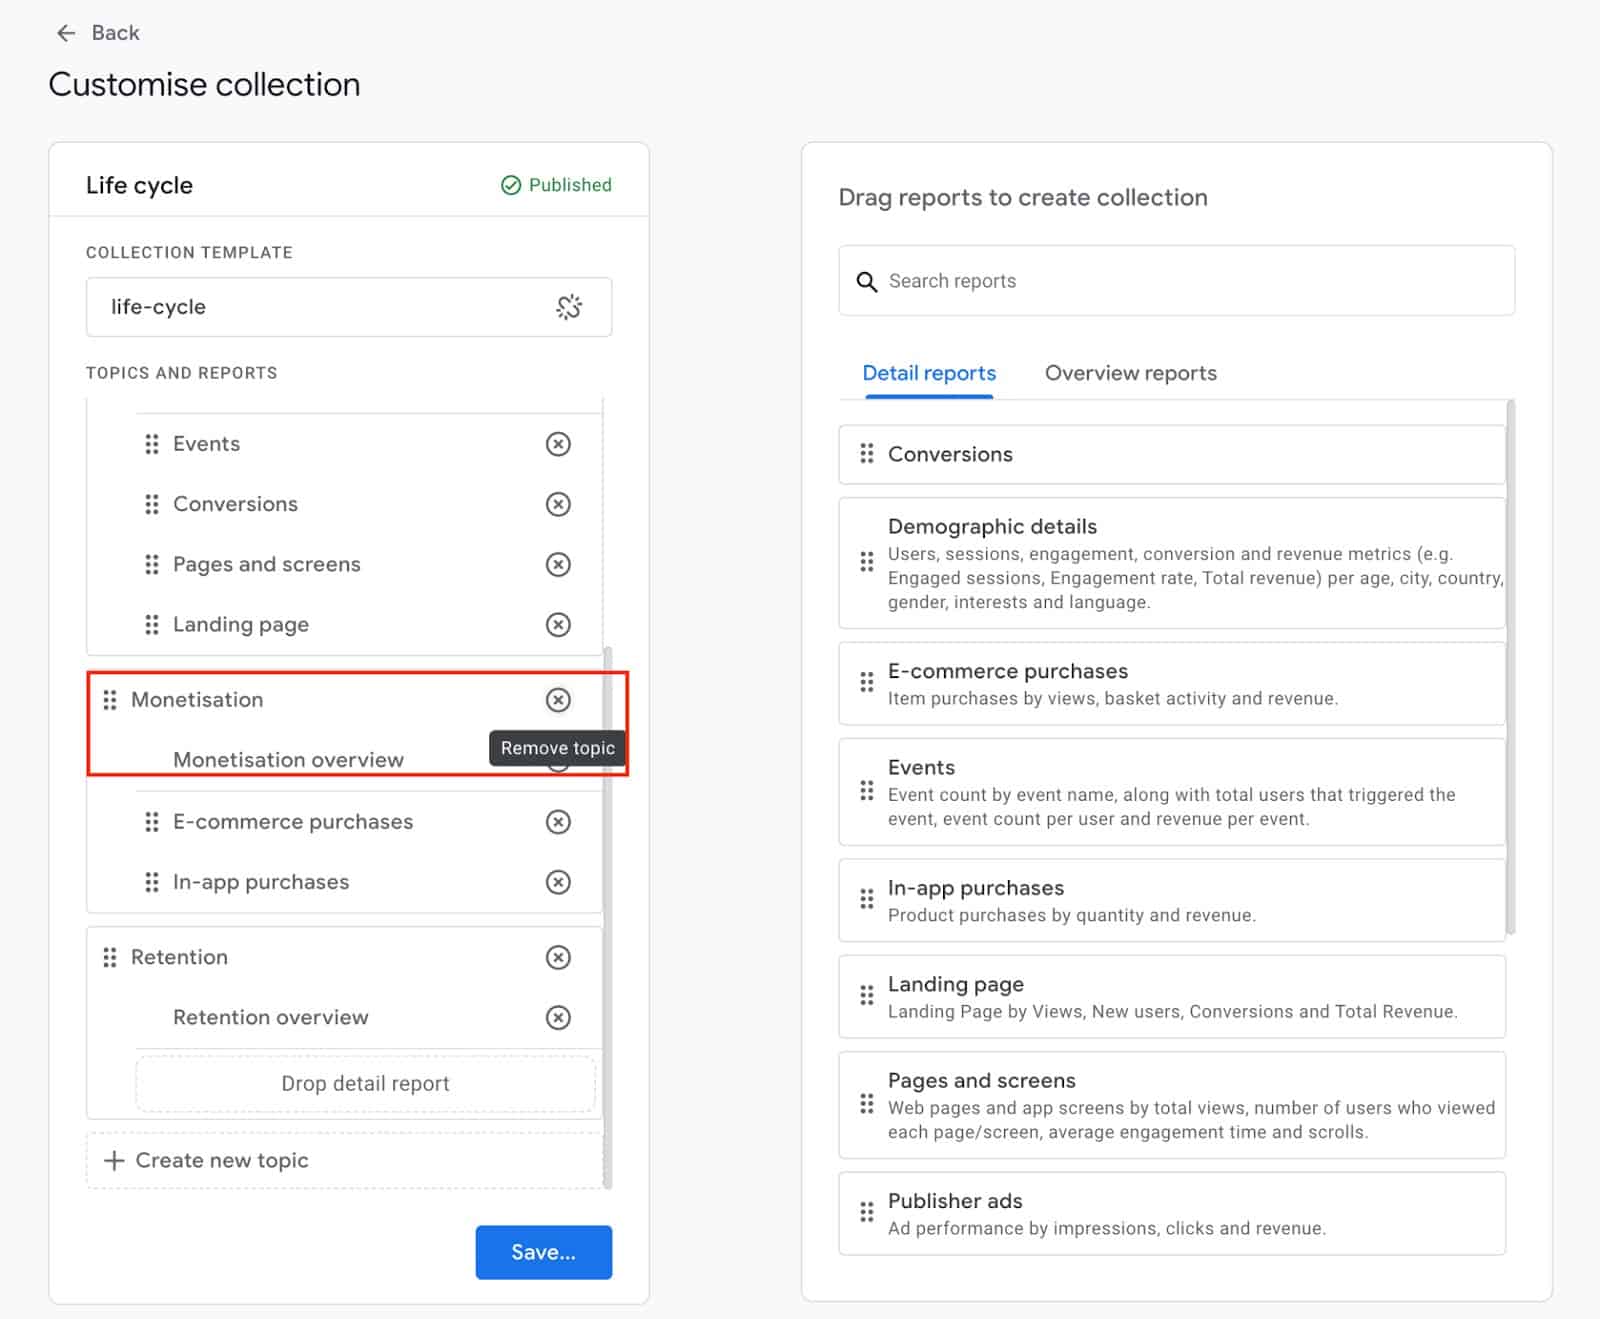
This will then remove that Topic from the menu for all users of this GA4 property.
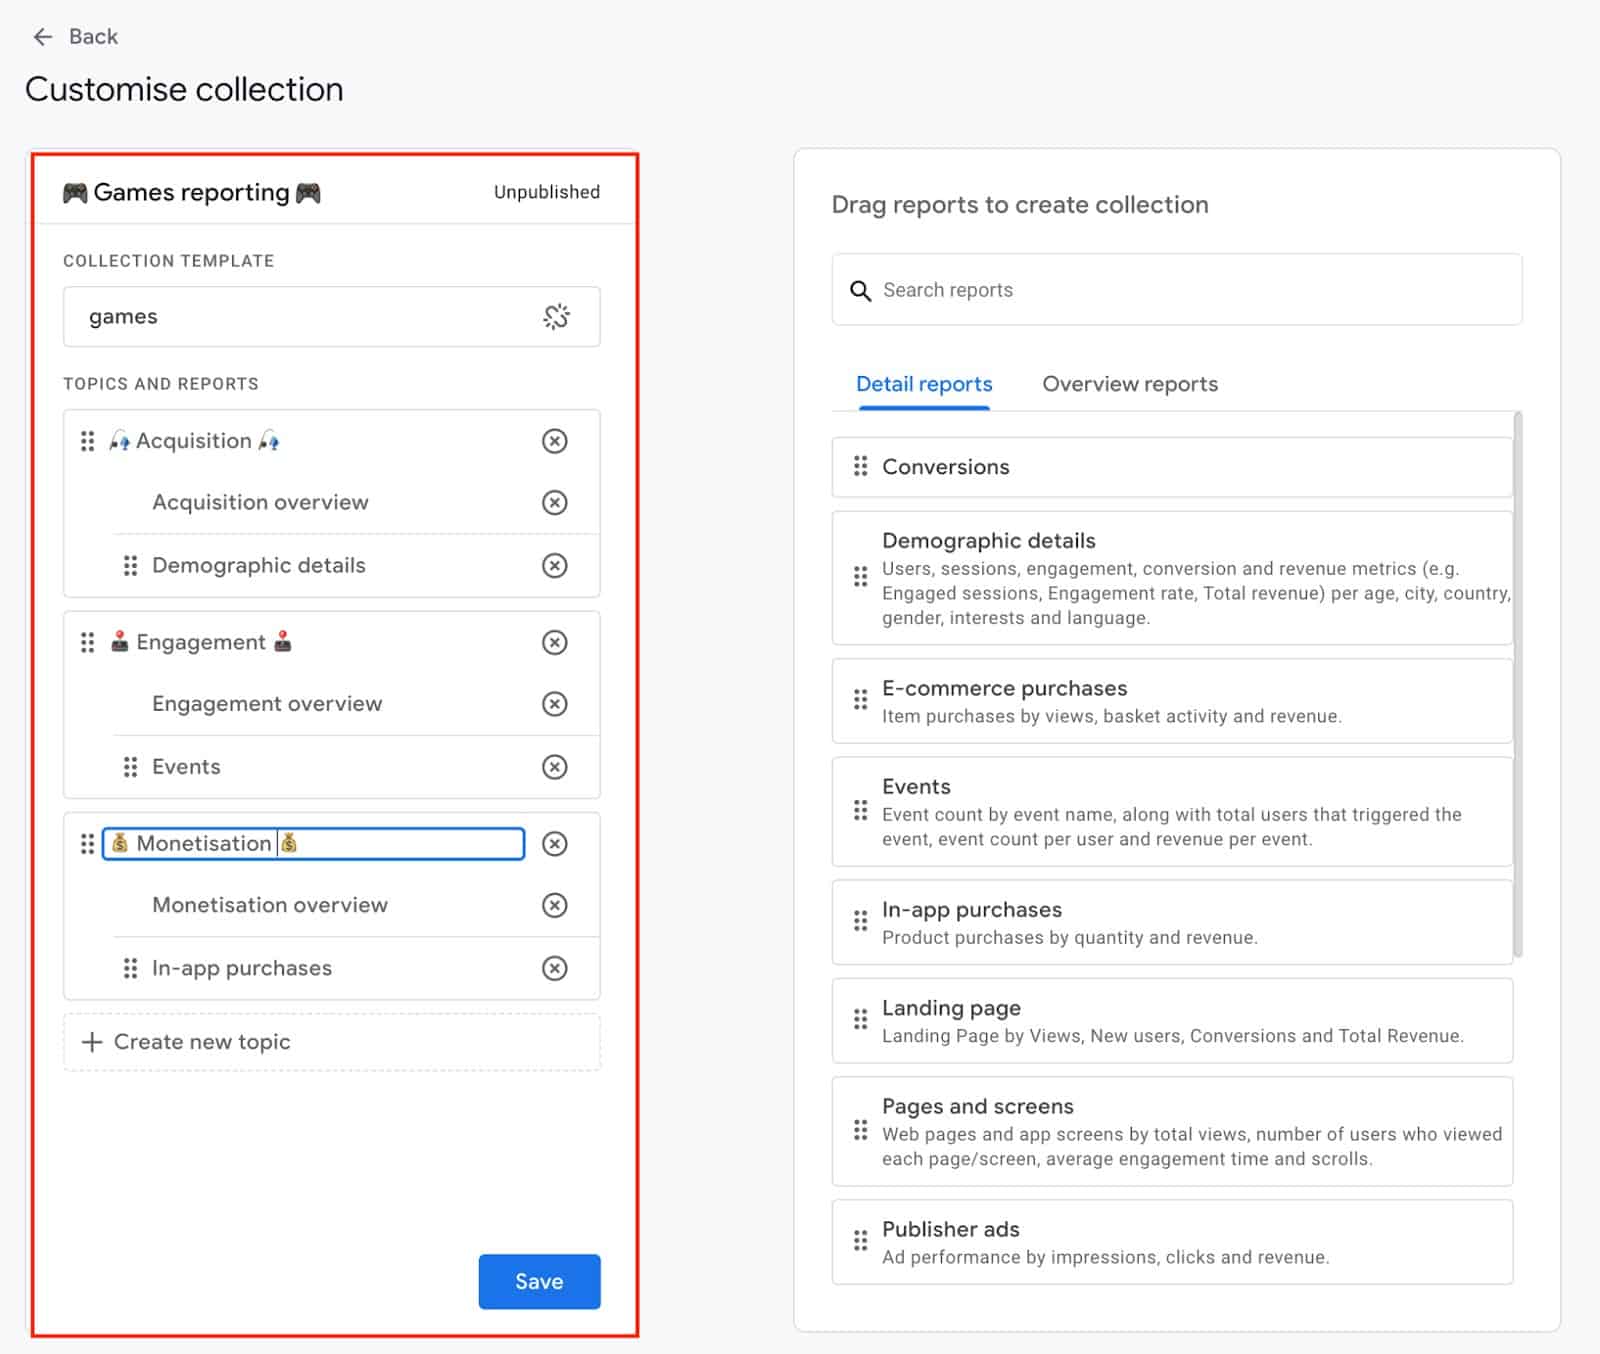
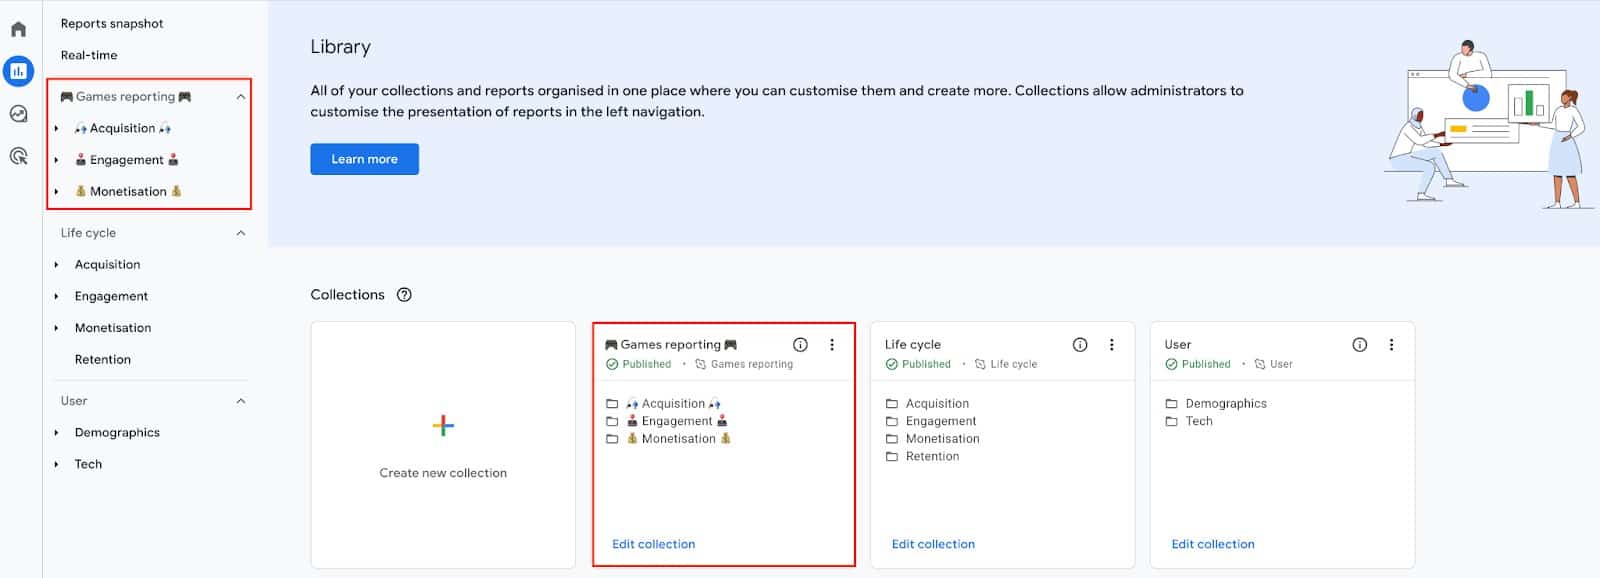
You can also build new Collections entirely from scratch if you wish, or start them from a template.
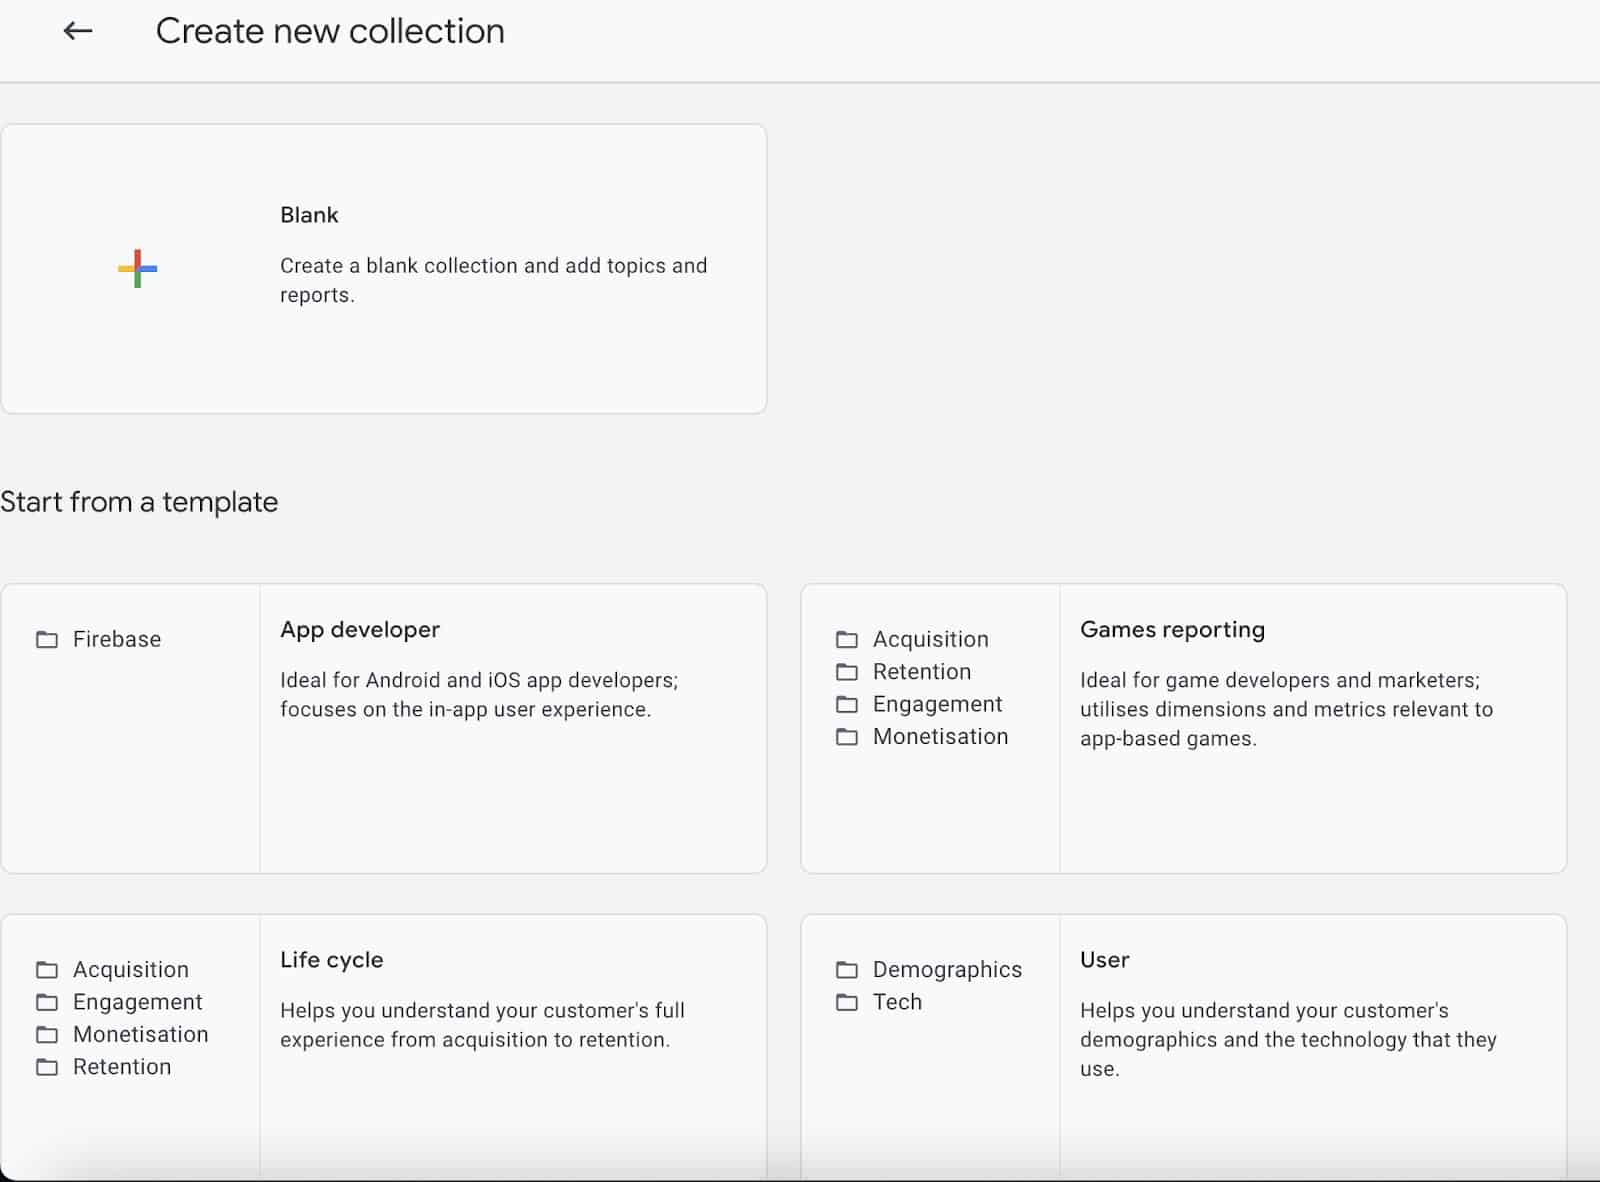
You can even use emojis in your new Collection and Topic names if you’re feeling brave! 🤯
Replicating your favorite UA reports in GA4
As we’ve shown in this article, the reporting interface in GA4, which is useful even by default, can be fine-tuned through the different customization options to present the data you’re collecting in GA4 in a way that suits you and your fellow report users. We hear a lot of people say the GA4 interface is lacking compared to Universal Analytics but in reality, much of the same reporting data is there; it’s just a simplified User Interface. You can replicate many of your favorite reports by simply changing the primary dimension in any of the detail reports in GA4.
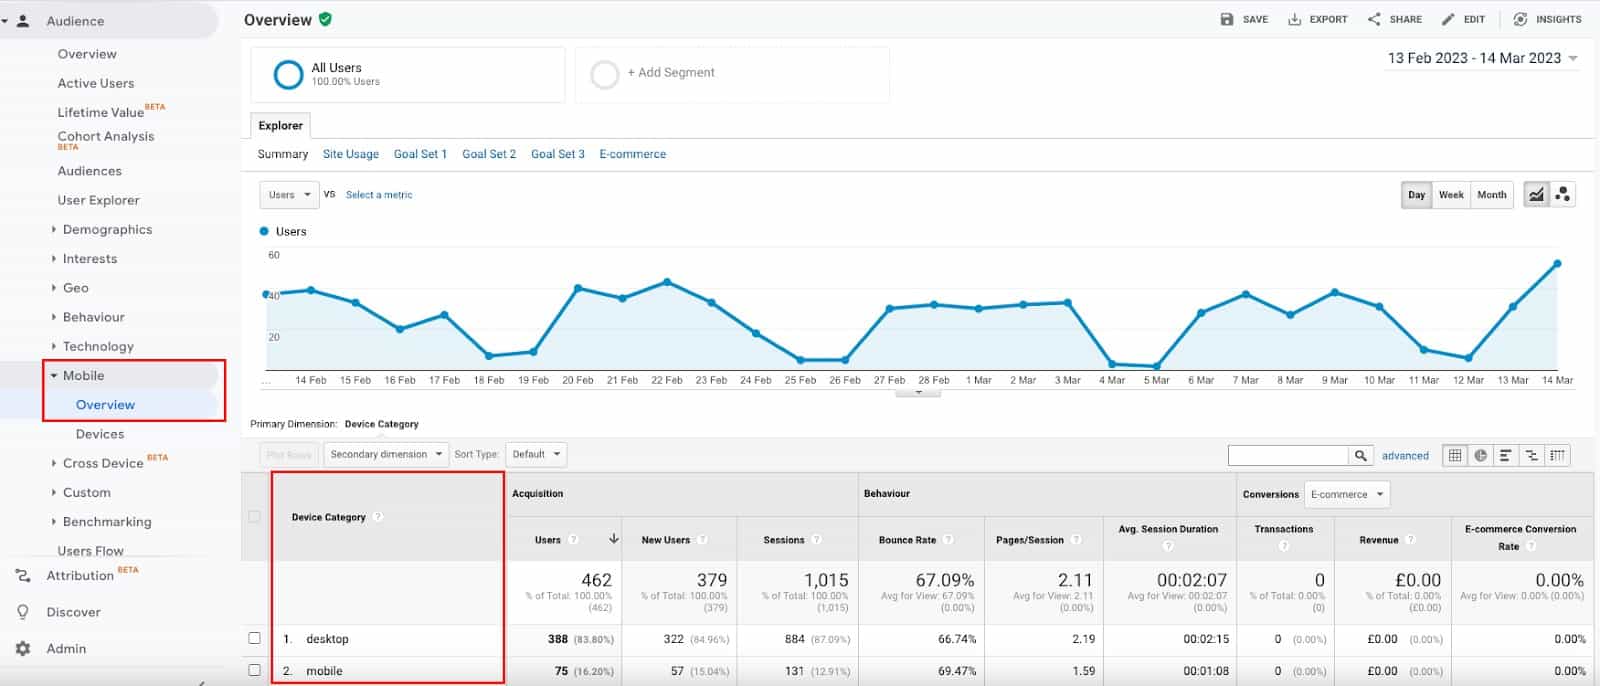
For example, in Universal Analytics, there are separate reports for Browser & OS and Device Categories, as shown below.
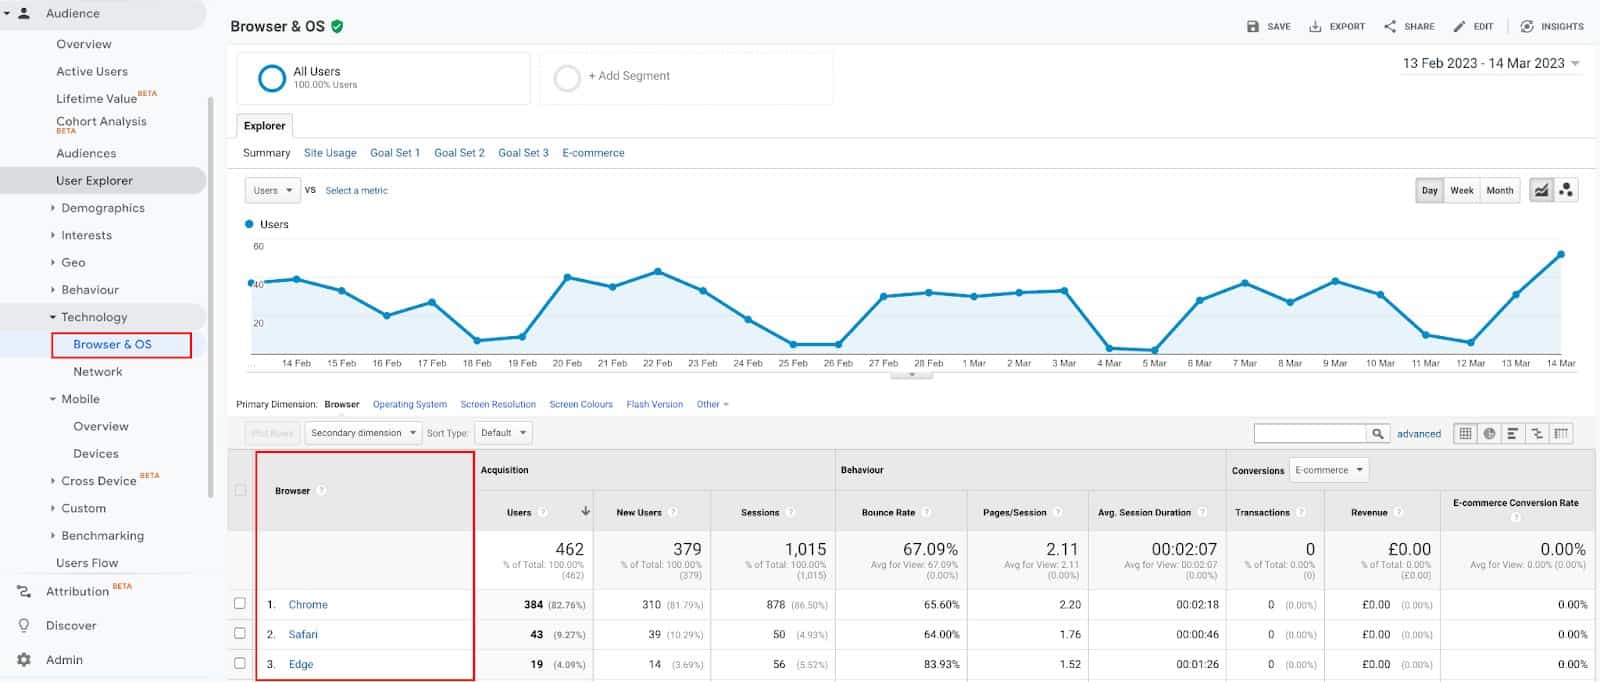
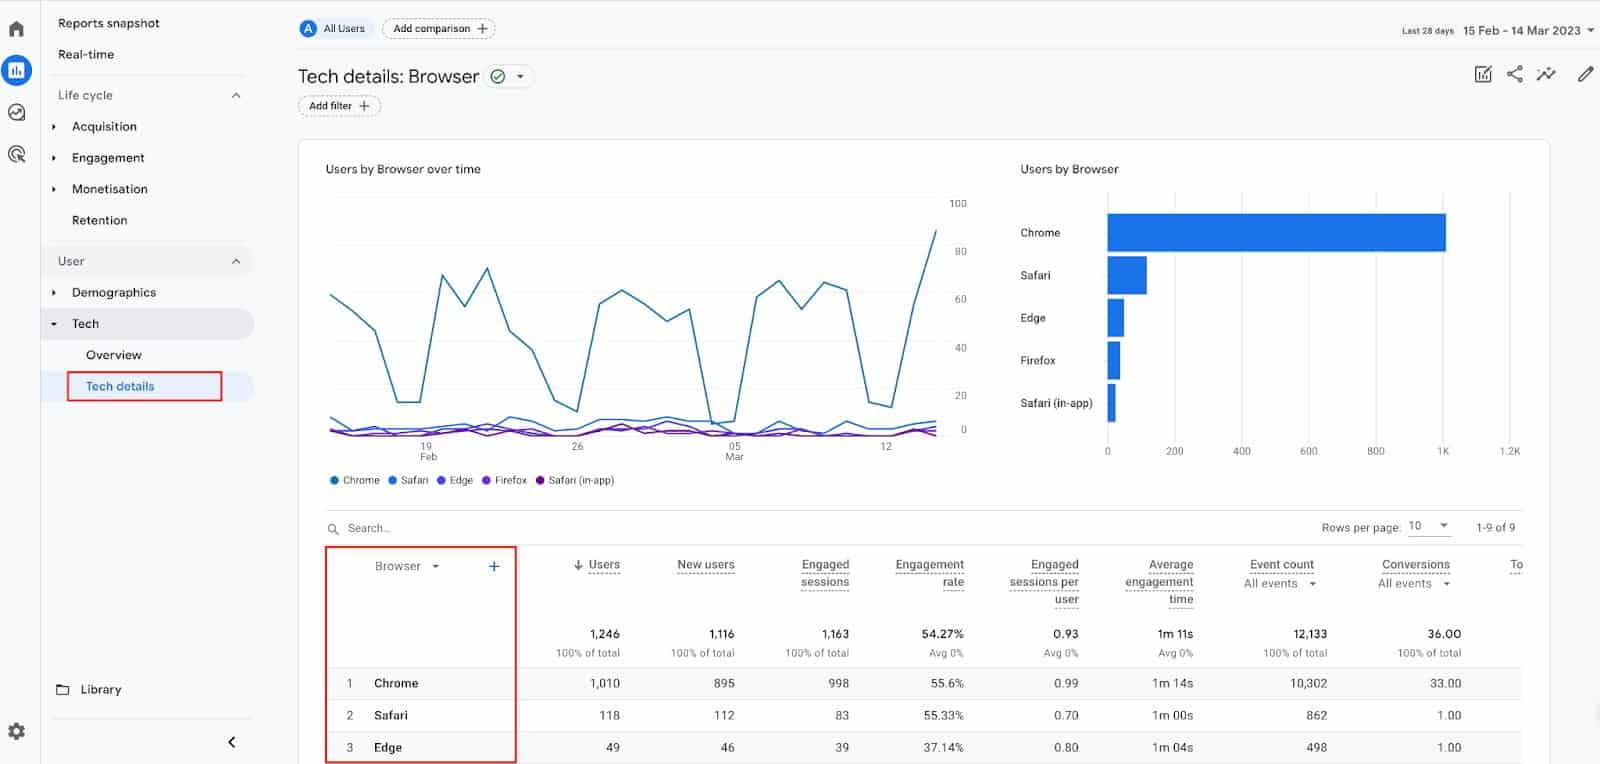
Whereas GA4 simplifies this by containing the same combined data in a single report, “Tech Details”. This defaults to the primary dimension of “Browser”:
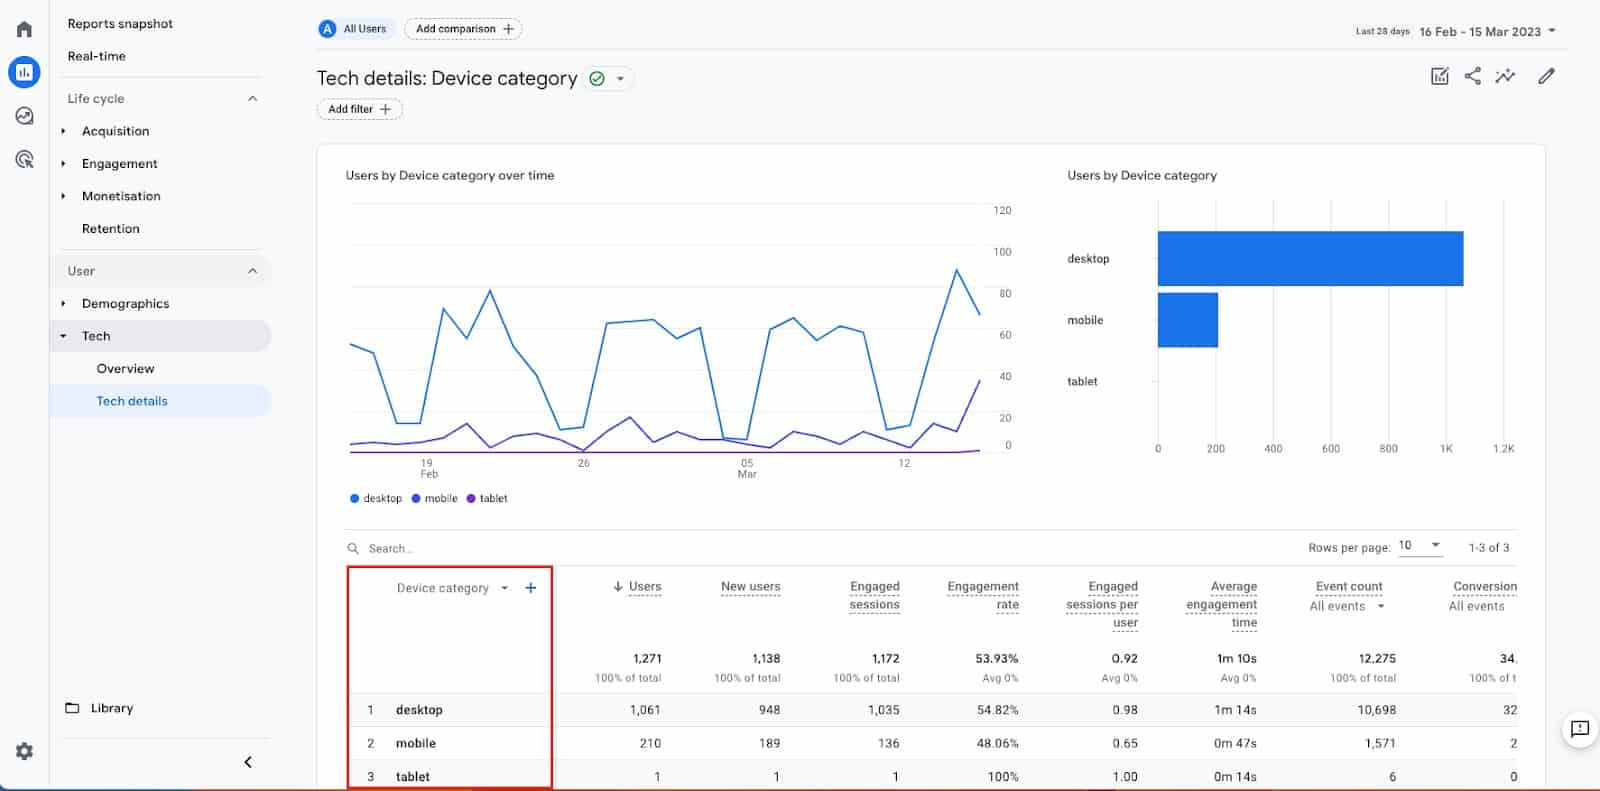
You can then change with the primary dimension drop-down to show your device categories without needing to navigate to a different report:
And of course, as we’ve shown, you can then customize these detail reports to present the dimensions and metrics that are most relevant to you.
We hope this guide helps you tailor your own GA4 reports to make them more meaningful for your business, which in turn will save you time finding the data you need to act on. In the next article, we will move on to looking at GA4 data in Swydo.
Track your GA4 data with Swydo
Connect your Google Analytics 4 account to Swydo, you can include GA4 metrics with data from 30+ other marketing channels to get a comprehensive look at your marketing efforts in one automated report or dashboard. Sign up for a free 14-day trial or schedule a walkthrough.

Dara is the CEO of Measurelab. He has specialized in Google Analytics for the last 15 years, consulting clients, running training courses, and speaking at industry events. His mission now is to make Measurelab the world’s favorite digital analytics consultancy and the all-time greatest place to work (for analytics types).