
Looker Studio is great — until it isn’t. For a small or early-stage agency juggling a handful of clients, it feels like the perfect tool: clean, easy, and free. But the second you cross the 10-client threshold, cracks appear. Reports slow to a crawl. Data disappears. Suddenly, you’re spending more time fixing dashboards than doing real marketing.
This guide prepares you for the invisible wall agencies hit when scaling Looker Studio — and shows you how to build reporting flows that won’t collapse under growth.
How Looker Studio Performs at Different Scales
Right around the time your client count hits double digits, the cracks in Looker Studio start to show. The problem has many faces: slow loading, chart glitches, frustrating limits on data, lagging refresh rates, and so on.
Let’s say your agency has grown to 20 clients. A cause for celebration? Not for your Looker Studio report workflows. You’re duplicating dashboards for each one, manually updating connectors, and troubleshooting broken reports every week. Suddenly, the tool that once saved time now eats it.
If you’ve reached this critical turning point with the platform, it’s time to ask: Can Looker Studio scale with your reporting needs, or is it time to make a switch?
The Sweet Spot: Why Looker Studio Thrives at 5-10 Clients
At this scale, Looker Studio delivers exactly what it promises. Agencies can manage reports for individual clients without sinking hours into performance reporting. Each client gets a dedicated dashboard pulling key metrics like CAC, ROAS, and MQLs from sources like GA4, Google Ads, Meta, TikTok, or LinkedIn.
Pre-built templates speed things up. Account Managers typically spend 1–2 hours per setup customizing KPIs, applying branding, and fine-tuning visualizations. Most reports stay under 5,000 rows and include fewer than 20 widgets — which keeps loading fast and avoids timeouts. Third-party connectors for non-Google platforms — like Facebook, TikTok, or LinkedIn — run about $200 per month at this level.

Most agencies start with a simple system — a Google Sheet or shared dashboard that tracks each client’s report links, refresh timing, and delivery schedule
This hub helps your team instantly locate reports, check permissions, stay on top of due dates, and flag issues before the client does.
| Typical Setup for 5–10 Clients (Per Client) | ||
|---|---|---|
| Setup Component | Typical Range/Cost | What to Expect |
| Setup time | 1–2 hours per report | Template customization, branding, and KPIs |
| Average data volume | ~5,000 rows | From GA4, Meta, Google Ads, CRM |
| Widgets per report | <20 widgets | Ensures fast loading times |
| Third-party connector cost | ~$200/month | Facebook, LinkedIn, TikTok, etc. |
| Monthly reporting hours | ~4–6 hours/client | Includes QA, writing, revisions |
| Tracking system | Google Sheet or portal | Links, refresh status, permissions |
The First Cracks: Growing Pains at 10-20 Clients
Once you hit 10 to 20 clients, things can get messy fast, especially when:
- Multiple team members or clients access reports simultaneously
- Reports require real-time updates
- You blend data from three or more sources in a single report
- Reports feature more than 20 complex widgets
Agencies handle this by continuing to create separate reports for each client while streamlining processes behind the scenes. They standardize KPI setups and templates, then offload heavy calculations to BigQuery or Google Sheets so the reports don’t have to process complex datasets on their own. Most also use monitoring tools to catch data connector problems before clients notice.
At this point, it’s getting harder to keep track of client reporting in your trusty old Google spreadsheet. Errors, mistakes, and confusion start to take up team members’ valuable time.
Example scenario: A boutique agency hit 18 clients last quarter. Their ops lead spent 12+ hours per week fixing spreadsheet errors — updating one report often broke three others. After weeks of delays and lost access issues, they hired a part-time contractor just to manage reporting logistics. The spreadsheet had become technical debt, costing time and headcount.
| Monthly Time and Cost Breakdown by Client Count | |||
|---|---|---|---|
| Client Count | Monthly Reporting Time | Avg Connector Cost | Usage Profile |
| 5 clients | ~25 hours | $200/month | Basic reports, 2–3 platforms |
| 15 clients | ~40–60 hours | $300–$500/month | Higher refresh rates, blended data |
| 25 clients | ~85–100 hours | $600–$800/month | More platforms, larger datasets |
Connector costs jump as well, from around $300 to $500 monthly, because you need more data sources and faster refreshes. At this price point, most agencies start charging clients extra for reporting to manage the costs.
The Breaking Point: When 30+ Clients Overwhelm Looker Studio
Once your agency crosses the 30-client mark, precision and efficiency become non-negotiable. You need tight data setup, standardized templates, and clear rules about what custom changes you’ll allow for each client. Most agencies:
- Lock down their data sources with standardized schemas
- Cache data instead of relying on live refreshes
- Offload processing to BigQuery or another warehouse, where you pre-aggregate metrics before syncing them with Looker Studio
But this is where Looker Studio starts to show strain. You’ll see more errors and slower performance when:
- Multiple team members share the same Google account access
- You rely on a wide range of third-party data connectors
- Reports refresh frequently but you’re still operating on the default API quotas
Example scenario: A mid-sized agency managing 42 clients across 6 marketing platforms saw connector fees climb to $3,800/month. That didn’t include the dev hours spent chasing quota errors during campaign launches or rebuilding charts that broke without warning.
Connector costs alone can reach $1,000 to $5,000+ monthly, depending on platform count, data refresh frequency, and volume. You’re not paying for Looker licenses — but between performance bottlenecks, connector limits, and the hours lost to maintenance, the total cost becomes substantial.
At this scale, many agencies hit their breaking point. The time and money spent just to keep Looker working might start to outweigh the value it delivers, and most teams start searching for a purpose-built alternative.
| Looker Studio Costs and Challenges at Scale | ||||
|---|---|---|---|---|
| Client Count | Monthly Connector Cost Range | Key Cost Drivers | Common Performance Challenges | Workflow Pain Points |
| 30–40 | $1,000–$3,000 | 8–12 connectors, increased refresh rates, complex blends | Reports take 1–3 minutes to load, frequent API quota limits | Frequent manual fixes, slow template updates, access control issues |
| 40–50 | $3,000–$5,000 | 12–15 connectors, real-time refresh demand, multi-source blending | Reports often time out or fail, daily sync errors | Need for dedicated reporting manager, delayed client delivery |
| 50+ | $5,000+ | 15+ connectors, daily or more frequent refresh, BigQuery integration | Reports crash regularly, dashboard lag over 5 minutes | Heavy manual troubleshooting, scaling workflows is near impossible |
The once-simple client tracking spreadsheet is now a full-blown headache. You’re juggling permissions for 30+ clients, chasing connector failures that ripple through multiple accounts, hitting daily API limits and fixing dashboards that break half their links at once. It quickly becomes a full-time job just keeping everything updated. Most agencies realize too late they need a proper CRM system — not the same old Google Sheets — to manage it all.

Why Looker Studio Hits a Performance Plateau at Scale
Looker Studio has hard limits that create real pain for agencies managing lots of clients. These bottlenecks don’t just slow things down. They burn time, frustrate clients, and force you into workaround mode.
Performance bottlenecks
- Struggles with datasets over 5,000 rows
- Large client accounts with long historical timelines often hit query limits or timeouts, causing reports to partially render, break, or skip older date ranges
Data blending cap
- Max of 5 sources per blended chart
- Limits your ability to combine key channels (GA4, Google Ads, Facebook, TikTok, CRM) in a single view — forcing complex workarounds or fragmented visuals
GA4 API quota limits
- 200,000 tokens per day per GA4 property
- Once you hit quota, reports stop loading data, resulting in empty charts, especially during peak usage or frequent refreshes
Chart/widget constraints
- Maximum of 50 charts per page
- Makes it difficult to build dense executive dashboards or comprehensive campaign views without splitting across tabs
Page limits
- Capped at 20 pages per report
- Not enough space for agencies managing multi-brand, multi-channel, or full-funnel reporting in a single doc
Refresh delays
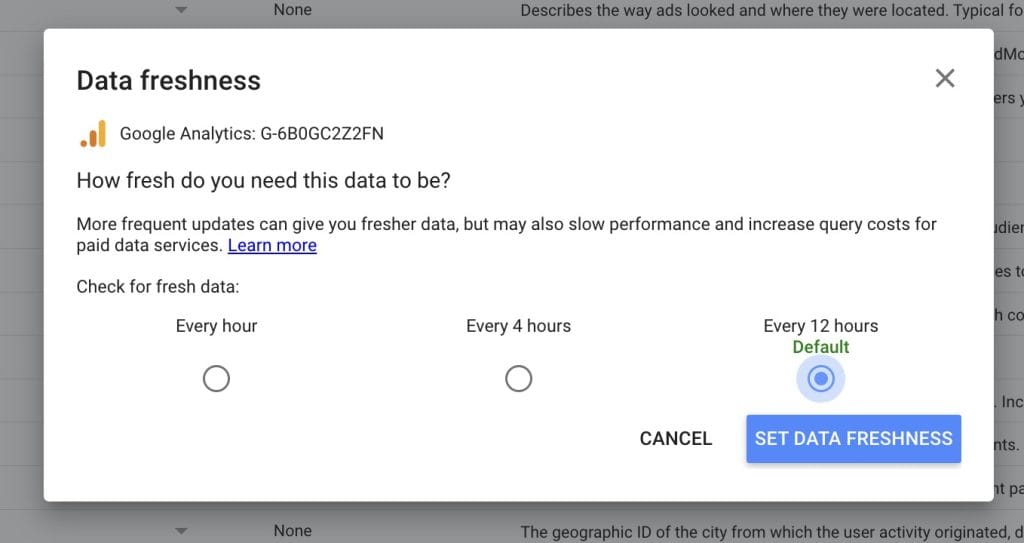
- Free connectors refresh every 12 hours; paid tiers refresh hourly
- Still falls short for clients expecting near real-time data, especially during active campaigns or ad launches
We’ve broken down Looker Studio’s performance limits, refresh issues, and quota issues on our blog — so if you’re seeing some of these headaches, you’re not alone. Take a look at those guides before you commit long-term.
Is Looker Studio Really Free?
Looker Studio says it’s free, but that’s not really the whole story if you’re running a marketing agency. Once you start juggling multiple clients, you’ll quickly find yourself dealing with hidden costs that hit both your time and your agency’s wallet. Here are the usual extra costs hidden in the free version:
| Hidden Costs of Looker Studio’s Free Version | ||
|---|---|---|
| Cost Category | Description | Estimated Cost (Type) |
| Third-party connectors | Required to connect non-Google platforms like Facebook Ads, Shopify, HubSpot | $30–$800/month (per agency) |
| Development overhead | Custom dashboards take 2–4x longer to build without team/workflow tools | Adds 10–40+ hrs/month (labor) |
| Lost productivity | Reports load slowly, error out, or crash at high volumes | Adds 20+ hrs/month (labor) |
| Data warehouse | Used to pre-aggregate large datasets (via BigQuery, Sheets, or ETL tools) | $100–$500/month (platform) |
| Manual report QA | Time spent checking charts, fixing filters, updating access manually | Adds 5–15 hrs/month (labor) |
| Scaling limitations | Can’t white-label, automate sharing, or manage permissions cleanly | Cost in lost time or churn (qualitative) |
Looker Studio may be “free,” but at 30 to 50+ clients, the hidden costs stack up fast. You’re paying for connectors, developer hours, BigQuery setup, and lost time fixing broken reports. Add it all up, and the real cost lands somewhere between $3,800 and $11,400 per month.
Check out our complete breakdown of Looker Studio pricing to see what you’ll actually pay when scaling your marketing agency, including hidden connector costs that most agencies don’t see coming.
How to Build Scalable Reporting Workflows That Scale Beyond Looker Studio’s Limits
Manual reporting doesn’t scale. Once your agency crosses 10 clients, you need automation, templating, and a source-of-truth system that keeps every team member aligned. Here’s how to structure Looker Studio for efficiency — and avoid the common traps that stall growing agencies.
Standardize Templates
Start by creating reusable templates for your core services — SEO, paid media, email, social, lifecycle. Templates save hours per client and create visual consistency that scales. Each one should include:
Structure
- Layouts with locked sections for headers, KPIs, and charts
- Visual hierarchy that mirrors campaign goals (top → bottom funnel)
Data foundations
- Pre-connected data sources with valid credentials
- Pre-set filters and date range controls
Naming and style
- Consistent naming conventions (e.g., SEO_Traffic_YOY)
- On-brand colors, fonts, and logos
- Conditional formatting for standout metrics
Optimize Performance
When you’re juggling dozens of client reports, slow dashboards aren’t just annoying — they’re a time sink. Build for speed from the start:
Limit your data size
- Keep row counts under 5,000 per source
- Avoid pulling multi-million-row tables from GA4 or CRMs
- Pre-aggregate large datasets in BigQuery before sending them to Looker
Simplify your data blends
- Stick to 2–3 blended sources per page
Only blend what’s essential for insight — skip vanity joins - Move complex calculations outside Looker Studio when possible
Break up your report pages
- Split reports by campaign, channel, or funnel stage
- Keep each page under 25 widgets to speed up load times
- Use summary pages for high-level KPIs, with drilldowns in separate tabs
Collaborate With Teams
One missed report deadline. One overwritten dashboard. That’s all it takes to shake a client’s trust — or worse, lose them. Without clear documentation and file systems, growing teams create chaos. Here’s how to prevent it:
Build a shared resource hub
- Store templates, connector credentials, and brand assets in a central location like Google Drive, Notion, or Looker Studio Pro folders
- Grant role-based access so team members can edit or view as needed
- Include QA checklists and SOPs for consistent report setup and delivery
Standardize naming conventions
- Use a consistent format like Client_Channel_ReportType_YYYYMMDD
- Avoid version chaos (e.g., “Final_v3_ACTUAL_final_FINAL.pdf”)
- Apply naming rules to reports, dashboards, folders, and templates
Track and version your reports
- Use Looker Studio Pro’s built-in version control or track changes manually
- Add changelogs or update notes for every revision
- Make rollback easy if an update breaks the report
Run Quality Checks
Clients don’t just see the final report — they judge your agency by it. A single broken chart undermines months of work. Build a quality assurance system that catches every flaw before your client does.
To build a complete QA checklist, cover these areas:
Verify data accuracy
- Cross-check KPIs and breakdowns against original sources (e.g., GA4, Meta Ads Manager, LinkedIn Ads)
- Spot-check metrics at the widget level to ensure numbers align
- confirm that filters or segmentations aren’t skewing the data
Test load performance
- Identify any slow-loading widgets or full-page lags
- Watch for “data set configuration errors” or timeout messages
- Reduce widget count or row limits where necessary
Review visual and brand consistency
- Make sure logos, fonts, colors, and tone match the client’s branding
- Confirm visual hierarchy flows from high-level KPIs down to granular details
- Check spacing and alignment across devices
Validate blends and calculated fields
- Test all blended data sources and custom metrics
- Click through dropdown filters, date pickers, and toggles to ensure they work
- Look for broken fields or mismatched dimensions across joins
Pro Tips to Streamline Agency Processes at Scale
Even with Looker Studio’s quirks and constraints, you can still optimize for speed, reliability, and scale. These advanced techniques help agencies keep performance high — even as client loads hit 50 or more.
BigQuery Preprocessing Techniques
Don’t let Looker Studio do all the work. Push your processing upstream into BigQuery — Google’s cloud data warehouse — so reports stay fast and flexible at scale.
- Use scheduled queries to pre-aggregate data by date, campaign, or platform
- Create views or tables for frequently used metrics
- Pre-clean dimensions (like UTM values or device types) so reports stay simple and fast
Schedule Data Refreshes
Hourly refreshes might sound efficient, but they often waste resources and increase API usage without adding value. For most clients, once or twice daily is more than enough.
- Schedule data refreshes during off-peak times, like early mornings or weekends
- Group lower-priority clients under slower update frequencies (daily or weekly)
- Prioritize real-time data only for time-sensitive campaigns to avoid connector throttling
| Data Refresh Frequency by Client Use Case | ||
|---|---|---|
| Client Type | Client Need | Recommended Frequency |
| eCommerce (high volume) | Track live sales | Hourly |
| B2B lead generation | Measure campaign trends | Daily |
| Content marketing | Monitor traffic growth | Weekly |
| SEO reporting | Check ranking progress | Weekly or Monthly |
API Quota Management
Third-party APIs like GA4 have quotas, for example, 200,000 tokens per day per property. To avoid hitting the limits:
- Reduce widget duplication across reports to limit token usage
- Avoid unnecessary filters or comparisons that create new API requests
- Use fields from BigQuery, where possible, to bypass quota consumption
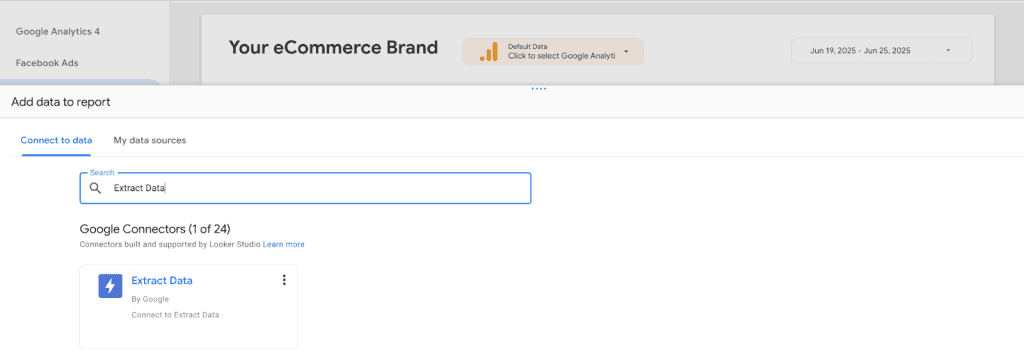
Use Extract Data Connector
Use the Extract Data connector to cache a fixed dataset for each report load. You decide which fields and date ranges matter — nothing extra. This turns 2‑minute refreshes into lightning‑fast loads. Ideal for monthly or weekly performance reports.

- Use the Extract Data connector to cache fixed datasets for faster loading
- Pre-define only the fields and date ranges you actually need
- Apply to high-volume reports that don’t require real-time updates
- Pair with scheduled refreshes to automate recurring data pulls
How to Know When Your Agency Has Outgrown Looker Studio
Looker Studio holds up fine for agencies with fewer than 15–20 clients. But once you pass that threshold, it starts breaking down: slower load times, unreliable automation, and manual work that drains hours. That’s when the hidden costs kick in and it’s time to reevaluate.
Performance is Dragging Down Your Workflow
You’ve likely outgrown Looker Studio when:
- Reports crash or stall during client reviews
- Clients complain about dashboards not loading
- You spend hours troubleshooting instead of building
- You find yourself apologizing for “slow” or “loading” reports
Advanced Clients Need More Than Looker Offers
High-tier clients often expect features Looker Studio doesn’t support, like:
- Statistical modeling or predictive metrics
- Advanced filtering and conditional logic
- Custom-coded visuals and scripting
- Multi-language dashboard support
- Unified views across multiple ad platforms
When your clients start asking for these — and you’re stuck saying no — it’s time to upgrade.
White-Labeling Isn’t Truly White-Labeled
Even with Looker Studio Pro, you can’t remove all Google branding. That’s a problem when:
- You charge premium retainers and want a branded experience
- You want to host reports on your own domain
- Clients expect full white-label delivery
If your reports still look like they came from a free Google tool, that undercuts your value.
You’re Managing 50+ Clients
At this scale, Looker Studio’s manual overhead becomes a full-time burden. The platform lacks the team management, scalable templates, and automated report delivery you need to support dozens of clients without burning out your team — and a lot of users find these limitations frustrating.
The breaking point usually comes when:
- Senior strategists are stuck doing manual copy-paste work
- A single data source change requires editing 50+ charts across client dashboards
- A connector update crashes half your reports — and no one notices until a client does
Example scenario: A digital marketing agency had 10 internal teams spending over 150 hours a month updating 300+ charts manually whenever sources changed. One small connector update broke 10 dashboards at once. Eventually, they licensed an agency-grade business intelligence platform just to keep up.
You’re Paying More Without Getting More
At scale, Looker Studio’s “free” label starts to disappear fast. Between connector subscriptions, developer workarounds, BigQuery usage, and optional Pro features, costs climb quickly — without unlocking true enterprise-grade power.
You know you’ve hit this threshold when:
- Third-party connector fees match or exceed your CRM or BI subscriptions
- Your BigQuery bill grows month after month, just to keep reports running
- You’re considering hiring someone just to manage Looker setup and troubleshooting
With 30 to 50+ clients, and all the add-ons and extra work that come along with that scale, the real cost of even the free version lands somewhere between $3,800 and $11,400 per month.
When to Switch: Try Power BI
Power BI is a strong upgrade once you outgrow Looker Studio’s limitations. It handles large datasets without slowing down and offers advanced modeling tools, custom branding, and scalable governance.
Why Power BI works for agencies:
- Stronger data modeling: Define true relationships between data tables, even across massive datasets. Ideal for building client dashboards with multi-source logic that holds together.
- Smarter calculations: Use Copilot to write DAX formulas for you. It understands natural language and custom dimensions, and can surface answers with context, not just metrics.
- Better performance: Dashboards remain fast and responsive — even with millions of rows — thanks to semantic models and mobile-optimized layouts.
- Full white-labeling: Deploy your own URL, add custom fonts, colors, and client-specific themes — no more Looker branding on premium reports.
- Enterprise-grade controls: Power BI includes built-in governance, audit logs, access controls, and client-facing Copilot AI, so your reports scale cleanly with growth.
Try Tableau When You Need High-Impact Visuals
Tableau shines when polished visuals and interactivity are non-negotiable, especially for clients who expect dashboards to double as presentations.
Why Tableau works for agencies:
- Tell a visual story: Create fully interactive dashboards with drill-downs, hover effects, and animations that wow even non-technical stakeholders. Tableau’s visual engine goes far beyond Looker Studio’s basic charts.
- Present in real time: Built-in session recovery and offline interactivity keep dashboards running smoothly during pitches and demos — even without a stable internet connection.
- Run advanced analysis: Access built-in predictive modeling, AI/ML features, and advanced statistical tools to dig deeper into campaign results and customer behavior.
- Scale your reporting across teams and clients: Add or remove user licenses as your agency grows without compromising speed, data integrity, or report quality — ideal for teams that need flexible access and centralized management.
- Make the investment count: At $115 per user/month, Tableau isn’t cheap — but the time it saves and the impressions it creates often justify the cost for premium or enterprise clients.
Use Swydo When You Want a Purpose-Built Agency Platform
Swydo, an automated marketing reporting software was built specifically for marketing agencies — not for internal enterprise teams or BI engineers. It solves the real pain points that come with managing dozens of clients, streamlining reporting and client management from a single interface.
Why Swydo works for agencies:
- Automate your marketing reports: Build custom reports and schedule them to send daily, weekly, or monthly with zero manual effort. No more copy-paste or rebuilds every reporting cycle.
- Work inside an agency-first platform: Use simple workflows that are tailored for account managers. Balance deep customization with easy setup, so you can spend more time optimizing performance, not formatting charts.
- Brand everything, top to bottom: Send personalized email reports and fully white-label the platform, from logos and colors to URLs and report footers. No ‘powered by’ messages in sight.
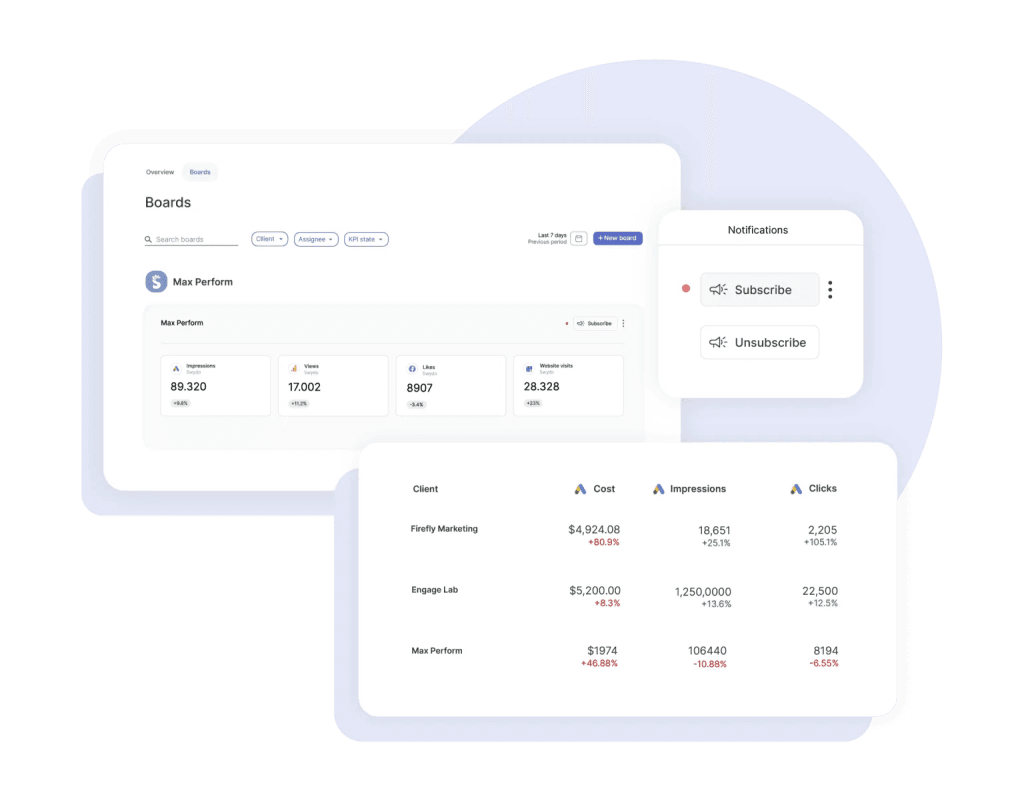
- Monitor clients from one dashboard: Use Monitor Overview KPI boards and alerts to spot issues fast, so you can proactively reach out before clients do.
- Pay one flat rate: Get unlimited users, clients, and reports starting at $69/month — predictable pricing with no surprise add-ons.
Swydo vs Looker Studio: Which is Best?
| Reporting Scalability and Pricing Comparison | ||
|---|---|---|
| Platform | Scalability of Reporting | Price Range (Monthly) |
| Looker Studio (free) | Struggles after 20 to 30 clients; limited API quotas, connector reliance, no true automation | $0 for core platform, but ~$300–$2,000+ in hidden costs (connectors, BigQuery, dev time) |
| Power BI | Highly scalable; supports millions of rows, built-in modeling, strong performance under load | $10–$20/user (Pro); $100–$300+ for storage, connectors, enterprise plans |
| Tableau | Enterprise-grade performance; handles large, complex dashboards with interactivity at scale | ~$115/user (Creator); Viewer/Explorer plans cheaper, but limits apply |
| Swydo | Designed for scaling agency reports; built-in automation, unlimited clients, no performance drag | $69/month (flat); includes unlimited users, clients, and reports |
Scaling Pitfalls That Kill Agency Growth
Scaling reporting isn’t just about adding templates. Without strategy, performance degrades, costs balloon, and trust evaporates. Avoid these classic agency missteps:
Look Closer at the ‘Free’ Version
What starts as a “free” tool can quickly hit your budget hard once your client base starts growing.
Connector costs sneak up on you — most agencies don’t plan for third-party data connector fees, which can easily top $1,000/month once you’re handling 30 to 50 clients. And don’t get us started on the cost of manual report building and data analysis.
Do your homework — figure out data connector pricing, estimate how long each client setup actually takes, and plan for the extra team members you’ll need before you scale up.
Watch for Load Time Red Flags
Slow dashboards cost you time and credibility. Catch issues early and keep things fast with regular checks.
Red flags to watch:
- Reports that take longer than 60 seconds to loa
- “Resource unavailable” or “data set configuration” error messages
- Charts that fail to render or time out
What usually causes it:
- Too many blended data sources per page
- Datasets that exceed 5,000 rows
- Overloaded pages with 50+ charts
How to prevent it:
- Set load time benchmarks at project kickoff
- Run monthly speed tests on live dashboards
- Stick to performance design rules: max 50 charts per page, 5,000 rows per data source
| Looker Studio Performance Thresholds | ||
|---|---|---|
| Metric | Limit | Why It Matters |
| Page load time | ≤5 seconds | Clients bounce after a few seconds |
| Rows per data source | ≤5,000 rows | Prevents timeouts and lag |
| Widgets per page | ≤25 widgets | Keeps dashboards responsive |
| Blended sources per page | ≤3 sources | Reduces API and authorization errors |
Check Security Settings to Protect Client Data
A single misstep with permissions can expose sensitive client info. Don’t let one client see another’s data.
Best practices:
- Assign Viewer and Editor roles correctly — limit Editor access to trusted team members
- Never share login credentials across clients
- Use Looker Studio Pro or Google Workspace for granular collaboration controls
- Consider platforms like Swydo with built-in client-level sharing options
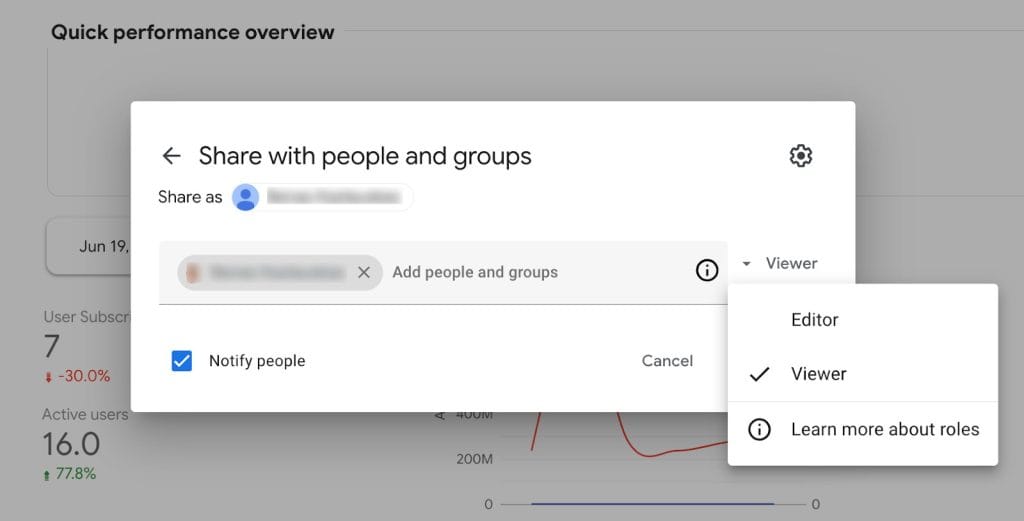
How to adjust permissions in Looker Studio:
- Open the report in Looker Studio
- Click the Share button or person icon
- Find the email or group you want to modify
- Use the dropdown to switch between Viewer or Editor access
- Click Done to save changes
Your Scaling Decision Point: Stay or Switch?
Looker Studio delivers as a free solution — until client volume and complexity grow. Around 15–20 clients, hidden connector fees and maintenance time become visible. Beyond 30, dashboard upkeep dominates. Do the math on your hours, connector bills, and productivity. If fixing dashboards outweighs building them, it’s time to upgrade to a purpose-built reporting platform.
When to consider switching from Looker Studio
- Under 15 clients: Clean up your Looker Studio setup with standard templates and solid QA checks. This is your chance to build a lean, scalable system before complexity sets in.
- 15–30 clients: If you’re drowning in maintenance work or clients are complaining about sluggish reports, it’s time to audit your bottlenecks. Evaluate tools like Power BI or Swydo that offer more automation and control.
- 30+ clients: At this scale, manual fixes and one-off workarounds become unsustainable. You’re likely spending more in time and labor than you would on a platform that’s built to handle agency-level workflows. Switch to a solution that can grow with you.
Don’t wait for burnout to force your hand. Audit your current setup, calculate the real costs, and choose a reporting platform that scales with your agency, not against it. If you’re ready to test the waters, Swydo offers a 14-day free trial so you can explore whether it’s the right fit for your workflow.
Looker Studio Scaling FAQ
Quick answers to common questions about scaling Looker Studio for agencies
Looker Studio works well for 5-10 clients. Performance starts degrading at 10-15 clients, and becomes problematic beyond 20 clients. Most agencies experience significant issues at 30+ clients due to slow loading, frequent errors, and maintenance overhead.
Looker Studio slows down due to API quota limits (200,000 tokens/day for GA4), processing limitations with datasets over 5,000 rows, and performance issues when blending multiple data sources. Each additional client adds to these constraints.
Key limits include: 5,000 rows per dataset before slowdowns, maximum 5 data sources per blended chart, 50 charts per page, 20 pages per report, and 12-hour refresh intervals for free connectors (1-hour for paid).
Reports typically crash when datasets exceed 5,000 rows, pages have more than 25 widgets, or when hitting API quotas during peak usage. This commonly occurs at 15+ clients with complex dashboards and frequent data refreshes.
No. Looker Studio’s minimum refresh is 1 hour (paid connectors) or 12 hours (free). Real-time data isn’t supported, and frequent refreshes quickly exhaust API quotas when managing multiple clients.
No. While the platform is free, agencies pay for third-party connectors ($200-$5,000+ monthly), BigQuery usage, development time for workarounds, and maintenance overhead. Total costs at scale often exceed dedicated agency platforms.
Third-party connectors range from $30-$200 per month for basic plans. At scale (30+ clients), connector costs typically reach $1,000-$5,000 monthly for platforms like Facebook, LinkedIn, TikTok, and CRM systems.
Total monthly costs range from $3,800-$11,400 including connectors, BigQuery, development time, and maintenance overhead. This often exceeds purpose-built agency platforms that include unlimited users and reports.
Maintenance scales from 4-6 hours monthly per client at small scale to 8-12 hours at medium scale. Beyond 30 clients, many agencies need full-time staff (40+ hours weekly) just for report maintenance and troubleshooting.
No. Looker Studio Pro adds collaboration features and version control but doesn’t address core performance limitations, API quotas, or connector costs. The fundamental scalability issues remain unchanged.
Keep datasets under 5,000 rows, limit pages to 25 widgets maximum, use Extract Data connector for static data, pre-aggregate large datasets in BigQuery, and schedule refreshes during off-peak hours.
Yes, for agencies with 15+ clients. BigQuery allows pre-processing and aggregating data before sending to Looker Studio, improving performance and bypassing some API limits. Expect $100-$500 monthly in BigQuery costs.
Extract Data connector creates cached snapshots of your data, dramatically improving load times. Use it for historical reports, monthly summaries, or any dashboard that doesn’t need real-time updates. Ideal for executive reports.
Schedule refreshes during off-peak hours, use daily/weekly refreshes instead of hourly, avoid duplicate widgets, prioritize real-time data only for active campaigns, and monitor usage through Google Cloud Console.
Limited automation is possible through standardized templates and Google Apps Script, but Looker Studio lacks true automation features like scheduled email delivery, automated client onboarding, or bulk report updates found in agency-specific platforms.
Even with Looker Studio Pro, you cannot fully remove Google branding or host on custom domains. You can add logos and brand colors, but “powered by Google” remains visible. True white-labeling requires alternative platforms.
Switch when reports consistently take over 60 seconds to load, you spend more time fixing than building dashboards, clients complain about performance, or connector costs exceed $1,000 monthly. This typically occurs at 15-20 clients.
Depends on needs: Power BI ($10-$20/user) for advanced analytics, Tableau ($115/user) for premium visuals, or Swydo ($69/month flat) for agency-specific features with unlimited users and clients. Swydo offers the most predictable pricing.
Plan 2-4 weeks for migration setup and 1-2 hours per client report for rebuilding (reports must be recreated from scratch). Most agencies migrate gradually over 2-3 months, starting with pilot clients before full transition.
No. Looker Studio doesn’t export to other platforms. All reports must be rebuilt from scratch during migration. However, data sources and connections can often be reused in new platforms.
Yes, for scaling. Power BI handles large datasets efficiently, offers true white-labeling, includes advanced modeling capabilities, and provides predictable per-user pricing. It’s better for agencies with 20+ clients or complex data requirements.
You’ll lose the free core platform (though hidden costs often exceed alternatives), tight Google Workspace integration, and the familiar Google interface. However, you gain better performance, automation, true white-labeling, and dedicated support.
Yes, for agencies with under 10 clients and simple reporting needs. Looker Studio works well at small scale. However, plan your exit strategy early and monitor performance closely as you approach 15+ clients.
Ready to scale your agency reporting beyond Looker Studio’s limits?
Start Your Free Trial Today