
Your client’s Shopify dashboard shows record sales. But their bank account tells a different story. You’ve seen this before, right?
Revenue goes up. Profit goes down. The client gets confused. And you’re stuck there, left to explain why great-looking numbers didn’t translate to money in the bank.
The problem is that most ecommerce reports focus on the wrong metrics. Platform ROAS, total revenue, conversion rate in isolation. These numbers look great in decks but they don’t tell you whether the business is actually healthy. They measure activity, not outcomes.
This guide covers the metrics that separate profitable ecommerce businesses from ones that bleed cash while celebrating vanity wins. We’ll break down ten metrics across three categories: profitability metrics that show whether you’re actually making money, customer economics that reveal whether your growth is sustainable, and performance metrics that guide your day-to-day optimization. For each one, you’ll get the formula, benchmarks, and context on why it matters.
The Top Ecommerce Metrics That Actually Matter
A complete guide to measuring true performance beyond vanity metrics
Why It Matters Contribution margin measures what’s left after you subtract all variable costs tied to a sale. This includes product cost, shipping, returns, ad spend, platform fees, and transaction fees. It tells you how much each sale actually contributes to cover your fixed costs and generate profit.
What It Reveals Gross margin and ROAS lie by omission. A 4x ROAS looks great until you factor in the 35% return rate, the 12% shipping costs, and the 20% discount code most customers used. When you do the full math, that “profitable” campaign might barely break even.
Contribution Margin = Net Revenue – COGS – Shipping – Returns – Ad Spend – Platform Fees – Transaction Fees
Express this as a percentage by dividing by net revenue.
- Under 10% – Dangerous territory where you barely cover variable costs
- 15-25% – Where most successful ecommerce brands operate
- Above 25% – Strong unit economics with room to invest in growth
Key Insight Calculate contribution margin at the SKU level and patterns emerge that ROAS hides completely. Your client’s best-seller might have a negative contribution margin because of its high return rate. Meanwhile, a product that sells half as much could deliver 35% margins because customers keep it and it sells without heavy discounts.
Conjura provides SKU-level profit analysis with connections to Shopify, Amazon, and ad platforms. TrueProfit offers simpler tracking for Shopify. Lifetimely combines profit tracking with cohort analysis.
Why It Matters Average order value measures the typical amount spent per transaction. AOV has an outsized impact on profitability because of how fixed costs work. Every order has costs that stay roughly the same regardless of order size: picking, packing, customer service time, payment processing minimums.
What It Reveals When a customer spends $50, those fixed costs eat a larger percentage than when they spend $100. Higher AOV spreads fixed costs across more revenue. AOV is also one of the easiest metrics to improve. A 10% increase drops straight to the bottom line without additional acquisition cost.
AOV = Total Revenue / Number of Orders
Best For Track AOV by channel, by customer type (new vs returning), and by device. Each view reveals different optimization opportunities.
Common Tactics to Increase AOV Free shipping thresholds set 15-25% above current average, product bundles with modest discounts, and relevant cross-sell recommendations at checkout.
Why It Matters Customer lifetime value represents the total revenue a customer generates over their entire relationship with the brand. This includes their first purchase plus all repeat purchases over time. CLV determines how much you can afford to spend on acquisition.
What It Reveals A brand with $50 CLV can’t compete with one that has $200 CLV when bidding on the same keywords. The higher your CLV, the more you can invest in acquisition while staying profitable.
CLV = Average Order Value × Purchase Frequency × Customer Lifespan
Better Approach: Cohort-based tracking. Track actual revenue generated by customers acquired in a specific month over 12, 24, and 36 months. This uses real data rather than assumptions and shows you how CLV changes over time.
- Subscription businesses: $500+
- Fashion brands: $150-300
Klaviyo provides predicted CLV, churn risk, and expected next order dates. You need 500+ customers and 180 days of history for predictions. Triple Whale offers cohort analysis alongside attribution.
Why It Matters CAC measures the total cost to acquire a new customer. Most brands calculate this too low because they only count ad spend and ignore everything else that goes into acquisition.
What It Reveals True CAC includes ad spend, agency fees, creative production, attribution software subscriptions, and the portion of marketing payroll dedicated to acquisition. When you add it all up, true CAC is usually 30-50% higher than what brands report to their boards.
True CAC = (Ad Spend + Agency Fees + Creative Costs + Software + Marketing Payroll) / New Customers Acquired
Calculate by Channel Facebook might deliver a $40 CAC while Google delivers $60. But if Google customers have 50% higher CLV, that $60 CAC might actually be the better investment.
For attribution, Triple Whale dominates DTC with multi-touch models. Northbeam serves larger advertisers with media mix models and incrementality.
Why It Matters This ratio compares how much a customer is worth to how much it costs to acquire them. A 3:1 ratio means for every $1 spent on acquisition, you get $3 back in customer value over time. This single number tells you whether your unit economics work.
What It Reveals Below 1:1, you lose money on every customer. At 1:1, you break even but have nothing left for fixed costs or profit. At 3:1 or higher, you have healthy economics that support sustainable growth.
| CLV to CAC Ratio | What It Means |
|---|---|
| Below 1:1 | You lose money on every customer. Stop acquisition until you fix the economics. |
| 1:1 to 2:1 | Break-even territory. Focus on retention or lower CAC before you scale. |
| 3:1 | Healthy baseline. Most sustainable ecommerce brands operate here. |
| 4:1 to 5:1 | Strong economics. You can likely afford to scale acquisition. |
| Above 5:1 | You may underinvest in growth. Test higher spend levels. |
Why It Matters Even when CLV exceeds CAC with a healthy margin, cash flow can kill you if payback takes too long. CAC payback period measures how many months it takes to recover the cost of acquisition through customer revenue.
The Cash Flow Problem You spend $100 to acquire a customer worth $300. Great ratio. But if that $300 comes over 18 months while you paid the $100 upfront, you need significant capital to fund the gap. Multiply across thousands of customers and you can grow yourself into bankruptcy.
CAC Payback Period (months) = CAC / (Monthly Revenue per Customer × Gross Margin %)
- Under 6 months – Room to scale aggressively because you can reinvest quickly
- 6-12 months – Works with adequate working capital
- Beyond 12 months – Requires patient investors or revenue-based financing to bridge the gap
Why It Matters Repeat purchase rate measures the percentage of customers who buy more than once. A 30% repeat rate means 30 out of every 100 first-time buyers come back for a second purchase. This metric reveals product and experience quality.
What It Reveals When customers don’t come back, something is wrong. Either the product didn’t meet expectations, the experience was poor, or competitors offer something better. Strong repeat rates indicate you’ve earned trust.
Repeat Purchase Rate = (Customers with 2+ Orders / Total Customers) × 100
Important Note Track this over consistent time windows. Benchmarks vary by category:
| Category | Typical Repeat Rate (12 months) |
|---|---|
| General Ecommerce | 20-30% |
| Subscription/Consumables | 40-50% |
| Fashion & Apparel | 15-25% |
| Beauty & Personal Care | 30-40% |
| Home & Furniture | 10-20% |
Why It Matters This measures what percentage of revenue comes from first-time buyers versus returning customers. A 60/40 split means 60% of revenue comes from new customers and 40% from repeat buyers.
What It Reveals The ratio reveals business maturity and retention health. Early-stage brands naturally skew toward new customer revenue because they’re still building a customer base. Mature brands should generate most revenue from existing customers because that revenue is more profitable and predictable.
Warning Sign When the split stays heavily weighted toward new customers year after year, something is wrong. Either retention efforts fail, the product doesn’t encourage repeat purchases, or heavy discounting attracts deal-seekers who never buy at full price.
| Business Stage | New Customer Revenue | Repeat Customer Revenue |
|---|---|---|
| Year 1-2 (Early) | 70-80% | 20-30% |
| Year 2-4 (Growth) | 50-60% | 40-50% |
| Year 4+ (Mature) | 30-40% | 60-70% |
Key Insight Track this ratio over time. When the percentage from new customers keeps increasing quarter over quarter, that signals retention problems even if total revenue grows.
Why It Matters Conversion rate measures the percentage of visitors who complete a purchase. A 3% conversion rate means 3 out of every 100 visitors buy something. Higher conversion means more sales from the same ad spend.
What It Reveals Even small improvements have significant impact. Move from 2% to 2.5% conversion and you’ve increased revenue 25% without spending more on acquisition.
Important Context Conversion rate is only meaningful in context. A 5% conversion rate from email subscribers is different from a 1% rate from cold Facebook traffic. Track conversion by source:
| Traffic Source | Typical Conversion Rate | Strong Performance |
|---|---|---|
| 4-5% | 7%+ | |
| Paid Search (Brand) | 6-8% | 12%+ |
| Paid Search (Non-Brand) | 1.5-2.5% | 4%+ |
| Paid Social | 1-2% | 3%+ |
| Organic Search | 2-3% | 4%+ |
Caution Optimizing conversion rate at the expense of contribution margin is a losing game. A 0.5% improvement in conversion rate means nothing if it comes from discounts that destroy your margins.
Why It Matters Cart abandonment measures the percentage of shoppers who add items to their cart but leave without completing the purchase. These are people who showed strong purchase intent and then stopped.
The Reality According to Baymard Institute’s analysis of 50 studies, the average cart abandonment rate is 70.22%. Mobile runs higher at 77-80%. That means roughly 7 out of 10 potential sales never complete.
Important Nuance Not all abandonment is bad. Baymard found that 43% of shoppers who abandon carts were “just browsing” with no purchase intent. They use carts for price comparison or wishlists. Recovery efforts aimed at these people waste resources.
- Extra costs too high (shipping, taxes, fees) – 48%
- Required to create an account – 26%
- Delivery too slow – 23%
- Didn’t trust site with payment info – 22%
- Checkout process too complicated – 18%
Recovery Strategy Focus recovery on high-margin, high-value abandoners. A $500 cart with 40% contribution margin deserves aggressive recovery. A $30 cart at 10% margin might not justify the email and SMS costs.
Source: Baymard Institute (analysis of 50 studies)
Profitability Metrics That Show If You’re Actually Making Money
Most ecommerce reporting stops at revenue. But revenue without profit is just expensive activity. A brand can double its sales and go bankrupt at the same time if the unit economics don’t work.
The metrics in this section answer a simple question: when a customer buys something, do you actually make money on that transaction? You’d be surprised how many brands can’t answer this with confidence. They know their gross margin on paper, but they don’t account for returns, shipping costs, discounts, and ad spend at the order level. These profitability metrics fix that blind spot. campaigns influence 60% of email conversions.
Contribution Margin
Contribution margin measures what’s left after you subtract all variable costs tied to a sale. This includes product cost, shipping, returns, ad spend, platform fees, and transaction fees. It tells you how much each sale actually contributes to cover your fixed costs and generate profit.
Why does this matter more than gross margin or ROAS? Because those metrics lie by omission. A 4x ROAS looks great until you factor in the 35% return rate, the 12% shipping costs, and the 20% discount code most customers used. When you do the full math, that “profitable” campaign might barely break even.
Calculate contribution margin at the SKU level and patterns emerge that ROAS hides completely. Your client’s best-seller might have a negative contribution margin because of its high return rate. Meanwhile, a product that sells half as much could deliver 35% margins because customers keep it and it sells without heavy discounts.
The formula:
The Contribution Margin
Why a $100 sale isn’t $100 in your pocket
The reality: That “4x ROAS” campaign? After all variable costs, you’re keeping 22 cents on every dollar. This is why contribution margin matters more than platform metrics.
Express this as a percentage by dividing by net revenue. Under 10% is dangerous territory where you barely cover variable costs. Between 15-25% is where most successful ecommerce brands operate. Above 25% means strong unit economics with room to invest in growth.
Average Order Value
Average order value measures the typical amount spent per transaction. It sounds basic, but AOV has an outsized impact on profitability because of how fixed costs work.
Every order has costs that stay roughly the same regardless of order size: picking, packing, customer service time, payment processing minimums. When a customer spends $50, those fixed costs eat a larger percentage than when they spend $100. Higher AOV spreads fixed costs across more revenue.
AOV is also one of the easiest metrics to improve. A 10% increase drops straight to the bottom line without additional acquisition cost. Often it’s easier to get customers to add one more item than to find entirely new customers.
The formula is straightforward:
Track AOV by channel, by customer type (new vs returning), and by device. Each view reveals different optimization opportunities. Common tactics to increase AOV include free shipping thresholds set 15-25% above current average, product bundles with modest discounts, and relevant cross-sell recommendations at checkout.
Customer Economics That Reveal Whether Growth Is Sustainable
Profitability metrics tell you if individual transactions make money. Customer economics tell you whether your growth strategy makes sense over time.
Here’s the core question: can you afford to acquire customers at the rate you’re spending? The answer depends on how much customers are worth, how much it costs to get them, and how long it takes to recover that cost. Get these ratios wrong and you can grow yourself into bankruptcy. Get them right and you have a machine that compounds.
These metrics require you to think beyond the first transaction. A customer who costs $80 to acquire might look unprofitable if they only spend $60 on their first order. But if they come back three more times over the next year and spend $200 total, that $80 acquisition cost was a bargain. Customer economics help you see the full picture.
Customer Lifetime Value
Customer lifetime value represents the total revenue a customer generates over their entire relationship with the brand. This includes their first purchase plus all repeat purchases over time.
CLV determines how much you can afford to spend on acquisition. A brand with $50 CLV can’t compete with one that has $200 CLV when bidding on the same keywords. The higher your CLV, the more you can invest in acquisition while staying profitable.
The simple formula:
The better approach is cohort-based. Track actual revenue generated by customers acquired in a specific month over 12, 24, and 36 months. This uses real data rather than assumptions and shows you how CLV changes over time.
CLV benchmarks vary dramatically by category. Subscription businesses often see $500+ because of recurring revenue. Fashion brands might see $150-300. The key is to track your own CLV trend rather than compare to different industries.
Customer Acquisition Cost
CAC measures the total cost to acquire a new customer. Most brands calculate this too low because they only count ad spend and ignore everything else that goes into acquisition.
True CAC includes ad spend, agency fees, creative production, attribution software subscriptions, and the portion of marketing payroll dedicated to acquisition. When you add it all up, true CAC is usually 30-50% higher than what brands report to their boards.
The formula:
Calculate this by channel too. Facebook might deliver a $40 CAC while Google delivers $60. But if Google customers have 50% higher CLV, that $60 CAC might actually be the better investment.
The CLV to CAC Ratio
This ratio compares how much a customer is worth to how much it costs to acquire them. A 3:1 ratio means for every $1 spent on acquisition, you get $3 back in customer value over time.
This single number tells you whether your unit economics work. Below 1:1, you lose money on every customer. At 1:1, you break even but have nothing left for fixed costs or profit. At 3:1 or higher, you have healthy economics that support sustainable growth.
CLV:CAC Ratio Health Check
Where does your business fall?
Below 1:1
Losing money on every customer. Stop acquisition.
1:1 – 2:1
Break-even zone. Fix retention or lower CAC.
3:1 – 4:1
Healthy baseline. Most sustainable brands live here.
Above 5:1
Strong economics. You may be underinvesting in growth.
CAC Payback Period
Even when CLV exceeds CAC with a healthy margin, cash flow can kill you if payback takes too long. CAC payback period measures how many months it takes to recover the cost of acquisition through customer revenue.
Think about it this way. You spend $100 to acquire a customer worth $300. Great ratio. But if that $300 comes over 18 months while you paid the $100 upfront, you need significant capital to fund the gap. Multiply across thousands of customers and you can grow yourself into bankruptcy.
The formula:
Payback under 6 months gives you room to scale aggressively because you can reinvest quickly. Between 6-12 months works with adequate working capital. Beyond 12 months requires patient investors or revenue-based financing to bridge the gap.
Average Order Value Analysis Reveals Hidden Opportunities
AOV reveals spending patterns and helps identify upselling opportunities. But the real insight comes from segmentation. Track AOV across acquisition channel, customer lifetime stage, and device type. You might find that mobile customers have 40% lower AOV but 60% higher purchase frequency, making them more valuable long-term despite appearing less attractive initially.
Retention Metrics That Show Whether Customers Stick Around
Acquisition gets the glory, but retention builds the value. A business that acquires customers efficiently but can’t keep them runs on a treadmill, constantly spending to replace people who leave.
The math works strongly in favor of retention. Repeat customers cost less to convert because they already trust the brand. They spend more per order on average. They refer others. When retention is strong, CLV goes up, which improves the CLV:CAC ratio, which gives you more room to invest in acquisition. It’s a virtuous cycle.
These metrics reveal whether that cycle is working or whether customers buy once and disappear.
Repeat Purchase Rate
Repeat purchase rate measures the percentage of customers who buy more than once. A 30% repeat rate means 30 out of every 100 first-time buyers come back for a second purchase.
This metric reveals product and experience quality. When customers don’t come back, something is wrong. Either the product didn’t meet expectations, the experience was poor, or competitors offer something better. Strong repeat rates indicate you’ve earned trust.
The formula:
Track this over consistent time windows. Benchmarks vary by category:
Repeat Purchase Rate by Category
12-month benchmarks — where do you stand?
Why it varies: Consumables naturally run out. Furniture doesn’t. Compare your rate to your category, not to all ecommerce.
New vs Repeat Customer Revenue Split
This measures what percentage of revenue comes from first-time buyers versus returning customers. A 60/40 split means 60% of revenue comes from new customers and 40% from repeat buyers.
The ratio reveals business maturity and retention health. Early-stage brands naturally skew toward new customer revenue because they’re still building a customer base. Mature brands should generate most revenue from existing customers because that revenue is more profitable and predictable.
When the split stays heavily weighted toward new customers year after year, something is wrong. Either retention efforts fail, the product doesn’t encourage repeat purchases, or heavy discounting attracts deal-seekers who never buy at full price.
New vs Repeat Revenue by Business Stage
How the split should evolve as you grow
Year 1-2 (Early)
Building customer base
Year 2-4 (Growth)
Retention kicks in
Year 4+ (Mature)
Healthy flywheel
New Customer Revenue
Repeat Customer Revenue
⚠️ Warning Sign
If your split stays heavily weighted toward new customers year after year, something is wrong. Either retention fails, the product doesn’t encourage repeats, or heavy discounting attracts one-time deal-seekers.
Track this ratio over time. When the percentage from new customers keeps increasing quarter over quarter, that signals retention problems even if total revenue grows.
Performance Metrics for Day-to-Day Optimization
The metrics above tell you whether the business model works. These performance metrics guide your daily and weekly optimization. They’re the inputs that feed into profitability and customer economics.
A word of caution: these are the metrics most often misused. Conversion rate and cart abandonment are easy to track, which makes them easy to obsess over. But optimizing conversion rate at the expense of contribution margin is a losing game. Always connect these metrics back to profitability. A 0.5% improvement in conversion rate means nothing if it comes from discounts that destroy your margins.
Conversion Rate
Conversion rate measures the percentage of visitors who complete a purchase. A 3% conversion rate means 3 out of every 100 visitors buy something.
Higher conversion means more sales from the same ad spend. Even small improvements have significant impact. Move from 2% to 2.5% conversion and you’ve increased revenue 25% without spending more on acquisition.
But conversion rate is only meaningful in context. A 5% conversion rate from email subscribers is different from a 1% rate from cold Facebook traffic. Track conversion by source:
| Traffic Source | Typical Conversion Rate | Strong Performance |
|---|---|---|
| 4-5% | 7%+ | |
| Paid Search (Brand) | 6-8% | 12%+ |
| Paid Search (Non-Brand) | 1.5-2.5% | 4%+ |
| Paid Social | 1-2% | 3%+ |
| Organic Search | 2-3% | 4%+ |
Cart Abandonment Rate
Cart abandonment measures the percentage of shoppers who add items to their cart but leave without completing the purchase. These are people who showed strong purchase intent and then stopped.
According to Baymard Institute’s analysis of 50 studies, the average cart abandonment rate is 70.22%. Mobile runs higher at 77-80%. That means roughly 7 out of 10 potential sales never complete.
But not all abandonment is bad. Baymard found that 43% of shoppers who abandon carts were “just browsing” with no purchase intent. They use carts for price comparison or wishlists. Recovery efforts aimed at these people waste resources.
The top reasons people abandon with actual purchase intent:
The Cart Abandonment Leak
Where 70% of potential sales disappear
Source: Baymard Institute (50 studies)
100 Add to Cart
57 with Purchase Intent
43% just browsing
30 Complete Purchase
Why the 27 with intent still leave:
Extra costs too high
Forced to create account
Delivery too slow
Don’t trust with payment
Checkout too complicated
Recovery tip: Focus on high-margin, high-value abandoners. A $500 cart at 40% margin deserves aggressive recovery. A $30 cart at 10% margin might not justify the cost.
- Extra costs too high (shipping, taxes, fees) – 48%
- Required to create an account – 26%
- Delivery too slow – 23%
- Didn’t trust site with payment info – 22%
- Checkout process too complicated – 18%
Focus recovery on high-margin, high-value abandoners. A $500 cart with 40% contribution margin deserves aggressive recovery. A $30 cart at 10% margin might not justify the email and SMS costs.
How These Metrics Connect to Each Other
These ten metrics form a system where changes in one affect the others. Understanding these connections helps you prioritize what to work on and predict how improvements will cascade through the business.
How Ecommerce Metrics Connect
Changes in one affect everything else
Daily Input
Conversion Rate
Daily Input
AOV
Daily Input
Cart Recovery
feeds into
Core Metric
Contribution Margin
CLV
CAC
The Key Ratio
CLV : CAC
Repeat Rate
New vs Repeat
↺ Retention improves CLV → Better ratio → More acquisition budget
Start at contribution margin. If individual transactions aren’t profitable, nothing else matters.
Start at the top with contribution margin. If individual transactions aren’t profitable, nothing else matters. You can have amazing CLV:CAC ratios on paper, but if you lose money on every order, you’re just losing money faster as you scale.
Once contribution margin is healthy, move to customer economics. CLV and CAC determine whether your acquisition strategy is sustainable. Payback period tells you whether you have the cash flow to execute that strategy. If these ratios work, you have a foundation for profitable growth.
Retention metrics are the multiplier. When repeat purchase rate goes up, CLV goes up, which improves the CLV:CAC ratio, which means you can afford to spend more on acquisition. Strong retention creates a virtuous cycle. Weak retention forces you onto the treadmill of constant acquisition just to maintain revenue.
Performance metrics are the daily levers. Conversion rate and AOV determine how efficiently you turn traffic into revenue. Cart abandonment shows where you leak potential sales. Optimize these to improve the inputs that feed everything above.
What to Review and When
Different metrics require different review cadences based on how quickly they change and how fast you can act on them:
Your Metrics Review Calendar
What to track and when
Every
Day
Pulse Check
Every
Week
Profit Reality
Every
Month
Unit Economics
Every
Quarter
Strategic Health
The trap: Daily metrics are easiest to track, so people over-optimize them. But quarterly metrics determine if the business survives.
Tools That Make This Trackable
You can calculate all of these metrics with spreadsheets if you’re willing to put in the manual work. But as order volume grows, manual tracking becomes unsustainable and error-prone. Here’s what works for different needs.
For profitability and contribution margin, Conjura provides SKU-level profit analysis with connections to Shopify, Amazon, and ad platforms. Starts at £299/month. TrueProfit offers simpler tracking for Shopify at $35-200/month. Lifetimely combines profit tracking with cohort analysis at $149-499/month.
For customer analytics and CLV, Klaviyo provides predicted CLV, churn risk, and expected next order dates. According to their documentation, you need 500+ customers and 180 days of history for predictions. Triple Whale offers cohort analysis alongside attribution at $429/month.
For attribution, Triple Whale dominates DTC with multi-touch models. Northbeam serves larger advertisers with media mix models and incrementality at $999/month+.
Reporting These Metrics to Different Stakeholders
The same data needs different framing based on who receives it. What a CEO needs to see is different from what a marketing manager needs for daily optimization.
For CEOs and Founders: Focus on contribution margin trend, CLV:CAC ratio, and revenue growth. They want to know if the business model works and if growth is sustainable. Monthly or quarterly reports work at this level. Skip the granular channel data.
For CMOs: Report CAC by channel, contribution margin by channel, and marketing mix allocation. They make budget decisions and need to see where investment produces returns. Weekly reports help them adjust before problems compound.
For CFOs: Emphasize CAC payback period, margin percentages, and new vs repeat revenue split. Financial people think in capital efficiency and risk. Show them when customers become profitable, not just whether they eventually become profitable.
For Marketing Managers: Provide conversion rates by source, AOV trends, cart abandonment data, and platform ROAS. They need this granular data for daily bid adjustments and creative decisions.
The ANA/4As study from April 2025 found media-only agencies average 3.7 years with clients while full-service agencies average 7.3 years. The difference comes from depth of relationship. Agencies that report on business impact—not just marketing activity—keep clients longer.
The Bottom Line
Most ecommerce reporting measures activity. The metrics in this guide measure outcomes.
Contribution margin tells you if transactions are profitable. CLV and CAC tell you if acquisition is sustainable. Payback period tells you if you can afford to grow. Retention metrics reveal whether customers stick around. Performance metrics guide daily optimization.
Start with contribution margin because nothing else matters if you lose money on every sale. Add customer economics once you’re confident individual transactions are profitable. Layer in retention metrics to understand the multiplier effect. Use performance metrics to optimize the inputs.
The question to keep in front of you is simple: are we actually making money? These metrics give you the tools to answer with precision.
Ecommerce Metrics FAQ
Direct answers to the metrics questions ecommerce businesses actually search for
Gross margin is revenue minus cost of goods sold (COGS). Contribution margin goes deeper—it’s revenue minus all variable costs including COGS, shipping, returns, ad spend, platform fees, and transaction fees.
Example: You sell a product for $100. COGS is $35, so gross margin is $65 (65%). But add in $12 shipping, $8 returns, $18 ad spend, and $5 fees—contribution margin drops to $22 (22%). Gross margin shows if your product pricing works. Contribution margin shows if your business model works.
A good ecommerce gross margin typically ranges from 40% to 80%, with most established businesses landing between 44% and 48%. If you sell your own branded products, margins of 60-80% are achievable. Resellers and dropshippers often operate at 20-40%.
Below 40% makes it difficult to cover variable costs and turn a profit. Many lenders require at least 40% gross margin before offering financing. Higher margins give you room to invest in marketing and absorb costs like returns and shipping.
Below 10% is dangerous—you barely cover variable costs. Between 15-25% is where most successful ecommerce brands operate. Above 25% indicates strong unit economics with room to scale.
Contribution margin below 10% means fixed costs will eat you alive. At 10-20%, scaling feels like running in quicksand. Track this at the SKU level—your best-seller might have negative contribution margin due to high return rates while a slower product delivers 35% margins.
The five most common reasons: (1) Hidden costs eating margins—shipping, returns, payment processing fees often add 15-25% that brands forget to account for. (2) Relying on ROAS instead of contribution margin—a 4x ROAS can still lose money after all costs. (3) Poor retention forcing endless acquisition spending. (4) Free shipping without adjusting pricing. (5) Discounting too aggressively to drive volume.
Even Amazon’s ecommerce business operates at near-zero or negative margins. The path to profitability requires tracking all costs at the order level, not just revenue and ad spend.
Average net profit margins for ecommerce range from 4% to 10%. Gross margins typically fall between 40-50%. The gap between gross and net is where most ecommerce businesses struggle—marketing, operations, and shipping costs consume the difference.
Profitability depends heavily on your business model: subscription businesses can operate at lower initial margins because of recurring revenue; dropshipping needs higher gross margins (40%+) to offset thin net margins; branded products offer the best margin potential but require more upfront investment.
The average ecommerce ROAS is around 2.87:1, meaning $2.87 in revenue per $1 spent on ads. Most brands target 3:1 to 4:1 as a baseline, while top performers aim for 4:1 to 6:1.
But “good” depends entirely on your margins. A luxury brand with 80% gross margins can profit at 2:1 ROAS. A dropshipper with 25% margins might need 5:1+ just to break even. The only ROAS that matters is one that exceeds your break-even point.
Break-even ROAS = 1 / Profit Margin (as a decimal). If your profit margin is 25%, your break-even ROAS is 1 / 0.25 = 4.0. You need $4 in revenue for every $1 in ad spend just to break even.
A simpler formula: Break-even ROAS = Selling Price / (Selling Price – Total Costs). Example: $50 product with $30 in total costs (COGS + shipping + fees) = $50 / $20 = 2.5x break-even ROAS. Any campaign below 2.5x loses money.
Google Search leads with approximately 4.5:1 median ROAS due to high purchase intent. Meta (Facebook/Instagram) averages around 2.2:1. TikTok averages 1.4:1 overall, but jumps to 2.25:1 when using “Value” optimization.
These are medians, not targets. High-intent platforms like Google Search typically outperform awareness channels like TikTok on direct ROAS. But lower-ROAS channels may bring in customers with higher lifetime value—evaluate channels on total customer value, not just first-purchase ROAS.
ROAS only measures revenue against ad spend—it ignores every other cost. A 4x ROAS looks great until you factor in 35% COGS, 12% shipping, 8% return rate, and platform fees. That “profitable” campaign might actually lose money on every sale.
ROAS also doesn’t account for customer lifetime value. A campaign with 2x ROAS acquiring subscription customers who stay 18 months is more valuable than 5x ROAS acquiring one-time bargain hunters. Use contribution margin and CLV alongside ROAS for the full picture.
ROAS (Return on Ad Spend) = Revenue from ads / Ad spend. It measures advertising efficiency only. ROI (Return on Investment) = (Profit – Total Investment) / Total Investment. It measures actual profit after all costs.
A 4x ROAS doesn’t mean 4x ROI. If you spend $1,000 on ads and generate $4,000 revenue, ROAS is 4x. But if that $4,000 in revenue has $3,200 in total costs (product, shipping, fees, the original $1,000 ad spend), your actual profit is $800—meaning ROI is -20%. ROAS optimizes ads; ROI determines if you’re making money.
Simple formula: CLV = Average Order Value × Purchase Frequency × Average Customer Lifespan. If customers spend $75 per order, buy 4 times per year, and stay 2.5 years, CLV = $75 × 4 × 2.5 = $750.
Better approach: Cohort-based tracking. Track actual revenue from customers acquired in a specific month over 12, 24, and 36 months. This uses real data instead of assumptions and reveals how CLV varies by acquisition channel, season, or campaign.
3:1 is the healthy baseline—for every $1 spent acquiring a customer, you get $3 back in lifetime value. Below 1:1 means you lose money on every customer. 1:1 to 2:1 is break-even territory. 3:1 to 4:1 is sustainable. Above 5:1 may mean you’re underinvesting in growth.
This ratio determines whether your business model works. A brand with $50 CLV can’t compete against one with $200 CLV when bidding on the same keywords. Higher CLV gives you more room to invest in acquisition while staying profitable.
CAC payback period is how many months it takes to recover your customer acquisition cost through revenue. Formula: CAC / (Monthly Revenue per Customer × Gross Margin %).
Under 6 months allows aggressive scaling since you recoup costs quickly. 6-12 months works with adequate working capital. Beyond 12 months requires outside funding to bridge the gap. Even with a healthy CLV:CAC ratio, a long payback period can create fatal cash flow problems—you pay acquisition costs upfront but wait months to recover them.
Most brands only count ad spend and ignore everything else. True CAC includes: ad spend, agency fees, creative production costs, attribution software subscriptions, and the portion of marketing payroll dedicated to acquisition.
When you add it all up, true CAC is typically 30-50% higher than what brands report. If you think your CAC is $40, it’s probably closer to $52-$60. Calculate it by channel too—Facebook might deliver $40 CAC while Google delivers $60, but if Google customers have 50% higher CLV, that $60 CAC is the better investment.
Three proven tactics: (1) Free shipping thresholds set 15-25% above current AOV—if your AOV is $60, offer free shipping at $75. (2) Product bundles with modest 10-15% discounts that increase total cart value. (3) Relevant cross-sell recommendations at checkout based on cart contents.
AOV increases drop straight to the bottom line without additional acquisition cost. A 10% AOV increase with the same conversion rate and traffic means 10% more revenue at zero extra marketing spend. It’s often easier to get existing customers to add one item than to find new customers.
The ideal ecommerce conversion rate is around 2.5-3% overall. But this varies dramatically by traffic source: Email converts at 4-5% (7%+ is strong). Paid search brand terms convert at 6-8% (12%+ is strong). Paid social converts at 1-2% (3%+ is strong). Cold Facebook traffic at 1% is normal.
Context matters more than benchmarks. A 5% conversion rate from email subscribers is completely different from 1% from cold paid traffic. Track conversion by source, device, and customer type (new vs. returning) to find real optimization opportunities.
The average cart abandonment rate is 70.22% according to Baymard Institute’s analysis of 50 studies. Mobile abandonment runs higher at 77-80%. This means roughly 7 out of 10 potential sales never complete.
But 43% of abandoners were “just browsing” with no real purchase intent—they use carts for price comparison or wishlists. Focus recovery efforts on high-value, high-margin abandoners. A $500 cart at 40% margin deserves aggressive recovery. A $30 cart at 10% margin might not justify the effort.
Top reasons among shoppers with actual purchase intent: Extra costs too high (shipping, taxes, fees) at 48%. Required to create an account at 26%. Delivery too slow at 23%. Didn’t trust site with payment info at 22%. Checkout process too complicated at 18%.
Quick fixes: Show total costs (including shipping) early—before checkout. Offer guest checkout. Display trust badges and security indicators. Simplify checkout to as few steps as possible. Be transparent about delivery times upfront.
It depends heavily on your category. Subscription/consumables: 40-50%. Beauty and personal care: 30-40%. General ecommerce: 20-30%. Fashion and apparel: 15-25%. Home and furniture: 10-20%.
Consumables naturally run out and need replacement. Furniture doesn’t. Compare your rate to your category, not all ecommerce. If customers aren’t coming back, something is wrong—either the product didn’t meet expectations, the experience was poor, or competitors offer something better.
It evolves as your business matures. Year 1-2: 70-80% new, 20-30% repeat (you’re building a customer base). Year 2-4: 50-60% new, 40-50% repeat (retention kicks in). Year 4+: 30-40% new, 60-70% repeat (healthy flywheel).
If your split stays heavily weighted toward new customers year after year, that’s a warning sign. Either retention efforts are failing, the product doesn’t encourage repeat purchases, or heavy discounting is attracting one-time deal-seekers who never return at full price.
Daily: Orders, revenue, conversion rate, platform ROAS (pulse check). Weekly: Contribution margin trends, CAC by channel, cart abandonment (profit reality). Monthly: CLV:CAC ratio, repeat purchase rate, new vs. repeat split (unit economics). Quarterly: Cohort analysis, payback period trends, business model review (strategic health).
The trap: Daily metrics are easiest to track, so people over-optimize them. But quarterly metrics determine if the business survives. Don’t let the urgency of daily numbers distract you from the importance of long-term economics.
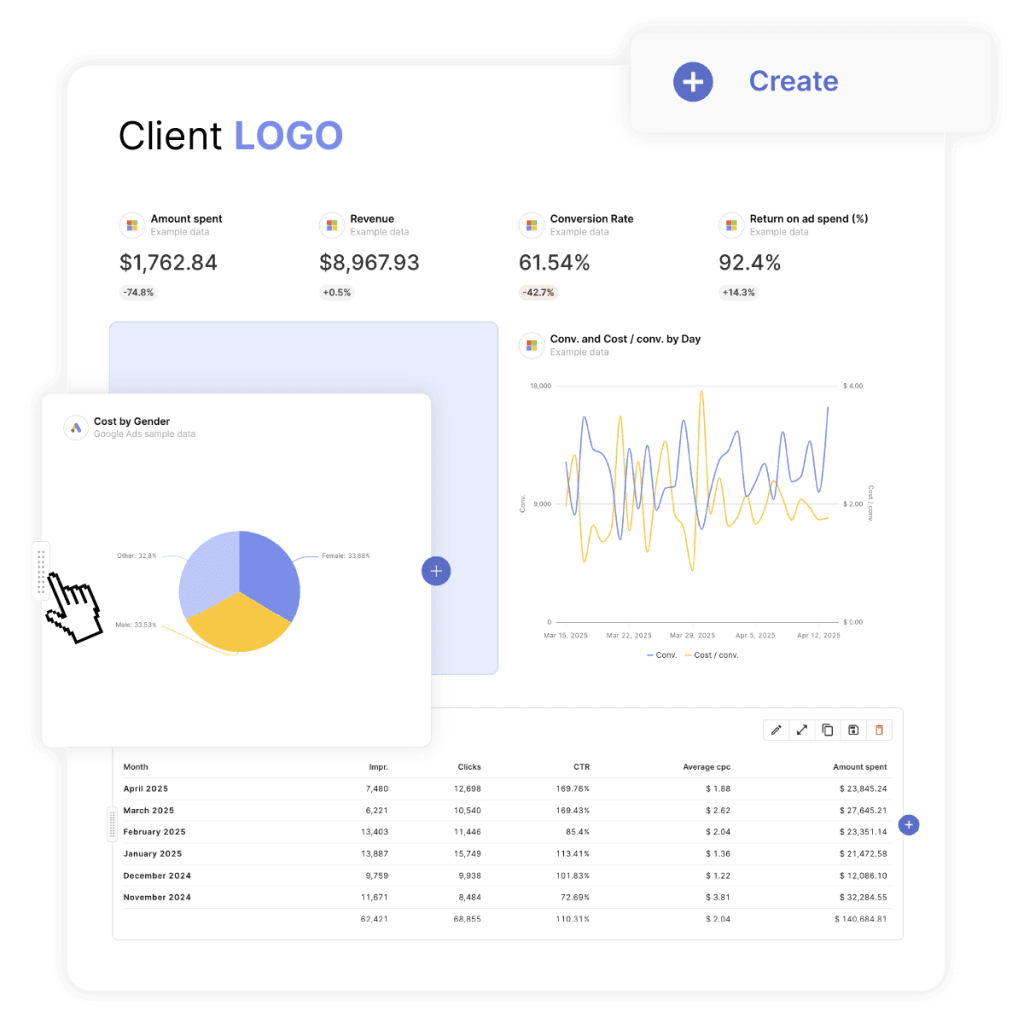
See the metrics that actually matter—contribution margin, CLV, and true profitability—in one client report.
Start Your Free Trial Today