
Google Ads reporting is essential for any marketing agency to provide transparency and show the impact of Google Ads campaigns on their client’s bottom line. Monitoring and analyzing data gathered from Google Ads campaigns allows marketers to gain valuable insights into performance, track progress toward set goals, identify areas for improvement, and make informed decisions. In this article, we’ll dive deeper into the benefits of Automated Google Ads Reporting.
What Is Google Ads?
Google Ads is frequently at the core of an online marketer’s Pay Per Click (PPC) advertising strategy. It is a powerful digital advertising platform which can be leveraged to reach multiple business goals, and allows you to specifically target key audiences based upon demographics, location, interests and more to drive qualified traffic (search) to your business.
There are four main types of Google Ads Campaigns; search, display, shopping and apps. Some of the goals marketers aim to achieve with Google Ads include:
- Drive sales
- Gain leads
- Increase website traffic
- Product promotion
- Brand awareness
- App usage
Check out these steps to setting up successful Google Ads campaigns.
Understanding Google Ads Metrics and KPIs
Marketing agencies must understand their campaigns’ KPIs to use Google Ads reporting effectively to increase their revenue and results. KPIs like:
- Impressions
This metric reflects how often your ad was displayed to potential customers. It’s important to note that impressions don’t necessarily mean clicks, so don’t get too excited if this number is high. - Clicks
This is the number of times someone clicked on your ad. More clicks mean more traffic to your website, but you need to target the right audience to ensure high-quality traffic. - CPC
Cost-per-click is the amount you pay every time someone clicks on your ad. Monitoring this metric is important to ensure you get a good investment return. - Conversion Rate
Percentage of people who clicked on your ad and then completed a desired action, such as purchasing or filling out a form. A high conversion rate is the ultimate goal, so optimize your campaigns for maximum results. - Conversions
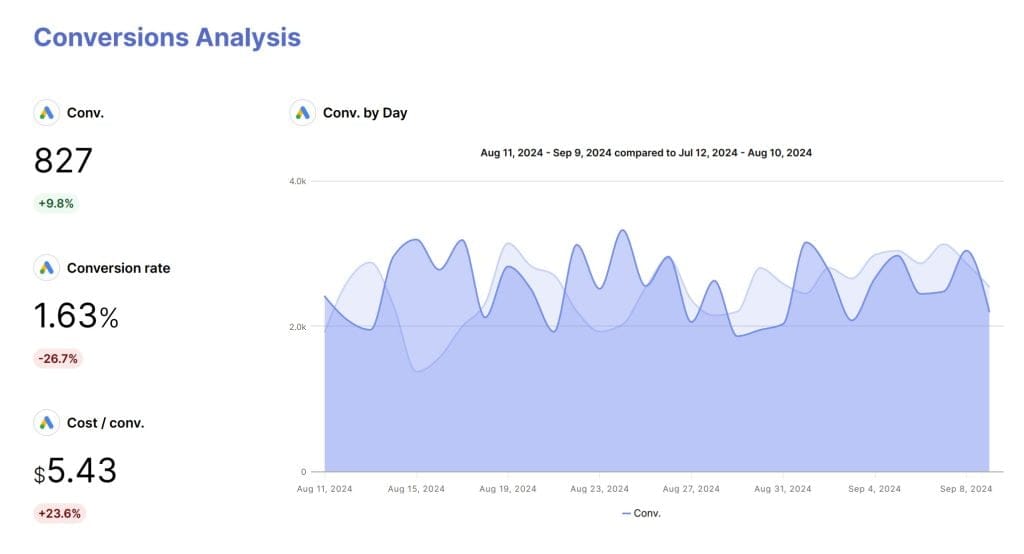
Conversions represent the desired actions users taken on your website after clicking on your ad, such as placing an order, filling out a form, or subscribing to a newsletter. Tracking conversions helps measure the effectiveness of your campaigns in driving valuable business outcomes. - Cost/Conversion
Cost per conversion indicates the average amount you spend to acquire a single conversion. It is calculated by dividing the total cost of your ads by the number of conversions.
By automating your Google Ads reporting process, agencies can quickly identify which metrics and Google Ads KPIs are performing well and which areas need improvement.
Achieve Success with Automated Google Ads Reporting
With the power of automation, marketing agencies can streamline their reporting processes, gain valuable insights, and make informed decisions to drive Google Ads campaigns forward. Google Ads reporting is therefore a critical component for any online marketer’s success. Here’s how:
Performance Evaluation
Obtain a comprehensive view of your campaign’s performance by monitoring metrics and KPIs such as impressions, clicks, and conversions.
ROI Analysis
Calculate a campaign’s ROI (return on investment) by tracking and analyzing Google Ads data, and understand which are generating the most revenue.
Conversion Tracking
Track user behavior, including the actions taken on the website after clicking on your ads. Discover which keywords and campaigns drive conversions, and which need optimization.
Budget Allocation
Identifying the best-performing campaigns and allocating your budget accordingly. Optimizing Google Ads campaigns with data-driven reporting allows advertisers to make informed decisions, refine targeting strategies, and maximize ROI based on actionable insights.
Audience Insights
Get insights into your target audience with Google Ads reporting, such as demographics and interests. This information can help you tailor your ad campaigns to specific groups and improve your overall targeting.
Ad Optimization
Evaluate which ads perform well and which ones need optimization with Google Ads reporting. For instance, you can run an A/B test with your ad copy, images, or landing pages to improve performance.
Competitor Analysis
Analyze the auction insights report, which shows how often your ads appear alongside your competitors’ ads in the search results, along with their impression share and overlap rate. This data helps you understand the competition level and identify potential improvement areas.
Additionally, you can use tools like Semrush or SpyFu to gain further insights into your competitors’ ad copy, keywords, and landing pages. By monitoring and analyzing this data, you can keep track of your competitors’ strategies and make informed decisions to stay competitive in your industry.
Campaign Monitoring
Monitor your Google ads campaigns in real-time to see your progress towards your targets and quickly adjust as needed.
Data-Driven Decision Making
Get insights into campaign performance to make informed decisions. Monitor metrics (KPIs) like clicks, impressions, conversions, and cost-per-click. Adjust targeting ad creatives and allocate your advertising budget based on data.
Communication and Reporting
Share campaign results with your team, clients and/or stakeholders. Set goals, present results, provide actionable insights through clear communication to build trust, drive business success and strong client relationships.
Types of Google Ads Reports and Dashboards
Let’s explore some of the most popular types of Google Ads reports and dashboards.
- Campaign Performance Dashboard: This dashboard provides an overview of all your campaigns, including impressions, clicks, conversions, and more. It’s an excellent report for measuring your campaigns’ success and identifying improvement areas.
- Ad Group Insights Dashboard: This dashboard focuses on the performance of your ad groups. It allows you to analyze the effectiveness of your ad groups and identify which ones are performing best.
- Keyword Analytics Report: This report provides in-depth information on how your keywords are performing. It shows which keywords generate the most traffic, which converts the best, and which ones need to be optimized.
- Search Terms Breakdown: This report shows you the search terms people use to find your ads. It’s an excellent tool for identifying new keywords and improving your targeting.
- Audience Segmentation Dashboard: This dashboard allows you to analyze the performance of your ads based on different audience segments. This can help you identify the most profitable audiences and adjust your targeting accordingly.
- Geographic Performance Analysis: This report shows you how your ads are performing in different locations. It’s an excellent dashboard for insights for optimizing your campaigns for specific geographic regions.
- Device Optimization Report: This report provides insights into how your ads perform on devices like desktops, mobile devices, and tablets. It can help you optimize campaigns or devices and landing pages.
- Placement Metrics Dashboard: This dashboard shows you how your ads perform on different websites and placements. It can help you optimize your targeting and improve your ad placements.
- Ad Creative Effectiveness Report: This report provides insights into how your ad creative is performing. It shows which ad variations generate the most clicks and conversions and which need optimization.
Best Practices for Creating Effective Google Ads Reports
Google Ads reports provide valuable insights into campaign performance, audience engagement, and return on investment. To ensure your reports are impactful and actionable, here are reporting best practices for creating effective Google Ads reports:
Define Clear Goals
Defining clear goals is crucial when creating your Google Ads reports. This is like setting a destination for your advertising journey. Demystifying Google Ads reports allows advertisers to gain a clear understanding of their campaign performance and make data-driven decisions for optimization.
Without clear goals, you’ll be lost in a sea of data and not know which KPIs to focus on. Think about what you want from your Google Ads campaigns.
Select Relevant Key Performance Indicators (KPIs)
Choose Key Performance Metrics (KPIs) which will help you track progress toward your business goals. Include metrics like conversion rates and cost per acquisition (CPA) that tell you how much money you spend to acquire a new customer.
Customize Report Layout
Reinforcing your brand image is paramount for consistency and recognition. This involves strategic measures that cultivate a favorable perception among your audience. To gain valuable insights, consider white-label reporting. By employing such techniques, you can solidify your brand’s credibility, show professionalism and build trust.
Include Comparative Data
By comparing how your campaigns perform now to how they performed in the past or against your goals, you can better understand what’s working and what needs some tweaking. So be sure to include comparative data in your reports to understand the big picture.
Segment Your Data
Segmentation means breaking down your data into smaller groups to better understand your campaign’s performance.
You can segment by time, device, location, or other relevant factors. This will help you identify trends and make better-informed decisions about your ad strategy.
Schedule Automated Reports
Don’t waste your time manually creating and sending Google Ads reports weekly. Let technology do the work for you!
Schedule automated reports to be sent directly to your client’s or stakeholders’ inboxes. This saves you time and ensures your reports are consistently delivered on time.
Use Data Visualization Tools
Think colorful graphs, charts, and infographics that help you spot trends and patterns with just a glance. Not only do the right charts and graphs look good, but they also make it much easier to communicate your findings to clients and stakeholders.
Selecting the appropriate data visualization is crucial as it simplifies complex information, enhancing comprehension and decision-making. The right data visualization can significantly amplify the impact of your data presentation.
Test and Repeat
Now that you’ve created your Google Ads report, it’s time to see how it performs. The last thing you want is to put in all that effort only to have your report ignored or misunderstood by clients or stakeholders.
As the famous scientist Thomas Edison once said, “I have not failed. I’ve just found 10,000 ways that won’t work.” Don’t be discouraged if your first attempt doesn’t meet your expectations.
Keep testing until you create a report that truly meets your client’s or stakeholders’ requirements.
Creating Automated Google Ads Reports for Clients
Creating automated Google Ads reports for clients can save you time and provide regular updates on campaign performance. Here’s a step-by-step guide to help you set up automated reports effectively:
- Understand Client Requirements: Identify the specific goals, data, and metrics important to your clients for reporting purposes.
- Choose Reporting Tool: Select the most suitable reporting tool, such as Swydo, to automate the creation of reports and/ or dashboards.
- Select Relevant Metrics: In your automated reports, include key performance indicators (KPIs) that align with your client’s advertising goals. Choosing the right Google Ads KPIs is vital to measure success.
- Customize Report Templates: Create visually appealing and branded report templates that present the data clearly and organized.
- Segment Data Appropriately: Break down the data by campaigns, ad groups, keywords, or other relevant segments to provide deeper insights.
- Schedule Report Frequency: Determine how often your client wants to receive reports and set up automated scheduling accordingly.
- Include Commentary and Insights: Add a section to the reports where you can provide commentary and recommendations based on the campaign’s performance.
- Share Reports: Ensure the reports are shared with your clients using email attachments, secure cloud storage, or client portals.
- Review and Refine:
- Regularly review the your reports and dashboards.
- Gather client feedback.
- Adjust the reporting process to meet your client’s and stakeholder’s needs.
Through automation and leveraging data-driven insights, agencies can focus on analyzing and optimizing campaigns.
Check out our Google Ads optimization checklist
Conclusion
Google Ads reporting helps marketing agencies provide valuable insights into campaign performance, helping agencies understand what’s working and what needs improvement.
Setting appropriate goals and tracking the right metrics and KPIs over time allows marketing agencies to better optimize campaigns, allocate resources effectively and enhance decision making. Automating Google Ads reporting improves productivity while ensuring regular communication of results and insights to clients, which supports transparency and accountability, as well as demonstrates the value of their services to clients.
Curious to see how Swydo can improve your Google Ads reporting process? Request a demo or sign up for a free trial, and create your free Google Ads report in minutes.