
Looker Studio remains a powerful reporting tool that helps marketing agencies save time and focus on what really matters — understanding data and boosting campaign success. But the platform’s true potential lies in its connectors, which link to external platforms like Google Ads, Facebook Ads, Shopify, and others.
Looker Studio connectors are the lifeline between your data sources and your reports. If they break, everything breaks — data stops syncing, dashboards go blank, and you lose trust in your numbers. Choosing the right connector is key to solving common marketing agency challenges, like scattered data and slow manual reporting.
In this guide, you’ll learn how Looker Studio connectors work, which ones deliver the most value in 2026, and how to handle common pitfalls before they derail your campaigns.

What are Looker Studio Data Connectors?
A Looker Studio connector is a data pipeline that pulls data from an external platform—like Facebook Ads or Google Analytics—and brings it into Looker Studio for visualization. There are three main types:
| Connector Type | Built By | Examples | Best Use Case |
|---|---|---|---|
| Google Connector | GA4, Google Ads, YouTube, BigQuery | Native Google ecosystem integrations | |
| Partner Connector | Third Parties | Supermetrics, Funnel.io, Windsor.ai | Popular non-Google platforms |
| Community Connector | Independent Devs | Custom builds, niche platforms | Unsupported or custom data needs |
Let’s take a closer look at the different Looker Studio connectors to help you choose the right ones for your agency’s workflows.
Free Google Connectors
Google provides a few native connectors at no cost, making them ideal for agencies that rely heavily on integrations within Google’s ecosystem:
Google Sheets
- About: Lets you access data stored in a Google Sheets worksheet
- Use Case: Importing manually entered data, campaign notes, or data from platforms without dedicated connectors.
- Pros: Easy setup, no technical skills required, great flexibility
- Cons: Requires manual data updates, limited scalability
- Price: Free
BigQuery
- About: Connects your BigQuery tables to Looker Studio
- Use Case: Large-scale datasets, complex queries, data warehouse architectures
- Pros: Scalable, fast processing, native integration, bypasses GA4 API quotas entirely
- Cons: Requires technical knowledge; 24-48 hour data delay for GA4 export
- Price: Free connector; BigQuery usage may incur costs (free tier: 10GB storage, 1TB queries/month)
Google Ads
- About: The Google Ads connector for Looker Studio is aligned with the public Google Ads API for creative assets reporting
- Use Case: PPC campaign performance, impressions, clicks, conversions
- Pros: Native integration, deep granularity, new “Platform Comparable” metrics (Nov 2025) for cross-channel comparison
- Cons: No multi-platform comparison without other connectors
- Price: Free
YouTube Analytics
- About: Lets you use Looker Studio to report on analytics data about the YouTube channels you own
- Use Case: Video and ad performance, views, watch time, audience engagement
- Pros: Native connector, comprehensive video metrics
- Cons: No cross-channel comparison without other connectors
- Price: Free
Search Console
- About: Allows you to import SEO metrics like site impressions, clicks, and keyword rankings directly from Google Search
- Use Case: SEO metrics—impressions, clicks, keyword rankings from Google Search
- Pros: Direct organic search data from Google
- Cons: Limited historical data (16 months), keyword granularity limitations
- Price: Free
Google Analytics 4
- About: Allows you to pull in web and app user behavior data, including sessions, events, traffic sources, and conversions
- Use Case: Web and app user behavior—sessions, events, traffic sources, conversions
- Pros: Flexible event-based tracking, quota monitoring in edit mode (right-click any chart)
- Cons: Strict quotas—10 concurrent requests for standard properties can be exceeded with 5+ complex charts
- Price: Free (GA360 at ~$150K/year provides 50 concurrent requests)
Paid Connectors
Third-party providers develop connectors that integrate Looker Studio with platforms outside Google. When you check out the Looker Studio connectors marketplace, you’ll see a range of third-party integrations with the most popular platforms, including Facebook Ads, Instagram Ads, LinkedIn Ads, and HubSpot.
Companies publishing third-party connectors also offer agencies niche-specific connectors, like Marketing Miner, Dialfire, Optmyzr, Pipedrive, and others.
Yes, these paid connectors come with a price tag, but for marketing agencies juggling multiple clients and complex, multi-channel campaigns, they’re often well worth it. With automated data integration, they save teams from manual data entry and building custom setups from scratch.
Open-Source Connectors
For agencies with technical expertise or custom requirements, Looker Studio offers the ability to build community connectors.
Looker Studio users develop these data connectors to allow agencies to build their own integrations or change existing ones to suit their needs. For example, an agency might create a custom connector to pull data from a client’s CRM system that doesn’t have a pre-built connector, or to integrate with an industry-specific tool like a real estate listing database or niche e-commerce platform. While open-source options can be cost-effective, they require coding knowledge. And the agency, rather than the connector’s creator, will have to fix any potential issues.
Best Data Connectors for Marketing Agencies
From native connectors to those that help you centralize multi-channel data and import it into your dashboards and reports, Looker Studio marketplace offers over 1,200+ data connectors, and we’re here to review the best matches for marketing agencies.
We did the research for you and browsed all the review websites and community forums to present the best data connector for each platform your agency might work with.
Advertising & Paid Media Connectors
Running paid campaigns across platforms like Google Ads, Facebook, or LinkedIn? These connectors bring your ad data straight into Looker Studio — no exporting, no guesswork. Just clean, accurate numbers to back up your results.
NEW Search Ads 360
- About: Native integration for analyzing search ads performance
- Use Case: Ability to view and analyze the performance data from the upgraded Search Ads 360 experience
- Pros: Native integration, frequent data updates
- Cons: No cross-channel metrics, might require technical knowledge
- Starting Price: Free
Google Ad Manager 360
- About: Built-in integration to visualize your Ad Manager reports in Looker Studio
- Use Case: Ad impressions, spend, and revenue analysis
- Pros: Native integration, detailed reporting
- Cons: Complex setup, limited metrics compared to direct platform access
- Price: Free
Microsoft Advertising (Supermetrics)
- About: Imports Bing Ads metrics with cross-platform attribution
- Use Case: Bing Ads metrics with cross-platform attribution
- Pros: Straightforward setup, good documentation
- Cons: Less advanced than native Google integrations
- Price: From $37/month (Supermetrics Starter)
Facebook Ads (via Supermetrics, Funnel.io, Windsor.ai)
- About: Tracks campaign-level spending, CPA, and CTR
- Use Case: Campaign spending, CPA, CTR tracking
- Pros: Essential for social advertising reporting
- Cons: Meta’s frequent API changes require connector updates; field names may differ from Ads Manager
- Price: Supermetrics from $37/month; Windsor.ai from $23/month; Funnel.io from ~$120/month

TikTok Ads (via Supermetrics, Windsor.ai)
- About: Pulls in video performance and demographics data
Use Case: Video performance, demographics, ROI analysis - Pros: Growing platform importance
- Cons: Known “Purchase Value = $0” bug—this is a connector-layer issue, not platform API. Windsor.ai reports having patched this.
- Price: Supermetrics from $37/month; Windsor.ai from $23/month
LinkedIn Ads (Power My Analytics)
- About: Imports LinkedIn campaigns’ data for cross-channel performance reporting
- Use Case: B2B campaign reporting, cross-channel performance
- Pros: Low-cost, reliable, tracks some organic metrics
- Cons: API limitations reduce data freshness
- Price: From $14.95/month
See the top 10 PPC reporting tools in 2026.
SEO & Organic Search Connectors
From rankings to backlinks, SEO data is essential — but tricky to centralize. These connectors help you bring Ahrefs, Semrush, and GSC data into Looker Studio, so you can track what’s working (and what needs fixing) in one place.
Ahrefs Rank Tracker
- About: Tracks keyword rankings across 190+ countries and monitors SERP features
- Use Case: Keyword rankings (190+ countries), backlink analysis, technical SEO audits
- Pros: Comprehensive SEO data, reliable connectors, extensive documentation
- Cons: Expensive; lower tiers use credit-based system
- Price: Lite $129/month; Standard $249/month; Advanced $449/month; Enterprise $999/month+

Ahrefs Rank Tracker template for Looker Studio
Ahrefs (Rank Tracker, Site Explorer, Site Audit)
- About: Crawls websites to identify technical SEO issues (e.g., broken links, duplicate content). Analyzes backlinks, organic traffic, and top-performing pages for any domain
- Pros: Comprehensive SEO data, reliable connectors, extensive documentation
- Cons: Expensive; lower tiers use credit-based system
- Price: Lite $129/month; Standard $249/month; Advanced $449/month; Enterprise $999/month+
Semrush (Position Tracking, Domain Analytics)
- About: Monitors keyword rankings across different devices or locations and tracks competitor movements. Provides traffic estimates, top keywords, and competitor domain comparisons
- Use Case: Keyword rankings, competitor analysis, traffic estimates
- Pros: Accurate tracking, SERP features monitoring, multiple keyword sets
- Cons: Traffic data is estimated; Guru plan required for Looker Studio integration
- Price: Pro $139.95/month (no Looker integration); Guru $249.95/month (includes Looker); Business $499.95/month
Google Search Console (Windsor.ai)
- Use Case: Automated GSC exports with enhanced historical data access
- Pros: Works with free plan, expanded filtering
- Cons: Slight delay in API data updates
- Price: Free plan (1 source); Basic $23/month ($19 annual)
Combine SEO and PPC to boost campaign success.
Social Media Connectors
Want a clearer picture of your organic and paid social performance? These connectors help you report on everything from follower growth to post reach — across TikTok, Instagram, Facebook, and more.
Instagram (Catchr)
- About: Pulls data from multiple Instagram profiles on organic performance, followers, and post count
- Use Case: Organic performance, followers, post engagement
- Pros: Easy setup, tracks both organic and limited paid metrics
- Cons: API limitations cause delays; Business accounts only
- Price: From $25.99/month

Instagram (Catchr) template for Looker Studio
TikTok (Windsor.ai)
- About: Imports organic TikTok data on views, following, and hashtags
- Use Case: Video views, following, hashtag performance
- Pros: Works with free plan, can blend with ad data
- Cons: API limitations; complex setup for beginners
- Price: Free plan (1 source); Basic $23/month
Pinterest (Dataslayer)
- About: Connect Pinterest Ads to Looker Studio for organic content reporting
- Use Case: Organic content and ads performance
- Pros: Extensive documentation, unlimited users
- Cons: Some API delays persist
- Price: Freelance $29/month; Large Agency $299/month
Facebook Insights (Avian)
- About: Automates data import from Pinterest profiles to Looker Studio
- Use Case: Facebook organic and ads benchmarking
- Pros: Technical support, AI-enhanced analysis tools
- Cons: Custom pricing may be unclear; complex UI
- Price: Custom pricing
Cross-channel Reporting Connectors
If your agency juggles data from lots of platforms, cross-channel connectors can save you a ton of time. These tools pull everything into one place automatically — no more switching tabs, copying data, or wrestling with spreadsheets. They’re flexible, scalable, and built to handle the complexity of multi-channel reporting.
Coupler.io
- Free: 1 source, 1 account, 1 destination, 100 rows/run
- Starter: $32/month ($24 annual) — 3 accounts, unlimited sources, 1 destination, 5K rows
- Active: $132/month ($99 annual) — 15 accounts, 3 destinations, unlimited volume
- Pro: $259/month ($199 annual) — 50 accounts, unlimited destinations, hourly refresh
- Pros: 410+ sources, all destinations included, no-code setup, built-in templates
- Cons: Costs increase with multiple data connections; setup can take time
Supermetrics
Supermetrics remains the market leader but has complex pricing that can escalate quickly:
- Starter: $37/month (US) / €29/month (EU) — 3 sources, 1 user, 1 destination
- Growth: $177/month (US) / €159/month (EU) — 7 sources, 3 users, 1 destination
- Pro: $499/month (US) / €399/month (EU) — 10 sources, 3 users, 1 destination
- Add-ons: ~$37/additional source; $29-99/additional user; $149/additional destination
TCO Warning: Regional pricing differs significantly. Adding sources/users/destinations can result in non-linear cost increases.
- Pros: 100+ connectors, auto-refresh, agency-specific features, caching reduces quota issues
- Cons: Per-user pricing punishes scale; costs escalate rapidly
Windsor.ai
Windsor.ai offers transparent pricing and strong BigQuery integration:
- Free: 1 source, 1 account, 1 destination (30-day trial, then limited forever free)
- Basic: $23/month ($19 annual) — 3 sources, 75 accounts, unlimited users
- Standard: $118/month ($99 annual) — 7 sources, 75 accounts, hourly refresh
- Plus: $299/month ($249 annual) — 10 sources, 200 accounts
- Professional: $598/month ($499 annual) — 14 sources, 500 accounts, 15-min refresh
- Pros: 325+ sources, unlimited BI syncs on paid plans, reports TikTok $0 bug fixed, excellent BigQuery focus
- Cons: Some users report occasional syncing issues
Funnel.io
Funnel.io uses a “Flexpoint” usage-based model. They launched a free plan in July 2025 with 400 Flexpoints (approximately 2 data sources + 2 destinations).
- Free: 400 Flexpoints, up to 5 users, limited to Looker Studio/Sheets/Excel destinations
- Starter: ~$120-240/month depending on configuration
- Business: Custom pricing for SSO, workspaces, advanced features
- Pros: 500+ sources, excellent data transformation/ETL capabilities, fast support
- Cons: Flexpoints can burn quickly with high-volume sources; costs unpredictable at scale
Dataslayer — Supermetrics Alternative
Dataslayer positions itself as the Supermetrics alternative with friendlier pricing based on API calls rather than users:
- Freelance: €25/month — unlimited sources/users, 5 accounts per source
- Small Agency: €62/month — 50 accounts per source
- Medium Agency: €104/month — 100 accounts per source
- Large Agency: €245/month — unlimited accounts
- Pros: 45-90% cheaper than Supermetrics for 3+ user teams; unlimited users; Amazon Ads/DSP connectors
- Cons: API call limits may affect high-volume users
Discover the benefits of data blending.
Connector Pricing Comparison
| Feature | Supermetrics | Funnel.io | Windsor.ai | Dataslayer | Coupler.io |
|---|---|---|---|---|---|
| Entry Price | $37/mo | ~$120/mo | $23/mo | €25/mo | $32/mo |
| Pricing Model | User+Source+Dest | Flexpoints | Account-based | API call-based | Account-based |
| Free Plan | Trial only | Yes (400 FP) | Yes (limited) | Yes (limited) | Yes (limited) |
| Unlimited Users | No | 5 on Free | Yes (Basic+) | Yes | No |
| Best For | Enterprise/Niche | Data Transform | Budget/BigQuery | Agencies | All-in-one |
Connectors to Watch
Some connectors are known to be fragile or have ongoing issues. Here’s what to monitor:
| Platform | Connector Type | Known Issue | Workaround |
|---|---|---|---|
| Shopify | Partner | REST Product APIs deprecated Feb 1, 2025 (public) / Apr 1, 2025 (custom); must migrate to GraphQL | Ensure connectors use GraphQL APIs; contact provider to verify |
| Facebook Ads | Partner | API v24 deprecated video feeds, legacy ASC; attribution windows changing Jan 2026 | Verify connector supports v24+; ROAS fields still available |
| TikTok Ads | Partner | Purchase Value shows $0 despite conversions (connector-layer bug) | Use Windsor.ai (claims fix); manual CSV reconciliation |
| LinkedIn Ads | Partner | Dec 2025: Daily breakdown data returning lifetime values; deprecated report types | Use reliable connectors like Power My Analytics; cross-check with exports |
How to Choose the Right Looker Studio Data Connector
With hundreds of data connectors available in Looker Studio, choosing the right one can feel overwhelming, especially when working with multiple clients and marketing channels.
1. Identify Your Reporting Needs
- List all the platforms and tools you and your clients use regularly — think Google Analytics, Facebook Ads, HubSpot, TikTok, Semrush, and more.
- Check Looker Studio’s Connector Gallery to see if there’s a native or third-party connector for each tool.
- If there’s no direct connector, look into API-based or custom connectors that can bring your data into Looker Studio.
2. Do Your Research
- Browse community forums and read reviews to see what other users say.
- Try out the platform to make sure it fits your agency’s needs.
- Check how often the connectors are updated to avoid bugs and issues.
- Look out for any known stability or security problems that could affect reporting.
3. Set a Realistic Budget
- Budgeting is important — especially if you work with multiple clients and data sources.
- Most third-party tools charge per data source, so costs can add up fast.
- Compare pricing plans from different providers.
- Don’t just look at the monthly fee — check the price per extra user or connector, since those are likely to drive up your costs as you scale.
4. Test Drive the Connectors
- Pick platforms that offer free trials and connect one or two frequently used data sources.
- Use the trial period to check if automated data refreshes and scheduling are supported.
- Consider your team’s technical comfort level — some platforms (like Power My Analytics or Avian) can have more complex interfaces.
5. Explore Data Analysis Features
- Many marketing reports need data prep before visualization — like filtering or combining data.
- Check if the connector supports built-in features for:
- Filtering
- Blending data sources
- Creating custom metrics and calculations
- These pre-processing tools also help reduce load times on Looker Studio dashboards.
6. Check for Potential Scalability Issues
- As your agency grows, connector limitations can cause problems.
- Choose connectors that can handle:
- Larger data volumes
- More client accounts
- Advanced custom calculations
7. Chat with the Platform’s Support Team
- Whether you’re new to reporting or a seasoned pro, problems can pop up.
- When you hit a roadblock, having responsive customer support makes all the difference.
- Don’t hesitate to reach out and test their support before you commit.
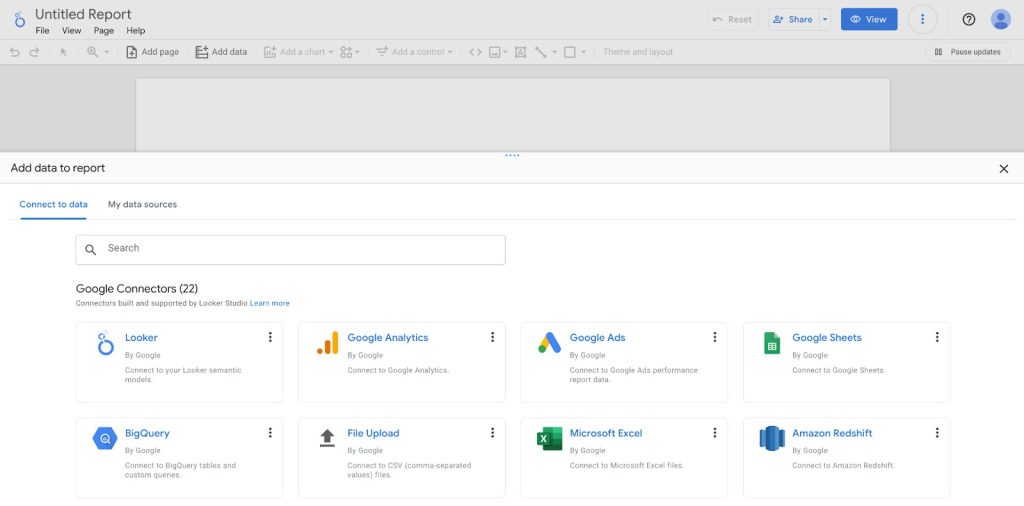
How to Connect Data Sources in Looker Studio
Whether you use native tools or third-party connectors, a proper setup is key to keeping data fresh and accurate in Looker Studio. A few simple steps can help you avoid errors and save time later.
- Sign in to Looker Studio with your Google account.

- On the homepage, click on the Create button and select Data source from the dropdown menu.

- Browse through the list of available connectors or use the search bar to find the specific data source you want to connect.

- After choosing your data connector, you’ll be prompted to authorize Looker Studio to access your data. Click Authorize and follow the on-screen instructions to grant the necessary permissions.

- You’ll then see a list of available fields from your data source. Here, you can rename fields, change data types, or create calculated fields as needed. This step may vary depending on the connector chosen.

- After configuring your data source, click on Create report. Looker Studio will prompt you to add the new data source to the report. Click Add to report to begin building your dashboard.

Click the following link to read our full Looker Studio tutorial for beginners.
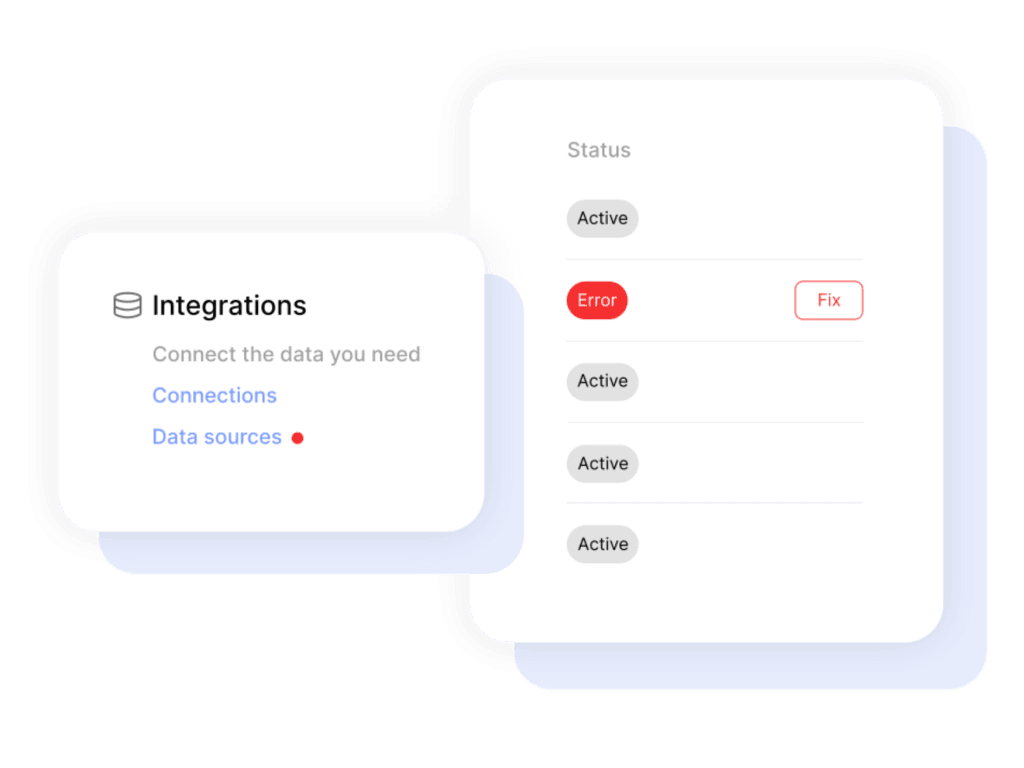
Tips to Prevent Looker Studio Connector Issues
Before you build any dashboard:
- Choose your connector carefully. Don’t assume all connectors offer full API access.
- Create a separate test report to validate schema.
Every month:
- Revalidate all fields and dimensions.
- Check API quotas and limits.
- Confirm scheduled refreshes are running on time.
Watch out for field mismatches:
- Reconnections can rename fields or remove dimensions without warning.
- This breaks filters, charts, or conditional formatting in your reports.
- Always check the field schema after reconnecting or swapping connectors.

Learn more about solving common problems in Looker Studio.
Alternatives to Third-Party Data Connectors
Running reports for multiple clients across multiple tools? It adds up fast — more platforms, more connectors, more fees, more headaches.
- Juggling Google Ads, Facebook, LinkedIn, HubSpot, Ahrefs — each one needs its own connector.
- Add in subscription costs, syncing issues, and the time it takes to build polished dashboards, and suddenly reporting feels like a chore instead of a value-add.
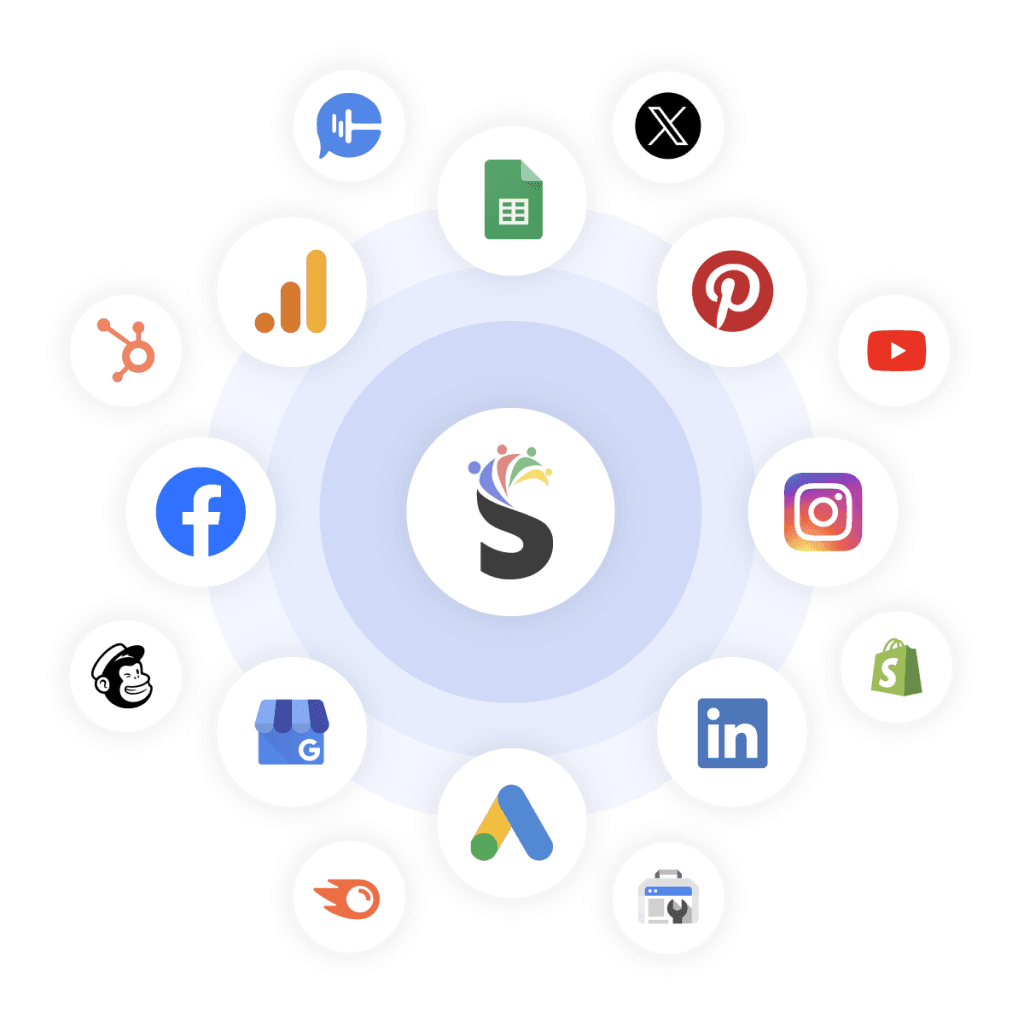
That’s where all-in-one marketing agency reporting tool like Swydo step in.
- There’s no need to manage a dozen connectors in Looker Studio.
- Swydo gives agencies one centralized platform built just for them.
- With 30+ direct integrations (paid, organic, social), you can plug in your data fast.
- Use drag-and-drop reporting and ready-made templates to build reports your clients will love — without the hassle.
Plug In Where It Counts
There’s no one-size-fits-all connector — the right pick depends on your agency’s size, client mix, and reporting workflow.
- Smaller agency? A budget-friendly third-party connector might hit the sweet spot.
- Larger, juggling lots of platforms? Go with a pro-level connector — or skip the chaos altogether with an all-in-one solution like Swydo.
Before locking in, take advantage of trials and demos. See how the connector plays with your tools, how fast the data refreshes, and how solid the support team is. A good fit saves hours. A bad one slows you down.
Looker Studio Connectors FAQ
Essential answers about data connectors for marketing dashboards and reports
Looker Studio connectors are data pipelines that pull information from external platforms (like Facebook Ads, Google Analytics, or Shopify) into Looker Studio for visualization in dashboards and reports. They eliminate manual data importing and enable automated reporting workflows.
Think of connectors as the bridges between your raw marketing data and your visual reports. If these bridges break, your dashboards stop updating with fresh data, making them useless for decision-making.
Over 1,200 connectors are available in the Looker Studio marketplace. These range from free native Google connectors to specialized third-party options. This extensive ecosystem covers virtually every major marketing platform, analytics tool, CRM system, and e-commerce solution.
The three main types are: Google Connectors (free, built by Google), Partner Connectors (paid, from companies like Supermetrics), and Community Connectors (built by independent developers for niche needs).
Not all connectors are free. Google’s native connectors (Google Ads, GA4, Search Console, etc.) are completely free to use. However, most connections to non-Google platforms require paid third-party connectors from providers like Supermetrics, Windsor.ai, or Funnel.io.
These paid connectors typically start around $30-40 per month for a single connection, with costs increasing based on the number of data sources, refresh frequency, and historical data needs. Enterprise-level connector solutions can run hundreds or thousands per month for agencies managing multiple clients.
Connecting data to Looker Studio takes just a few clicks:
1. Sign in to Looker Studio and click “Create” then “Data source”
2. Browse or search for your desired connector
3. Authorize access and configure connection settings
4. Select the specific account, property, or view to connect
5. Configure field types, create calculated fields if needed
6. Click “Create Report” to start building visualizations
The exact authorization process varies by connector, but typically involves granting permission to access your account on the external platform. For third-party connectors, you’ll need to first sign up with the provider’s service.
Looker Studio connectors solve four critical marketing reporting problems:
Data fragmentation — They centralize metrics from multiple platforms (Google, Facebook, LinkedIn, etc.) into unified dashboards.
Manual reporting — They automate what would otherwise require downloading CSVs, reformatting data, and building visualizations from scratch every reporting cycle.
Real-time updates — They provide current insights rather than outdated reports, with most connectors refreshing daily or on-demand.
Cross-channel analysis — They enable data blending between different marketing platforms, making it easier to identify which strategies are actually driving results.
These five free Google connectors provide the most value for marketing reports:
Google Analytics 4 — Essential for website and app performance tracking, capturing user behavior, traffic sources, and conversion data.
Google Ads — Provides comprehensive PPC campaign metrics including impressions, clicks, conversions, and creative asset performance.
Search Console — Delivers critical SEO metrics like organic impressions, clicks, CTR, and keyword rankings.
Google Sheets — Acts as a flexible connector for manual data input or importing metrics from platforms without dedicated connectors.
YouTube Analytics — Offers detailed video performance metrics including views, watch time, audience retention, and engagement.
These native connectors are reliable, update automatically, and require no additional subscription costs.
The Google Sheets connector is incredibly versatile for bringing custom data into Looker Studio:
1. Create a Google Sheet with your data (keep column headers in the first row)
2. In Looker Studio, create a new data source and select “Google Sheets”
3. Choose your spreadsheet and the specific worksheet
4. Confirm if your data has headers (it should) and click “Connect”
5. Configure data types for each column (text, number, date, etc.)
This method works great for client notes, campaign budgets, manual metrics, and data from platforms without direct connectors. The sheet auto-refreshes in Looker Studio whenever it’s updated, though you must manually maintain the data in the spreadsheet.
Connecting GA4 to Looker Studio is straightforward:
1. In Looker Studio, click “Create” then “Data source”
2. Select “Google Analytics 4” from the connector list
3. Choose the GA4 account, property, and data stream you want to connect
4. Click “Connect” in the upper right corner
5. Review the fields available and adjust data types if needed
6. Click “Create Report” to start building visualizations
The GA4 connector provides access to all standard reports and custom events. However, be aware that GA4’s data model is significantly different from Universal Analytics, using an event-based structure rather than session-based metrics. This requires adjusting your reporting approach if you’re migrating from older GA versions.
Data blending lets you combine metrics from different sources (like GA4 and Google Ads) in a single chart:
1. Add both data sources to your report
2. Create a chart using your primary data source
3. Click on the chart to select it
4. Open the Data panel and click “Blend data”
5. Add your secondary data source
6. Define a join key (the field that connects both sources, like Date)
7. Select the metrics you want from each source
This technique works best when sources share a common dimension like date, campaign name, or source/medium. It’s powerful for comparisons like ad spend vs. conversions or paid vs. organic traffic. Blended data is only available in the specific chart you create, not throughout the entire report.
For Facebook Ads reporting in Looker Studio, these connectors perform best:
Supermetrics — The most popular choice, offering detailed campaign, ad set, and ad-level metrics with daily refreshes. Pricing starts at $37/month for a single data source.
Funnel.io — Provides excellent data normalization and higher reliability during Facebook API changes. Free plan available for up to 4 connectors, with paid plans from $99/month.
Windsor.ai — Budget-friendly option with good core metrics coverage. Free plan available for a single connector, with paid plans from $23/month.
Facebook Ads connectors are notoriously fragile due to frequent API changes by Meta. For best results, verify that key metrics like CPC, CTR, and conversion data match what you see in the Facebook Ads Manager, as discrepancies can occur.
For comprehensive social media reporting, you’ll need these connectors:
For paid social: Dedicated connectors for each platform (Supermetrics for Facebook/Instagram Ads, TikTok Ads, LinkedIn Ads, etc.)
For organic social: Platform-specific connectors like Catchr for Instagram ($25.99/month), Dataslayer for Pinterest ($34.99/month), or Windsor.ai for TikTok ($23/month)
For the most cost-effective approach, consider cross-platform connector bundles from providers like Supermetrics or Funnel.io, which offer access to multiple social platforms under one subscription. Each connector can track metrics like engagement, followers, reach, and content performance, though API limitations mean some metrics may not match exactly what you see in native platform analytics.
For comprehensive SEO reporting in Looker Studio, these connectors deliver the best results:
Google Search Console (free, native) — Provides organic search impressions, clicks, CTR, and ranking position data directly from Google.
Ahrefs Rank Tracker — Tracks keyword rankings across 190+ countries and monitors SERP features. Requires Ahrefs Advanced plan ($449/month).
Semrush Position Tracking — Monitors keyword rankings across different devices or locations and tracks competitor movements. Requires Semrush Guru plan ($249.95/month).
Enhanced Search Console (Windsor.ai) — Automates GSC data exports with expanded historical data access. Free plan available, paid plans from $23/month.
For the most comprehensive SEO dashboards, combine organic search performance data from Search Console with technical SEO metrics and competitor insights from specialized tools like Ahrefs or Semrush.
Instead of juggling numerous individual connectors, consider these streamlined alternatives:
All-in-one reporting platforms: Solutions like Swydo offer 30+ direct integrations specifically designed for agencies, with ready-made templates and drag-and-drop reporting.
Cross-channel connector services: Providers like Supermetrics (100+ connectors), Funnel.io (500+ sources), and Windsor.ai (300+ sources) offer unified access through a single subscription.
Data warehousing approach: For larger agencies, using BigQuery as an intermediate storage layer lets you consolidate data from multiple sources before connecting to Looker Studio.
API aggregators: Services like Coupler.io pull data from various sources into Google Sheets, which then connects to Looker Studio as a single data source.
These alternatives reduce complexity and maintenance burden, especially for agencies reporting on numerous clients across diverse marketing channels. They also often provide more consistent data formatting across platforms, making cross-channel analysis more reliable.
When a connector stops working, these are the most common causes and fixes:
Authentication issues — The most frequent problem. Try reconnecting the data source to refresh access tokens, especially if it’s been several weeks since the last authentication.
API limits reached — Many platforms restrict how much data you can pull daily. Check connector logs for API limit errors, and consider scheduling less frequent refreshes.
Platform updates — Facebook, LinkedIn, and other platforms regularly change their APIs. Make sure your connector version is current, as outdated connectors often break after API changes.
Data source changes — If you’ve made changes to your account structure (like campaign naming or adding new conversion goals), reconnect the data source to refresh the schema.
Connector bugs — Check the connector provider’s status page for known issues, and consider temporary workarounds like exporting data to Google Sheets while waiting for a fix.
Implement these preventive measures to avoid connector problems:
Before building any dashboard:
• Create a separate test report to validate the data schema
• Document which fields you rely on for crucial visualizations
• Check connector documentation for known limitations
Regular maintenance:
• Proactively reconnect data sources every 60-90 days to refresh authentication
• Monitor for schema changes after platform updates
• Maintain backup data pipelines for critical reports (e.g., via Google Sheets)
When using Facebook or other unstable connectors:
• Use fixed schema exports where available
• Create calculated fields in Looker Studio rather than relying on pre-calculated metrics
• Maintain documentation of field names and expected values
Based on stability and consistent performance, these connectors tend to be most reliable:
Most reliable (rarely break):
• Google’s native connectors (Google Ads, GA4, Search Console)
• BigQuery connector
• Google Sheets connector
Generally stable (occasional issues):
• Supermetrics for LinkedIn Ads
• Funnel.io cross-platform connectors
• Semrush connectors
Less reliable (frequent updates needed):
• Facebook/Instagram connectors (due to Meta’s frequent API changes)
• TikTok connectors (emerging platform with evolving API)
• Shopify connectors (API rate limits cause frequent timeouts)
For mission-critical reports, build redundancy by maintaining alternative data pipelines for less reliable connectors, such as scheduled exports to Google Sheets as a backup data source.
When reconnecting causes broken charts, follow this recovery process:
1. Identify what changed — Compare the current field list with your documentation to spot renamed or missing fields. Look for subtle changes like “Cost” becoming “Ad Cost” or dimensionality changes.
2. Fix missing metrics — For missing fields, check if they’re available under different names. If truly gone, create calculated fields to reconstruct them where possible.
3. Update chart configurations — Edit broken charts to point to the new field names. Pay special attention to filters, which often break after reconnection.
4. Check data blending — Reconnecting often breaks data blending setups. Verify join keys still align properly between sources.
5. Review for data inconsistencies — After fixing technical issues, verify that metrics show expected values. Look for discontinuities in trends that might indicate definition changes.
Slow loading times in Looker Studio usually stem from these common issues:
Too much data — Loading large date ranges or high-granularity data (hourly stats for a full year) overwhelms the connector. Fix by filtering to only necessary date ranges and using data aggregation.
Too many visualizations — Having 20+ charts on a single page forces multiple simultaneous data requests. Break complex dashboards into multiple pages with 5-7 visualizations each.
Inefficient filters — Page-level filters require processing all data before filtering. Use data source filters instead, which filter before data loads.
Complex calculated fields — Nested calculations dramatically slow processing. Simplify formulas or move calculations upstream to your data source when possible.
Third-party connector limitations — Some connectors have throttling or processing constraints. Switch to more robust connectors or consider data warehousing solutions like BigQuery for complex reporting needs.
Skip the connector chaos. Swydo gives you all-in-one reporting without the Looker Studio headaches.
Start Your Free Trial Today