
Your B2B marketing team just closed a $2.3 million deal. But nobody knows which campaigns, touchpoints, or channels actually drove that revenue.
You know this story well. You’re drowning in data from, HubSpot, Google Ads, LinkedIn, email platforms, and a dozen other tools. Yet you can’t answer basic questions like “What’s our customer acquisition cost?” or “Which campaigns generate the highest lifetime value?”
This chaos isn’t just frustrating – it’s expensive. McKinsey research shows that data-driven commercial teams that blend personalized customer experiences with generative AI are 1.7x more likely to increase market share. Meanwhile, organizations stuck with manual reporting spend countless hours weekly on spreadsheet gymnastics.
The solution? Purpose-built B2B reporting tools that speak your language, understand your sales cycles, and connect the dots between marketing spend and revenue impact.
What Makes B2B Reporting Different and Why Generic Tools Fall Short
Most marketing teams think they can use any analytics tool for B2B reporting. This assumption costs them valuable insights and leads to poor decision making. B2B reporting has unique requirements that generic tools simply can’t meet.
B2B reporting differs fundamentally from B2C reporting because B2B sales operate on completely different principles.
Complex Decision-Making Units
Instead of one person who clicks “buy,” you track 6-10 stakeholders across multiple departments. Each requires different content and touchpoints. Think about your last big deal – how many people were involved in that decision?
Extended Sales Cycles
Your prospect might download a whitepaper in January, attend a webinar in March, request a demo in June, and finally purchase in September. Google Analytics can’t track that attribution journey effectively.
Account-Based Everything
B2B success depends on account-level insights. You need to see how IBM’s marketing team engages differently from Microsoft’s procurement department, even when they evaluate the same solution.
Revenue Attribution Complexity
A single B2B deal might involve organic search discovery, paid social nurturing, email sequences, multiple demos, proposal negotiations, and executive meetings. Which touchpoint gets credit for the $500K contract? This requires sophisticated attribution modeling.
Generic analytics tools like Google Analytics or Facebook Insights simply weren’t designed for this complexity. They’ll show you website traffic and form fills, but they can’t connect those metrics to actual revenue or account progression.
Essential Features Every B2B Reporting Tool Must Have
Not all reporting tools are created equal, especially when it comes to B2B marketing. Generic analytics platforms often lack the specialized features that B2B teams need to track complex sales cycles and account-based strategies. Here are the non-negotiable features your B2B reporting tool must include.
Multi-Touch Attribution Models
This is non-negotiable. Your tool needs to track and credit every touchpoint in the buyer’s journey, not just first-click or last-click.
When your prospect finally converts after nine months of nurturing, which touchpoint deserves the credit? The initial Google search? The LinkedIn ad that brought them back three months later? The webinar that convinced them to request a demo?
Look for platforms that support:
- Linear attribution (equal credit to all touchpoints)
- Time-decay models (more credit to recent interactions)
- U-shaped attribution (emphasis on first touch and conversion)
- Custom attribution (weighted based on your specific sales process)
Account-Based Reporting
Individual lead tracking isn’t enough anymore. Your tool must aggregate data at the account level. Think about it – when IBM evaluates your solution, you might have touchpoints with their IT director, procurement manager, and three different department heads.
Your reporting tool needs to show you:
| Metric | Why It Matters |
|---|---|
| Total account engagement across all contacts | See the complete picture of account interest |
| Account progression through sales stages | Track how accounts move through your funnel |
| Cross-contact interaction patterns | Identify key influencers and decision makers |
| Account-based campaign performance | Measure ROI at the account level, not just lead level |
Pipeline Integration and Revenue Mapping
The real value happens when marketing data connects to actual deals. You can generate a thousand leads, but if they don’t turn into revenue, what’s the point?
Essential capabilities include:
- Direct CRM integration with Salesforce, HubSpot, or Pipedrive
- Opportunity-to-campaign connections so you know which marketing efforts created which deals
- Win/loss analysis for each campaign and channel
- Revenue predictions based on pipeline data
Campaign Performance Across Full Funnel
B2B campaigns don’t end at lead generation. That’s just the beginning. You need to track performance metrics throughout your entire sales funnel.
What metrics should you track? Here’s what actually matters:
- Cost per Marketing Qualified Lead (MQL) – not just any lead, but quality leads
- MQL to Sales Qualified Lead (SQL) conversion rates – are your leads actually sales-ready?
- SQL to Opportunity conversion rates – do your qualified leads become real opportunities?
- Average deal size by campaign source – which campaigns generate bigger deals?
- Customer lifetime value by acquisition channel – which channels bring the most valuable customers?
Cross-Platform Data Integration
Your prospects interact with you everywhere. They see your LinkedIn ad, visit your website, download a whitepaper, attend a webinar, and talk with your sales rep.
Your reporting tool should pull data from:
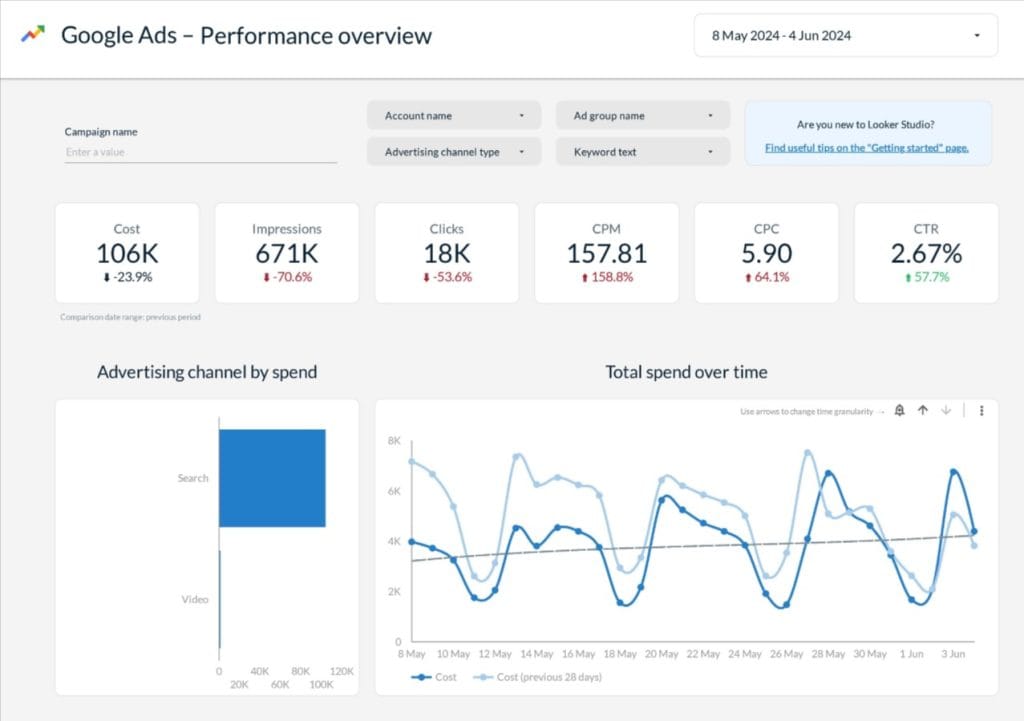
- Paid advertising platforms like Google Ads, LinkedIn, and Facebook
- Email marketing systems such as Mailchimp, Pardot, and Marketo
- Content management systems and landing page builders
- Event and webinar platforms
- Social media management tools
- Customer support and chat platforms
Top B2B Reporting Tools – What Makes Them Essential for Marketing Teams
The B2B reporting market offers dozens of platforms, each claiming to be the perfect solution. However, only a handful truly understand the complexities of B2B marketing and sales cycles. These platforms have proven themselves in real-world B2B environments and offer the specialized features that marketing teams actually need.
1. Microsoft Power BI – The Enterprise Integration Champion
Pricing: $14-$24 per user/month
Best For: Organizations deeply embedded in Microsoft ecosystem
Power BI dominates enterprise B2B reporting because it connects seamlessly with existing business systems. According to Gartner’s 2024 Magic Quadrant, Power BI is a Leader with strong execution ability and dominates user adoption across enterprises.
Why B2B Marketing Teams Choose Power BI
If your organization already uses Microsoft Office, Dynamics 365, or Azure, Power BI becomes a natural choice. But is it right for your specific needs?
- Native Dynamics 365 integration provides complete customer lifecycle visibility
- Advanced DAX formulas calculate complex B2B metrics like customer acquisition cost and lifetime value
- Real-time dashboard updates keep sales and marketing teams aligned with 15-second refresh intervals
- Row-level security means your account managers only see their territory data
While powerful for data analysis, Power BI requires significant technical expertise for complex B2B attribution models. Expect 2-3 months for full implementation. Do you have the internal resources to handle that timeline?
2. Tableau – The Visualization Powerhouse
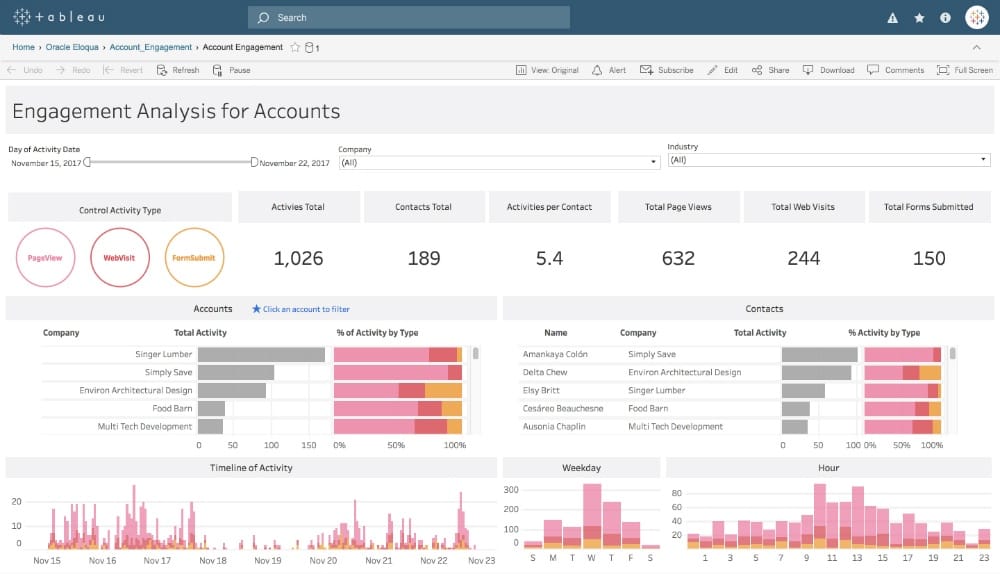
Pricing: $15-$75 per user/month
Best For: Data-driven marketing teams requiring sophisticated analysis
Forrester’s Q2 2025 Wave report consistently ranks Tableau as a leader in business intelligence platforms, particularly for organizations prioritizing advanced analytics.
B2B Marketing Advantages
Tableau excels when you need to present complex data in compelling ways. Think about your last executive presentation – could you have made a stronger case with better visualizations?
Key strengths include:
- Drag-and-drop attribution models that make complex analysis accessible
- Account hierarchy views that show patterns across organizational structures
- Predictive analytics features that predict pipeline progression and deal likelihood
- Embedded analytics for custom dashboards in executive presentations
Note for Salesforce Users: If your organization already uses Salesforce CRM, consider Tableau CRM (formerly Einstein Analytics), which embeds Tableau technology directly into Salesforce. While more expensive per user, it eliminates integration complexity for Salesforce-native data.
3. HubSpot Reporting – The All-in-One Solution
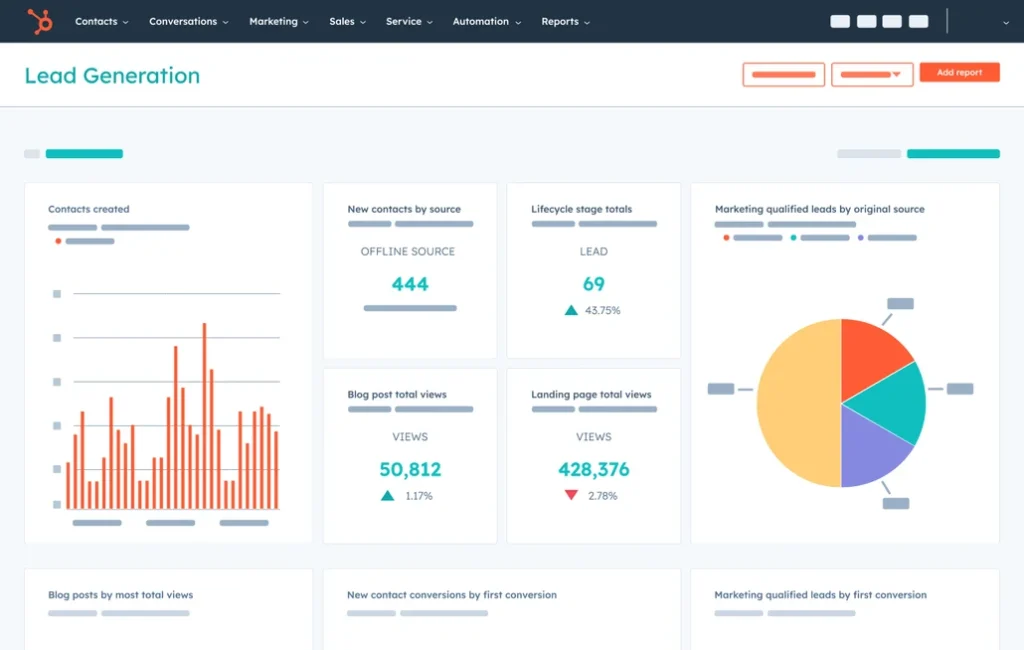
Pricing: $800-$3,600/month
Best For: SMBs wanting integrated marketing and sales reporting
HubSpot’s built-in reporting eliminates data integration headaches by housing marketing automation, CRM, and analytics in one platform.
Why It Works for B2B Marketing
If you’re already using HubSpot for marketing automation or CRM, their reporting features become incredibly valuable. But what if you’re not?
Here’s what makes HubSpot reporting effective:
| Feature | Benefit |
|---|---|
| Attribution reports | Track deals back to original marketing sources automatically |
| Campaign analysis | See ROI across email, social, paid ads, and content |
| Custom report builder | Create account-based dashboards without technical skills |
| Sales and marketing alignment | Shared visibility into pipeline progression |
The Trade-off
While convenient, HubSpot’s reporting capabilities can’t match dedicated BI platforms for complex analysis or external data integration. Are you willing to trade advanced features for simplicity?
4. Looker (Google Cloud) – The Data Modeling Expert
Pricing: $66,600/year for 10 users
Best For: Large marketing teams with complex data requirements
Looker’s strength lies in its semantic layer – a unified data model so everyone defines metrics consistently across teams.
Advanced B2B Features
- LookML language handles complex B2B relationships and hierarchies
- Git-based version control enables team development of report models
- Advanced governance controls meet enterprise compliance requirements
- Multicloud architecture supports hybrid deployments
5. Swydo – The Marketing Agency Specialist
Pricing: $69-$249 per month
Best For: Marketing agencies and teams managing multiple B2B clients
Swydo specializes in automated reporting for marketing agencies, with 35+ native integrations designed specifically for multiclient B2B environments.
Agency-Focused Features
- White-label reporting presents insights under your brand
- Multi-client dashboards track performance across different B2B accounts
- Automated report scheduling delivers insights to clients without manual work
- Campaign performance templates speed up reporting for common B2B scenarios
Why Agencies Choose Swydo
Unlike enterprise BI tools requiring months of setup, Swydo delivers professional B2B reports in hours, not weeks. The platform understands agency workflows and client presentation requirements.
6. ThoughtSpot – The Conversational Analytics Pioneer
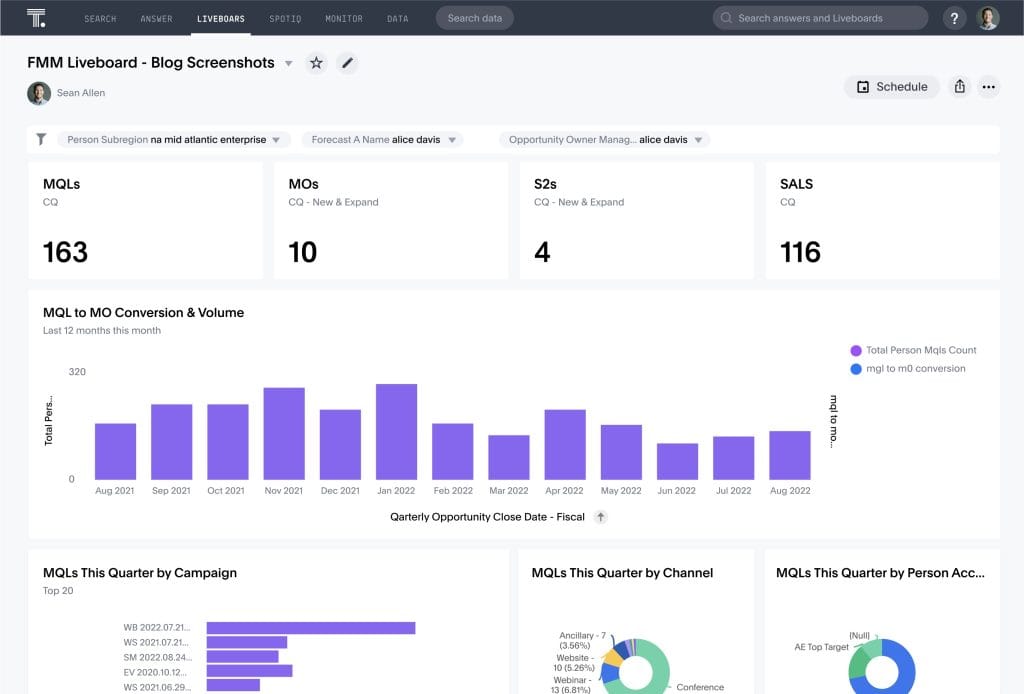
Pricing: Custom enterprise pricing
Best For: Marketing teams wanting instant access to complex data insights
ThoughtSpot represents the future of B2B analytics with natural language queries that eliminate the traditional “request → wait → analyze” cycle.
Game-Changing B2B Features
- Natural language search lets you type “Show me accounts with less engagement this quarter”
- Automated anomaly detection flags pipeline risks before they impact revenue
- Proactive insight delivery surfaces opportunities and threats via Slack or Teams
- Agentic AI features provide recommendations without human prompts
ThoughtSpot’s AI can identify patterns human analysts miss, like subtle changes in buyer behavior that predict deal outcomes.
How to Choose the Right Tool for Your B2B Marketing Team
Selecting the wrong reporting tool can set your marketing team back months and waste thousands in implementation costs. The key is matching your tool choice to your team size, technical capabilities, and business objectives. Different types of B2B organizations have different reporting needs, and what works for a startup won’t necessarily work for an enterprise.
Small B2B Marketing Teams (1-5 people, under $10M revenue)
Recommended: HubSpot Reporting or Swydo
Decision Logic
Limited resources require tools that work immediately without extensive setup. Focus on integrated solutions that eliminate data integration challenges.
Ask yourself these questions:
- Do you already use HubSpot for marketing automation?
- How important is white-label reporting for client presentations?
- Can you justify dedicated BI tool costs with your current marketing spend?
Mid-Market B2B Teams (5-20 people, $10M-$100M revenue)
Recommended: Power BI or Looker
Decision Logic
Complex business needs require more sophisticated analysis capabilities, but you still need reasonable implementation timelines.
Evaluation Criteria
Consider these factors when making your decision:
| Factor | Questions to Ask |
| Data integration requirements | How many external platforms need connection? |
| Technical expertise available | Do you have analysts who can build complex models? |
| Compliance requirements | What industry regulations affect your reporting needs? |
Enterprise B2B Marketing (20+ people, $100M+ revenue)
Recommended: Tableau, ThoughtSpot, or Looker
Decision Logic
Complex organizational structures and massive data volumes require enterprise-grade capabilities and scalability.
Strategy Factors
- Multi-region requirements – Can the platform handle global data residency rules?
- Advanced analytics needs – Do you need predictive models and machine learning?
- Executive reporting – What level of visualization sophistication do stakeholders expect?
Industry-Specific Considerations
SaaS and Technology Companies
Need platforms that track product usage data alongside marketing metrics. Essential features include cohort analysis, expansion revenue tracking, and churn prediction models.
Professional Services
Require project-based reports that connect marketing efforts to specific engagements and client accounts. Look for platforms that support custom attribution models based on service delivery timelines.
Manufacturing and Distribution
Must integrate with ERP systems and track long sales cycles that span multiple fiscal quarters. ESG compliance reporting grows more important for sustainability metrics.
Financial Services
Face strict regulatory requirements that include Sarbanes-Oxley compliance. Need platforms with audit trail features and data governance controls.
Red Flags – What to Avoid When Selecting B2B Reporting Tools
Many B2B marketing teams make expensive mistakes when choosing reporting tools. They get swayed by flashy demos, impressive feature lists, or persuasive sales presentations, only to discover later that the tool doesn’t meet their actual needs. Watch out for these common warning signs that indicate a platform might not be right for your B2B marketing team.
The Pretty Dashboard Trap
Flashy visualizations don’t equal actionable insights. Avoid tools that prioritize aesthetics over analytical depth.
Ask vendors this specific question: “Show me exactly how this platform tracks a deal from first touch to closed-won across multiple contacts and touchpoints.”
If they can’t demonstrate this clearly, keep looking.
Limited Integration Capabilities
If a platform can’t connect to your core marketing stack within 30 days, find another solution. B2B data decays at 30% annually – you can’t afford delays in data integration.
One-Size-Fits-All Pricing
Be wary of platforms with rigid user tiers that don’t match your team structure. B2B marketing teams often need a few power users with full access and many stakeholders requiring view-only capabilities.
Vendor Lock-In Risks
Make sure your chosen platform supports data export and API access. Common lock-in tactics include:
- Proprietary data formats
- Limited export capabilities
- Restrictive contract terms
Security and Compliance Gaps
Business data breaches carry significant costs and risks for B2B organizations. Average breach costs reach $4.44 million globally, which makes security a critical factor in tool selection. Verify SOC 2 Type II certification, encryption standards, and compliance with relevant regulations.
Key Takeaway
The B2B marketing landscape demands sophisticated reporting capabilities that match the complexity of modern buyer journeys. Generic analytics tools simply can’t provide the account-based insights, multi-touch attribution, and pipeline visibility that drive strategic decision making.
Whether you choose an enterprise platform like Tableau for advanced analytics, an integrated solution like HubSpot for simplicity, or a specialized tool like Swydo for agency workflows, the key is selecting a platform that aligns with your team’s capabilities and business objectives.
The companies winning in B2B marketing don’t necessarily spend more than their competitors. They measure more effectively. They understand which activities drive revenue, which accounts offer expansion potential, and how to optimize their marketing investments for maximum impact.
Your next million-dollar deal is in the data. The question is whether you have the right tools to find it.
B2B Reporting Tools FAQ
Quick answers to your most pressing B2B analytics questions
A B2B reporting tool is specialized software that tracks and analyzes marketing and sales data across long sales cycles involving multiple decision-makers. Unlike consumer analytics that track individual purchases, B2B tools connect marketing activities to actual revenue by following accounts (not just individuals) through months-long buying journeys.
Google Analytics shows website traffic and basic conversions, but it can’t track the complex B2B buyer journey. It doesn’t aggregate multiple contacts from the same company, can’t attribute revenue across 6-9 month sales cycles, and won’t show you which accounts are progressing through your pipeline. For serious B2B marketing, you need purpose-built tools.
Excel requires manual data entry from multiple platforms, creates version control nightmares, and can’t update in real-time. You’ll spend hours weekly maintaining spreadsheets instead of analyzing results. B2B reporting tools automate data collection, eliminate human error, and free your team to focus on strategy instead of data entry.
B2C reporting tracks individual consumers making quick purchase decisions, while B2B reporting tracks entire organizations with 6-10 stakeholders making decisions over months. B2B requires account-level views (not just lead-level), multi-touch attribution across long sales cycles, and revenue connection to marketing activities—capabilities most B2C tools don’t have.
Yes. Your CRM tracks sales activities and pipeline, but it doesn’t automatically connect to your marketing platforms (Google Ads, LinkedIn, email tools, etc.). B2B reporting tools bridge this gap by pulling data from both marketing and sales systems to show which marketing activities actually drive revenue.
There’s no single “best” tool—it depends on your team size and tech stack. Small teams (1-5 people) benefit from HubSpot or Swydo for quick setup. Mid-market teams (5-20 people) typically choose Power BI or Tableau for deeper analysis. Enterprises (20+ people) often select Looker or ThoughtSpot for advanced capabilities and scale.
Choose Power BI if you use Microsoft products (Office, Dynamics 365, Azure) and need cost-effective integration at $14-24/user/month. Choose Tableau if you need superior data visualization, drag-and-drop analytics, and predictive features at $15-75/user/month. If you use Salesforce, consider Tableau CRM for native integration.
Pricing varies widely: Swydo costs $69-249/month total, HubSpot runs $800-3,600/month, Power BI and Tableau charge $14-75 per user monthly, and enterprise platforms like Looker start around $66,600 annually. Budget 1.5-2x the platform cost for implementation, training, and maintenance.
HubSpot reporting works well if you use HubSpot for marketing automation and CRM, as everything lives in one system. However, it has limitations for complex multi-touch attribution and can’t match dedicated BI platforms for advanced analysis. It’s ideal for small-to-mid-sized teams prioritizing simplicity over deep analytics.
Swydo is specifically designed for agencies, offering white-label reporting, multi-client dashboards, and automated report scheduling at $69-249/month. It connects to 35+ marketing platforms and delivers professional reports in hours instead of days. This lets agencies scale client reporting without hiring additional staff.
HubSpot and Swydo are the easiest, with most users creating useful reports within days. Power BI and Tableau require 2-4 weeks of training for basic proficiency. Enterprise platforms like Looker and ThoughtSpot need 1-2 months of training, though ThoughtSpot’s natural language search makes it easier than traditional BI tools.
Multi-touch attribution assigns credit to all touchpoints in the buyer journey, not just the first or last interaction. When a prospect takes 9 months and 15 touchpoints to convert, this shows which channels (organic search, paid ads, webinars, emails) actually influenced the deal, helping you invest marketing budget wisely.
Account-based reporting groups all contacts from the same company together instead of treating them as separate leads. When three people from IBM engage with your content, account-based reporting shows you “IBM” as one account with combined engagement data, giving you the complete picture of organizational interest.
Simple tools like HubSpot or Swydo work within days. Power BI and Tableau typically take 4-8 weeks for basic setup and 2-3 months for full implementation. Enterprise platforms like Looker need 2-6 months depending on data complexity and customization requirements. Plan accordingly to avoid reporting gaps.
Yes, all major B2B reporting tools integrate with Salesforce. Power BI, Tableau, Looker, and HubSpot all offer native Salesforce connectors. Tableau CRM (formerly Einstein Analytics) is built directly into Salesforce for the deepest integration. This connection is essential for linking marketing activities to actual revenue.
At minimum, connect your CRM (Salesforce, HubSpot), advertising platforms (Google Ads, LinkedIn), email marketing (Mailchimp, Pardot), and website analytics (Google Analytics). Advanced setups also pull from webinar platforms, chat tools, social media, content management systems, and customer support platforms for complete visibility.
It depends on the tool. HubSpot and Swydo require minimal technical skills—if you can use Excel, you can use these. Power BI and Tableau need moderate analytical skills for custom reports. Looker requires SQL knowledge for advanced features. ThoughtSpot’s natural language search reduces technical barriers significantly.
The biggest mistake is tracking vanity metrics (website visits, social likes) instead of revenue-connected metrics. Focus on metrics that matter: cost per qualified lead, lead-to-opportunity conversion rate, pipeline value by source, average deal size by channel, and customer acquisition cost. Always connect marketing activities to actual revenue.
Track these critical metrics: cost per Marketing Qualified Lead (MQL), MQL-to-SQL conversion rate, SQL-to-opportunity conversion rate, average deal size by source, sales cycle length by channel, customer acquisition cost (CAC), customer lifetime value (LTV), and marketing attribution by revenue. These directly connect marketing spend to business outcomes.
Connect every closed deal back to its original marketing source using multi-touch attribution. Calculate total marketing spend divided by revenue generated from marketing-sourced deals. B2B reporting tools automate this by linking CRM opportunity data to marketing campaign data, showing executives exactly which marketing investments drive revenue.
Review campaign performance weekly to catch issues early and optimize active campaigns. Analyze pipeline and conversion metrics monthly to identify trends. Conduct deep strategic reviews quarterly to assess channel effectiveness and adjust annual budget allocation. Set up automated alerts for significant changes in key metrics.
Absolutely. B2B reporting tools show which channels deliver customers at the lowest cost and highest lifetime value. By identifying underperforming channels and doubling down on efficient ones, most companies reduce CAC by 15-30% within 6-12 months. The key is having accurate attribution data to make informed decisions.
Your reporting should answer: Which campaigns generate the most revenue (not just leads)? What’s our true customer acquisition cost by channel? Which accounts are most engaged right now? How long does our average sales cycle take? Which touchpoints most influence deal closure? Where should we invest more budget? What’s preventing pipeline conversion?
Create role-specific dashboards showing metrics each person cares about—account managers see their territory performance, executives see pipeline forecasts. Schedule regular report review meetings. Demonstrate quick wins by identifying one actionable insight that improves results. Designate power users as internal champions. Make reporting part of your weekly workflow.
Yes, if you’re spending significant money on marketing. Companies using B2B reporting tools typically see 15-30% improvement in marketing efficiency within the first year by cutting underperforming channels and scaling winners. The time saved on manual reporting alone often justifies the investment—most teams reclaim 10-20 hours weekly.
Swydo connects all your B2B marketing platforms and delivers automated client reports in minutes, not hours.
Start Your Free Trial Today