Stop manual reporting. Show your clients clear, data-driven results with automated Facebook Insights reports.
Try our Facebook Insights reporting tool and show your clients the real results of your Facebook marketing expertise.
▶ Get startedFree for 14 days
No credit card required
Cancel anytime
 2500+Customers
 80+Countries
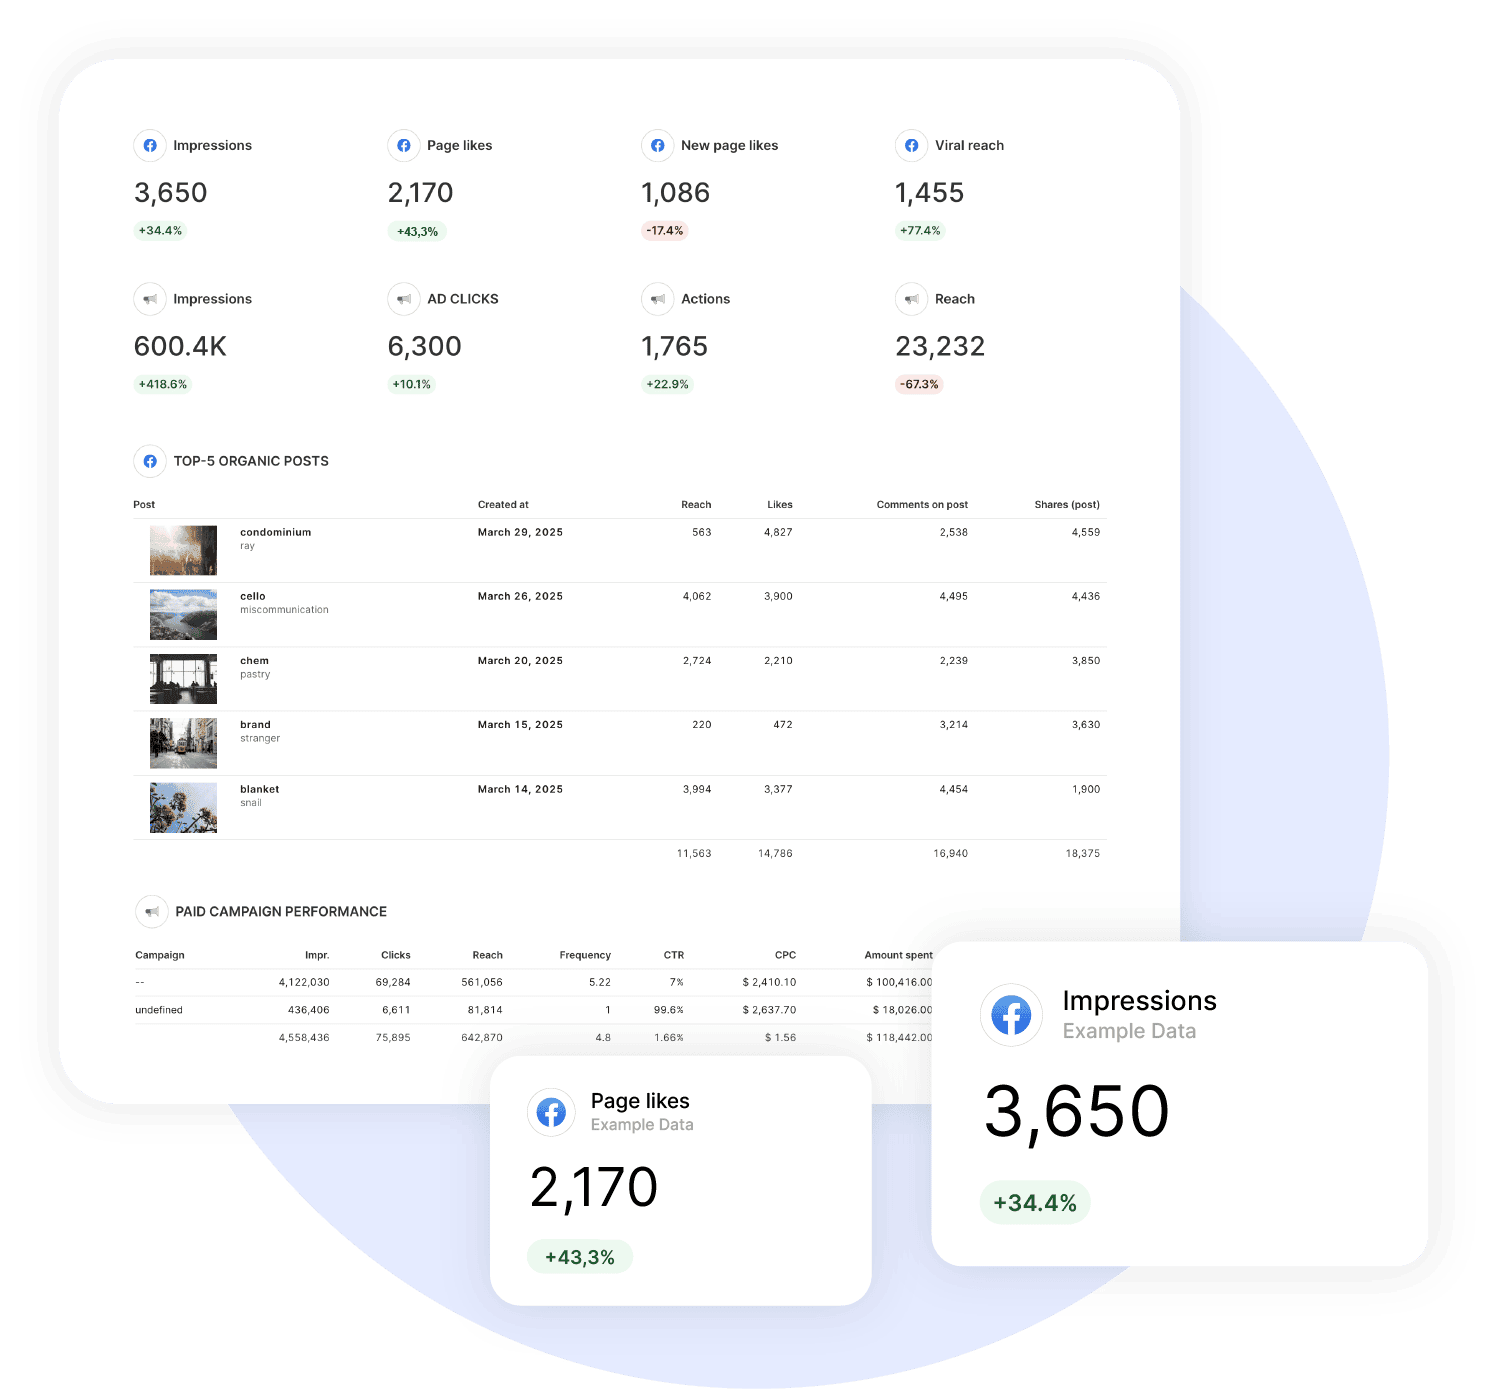
How it works

1. Select
Choose one of our predefined templates or create your own

2. Connect
Connect your data sources

3. Customize
Customize your data to meet your client’s needs

4. Share
Schedule and share a dashboard or PDF report with your team or clients
Heads up: API changes may affect what's shown here.
For the most accurate info, check the Advanced tab in your Swydo account. Missing a metric? Contact Support.
Effortless Facebook Reporting Tool That Saves Time
Need a simple way to create a Facebook Page report without juggling spreadsheets? Swydo’s Facebook Insights reporting software saves you time. Turn hours of manual tasks into minutes with our pre-built Facebook Page report templates.
Present your Facebook organic KPIs with Swydo’s data visualization tool, deliver a polished Facebook Insights report or interactive dashboard, and highlight results without the hassle. Update one master template, and every connected report refreshes automatically—no repeated tasks, no errors.
Save hours every monthTurn Your Marketing Objectives into Actual Results
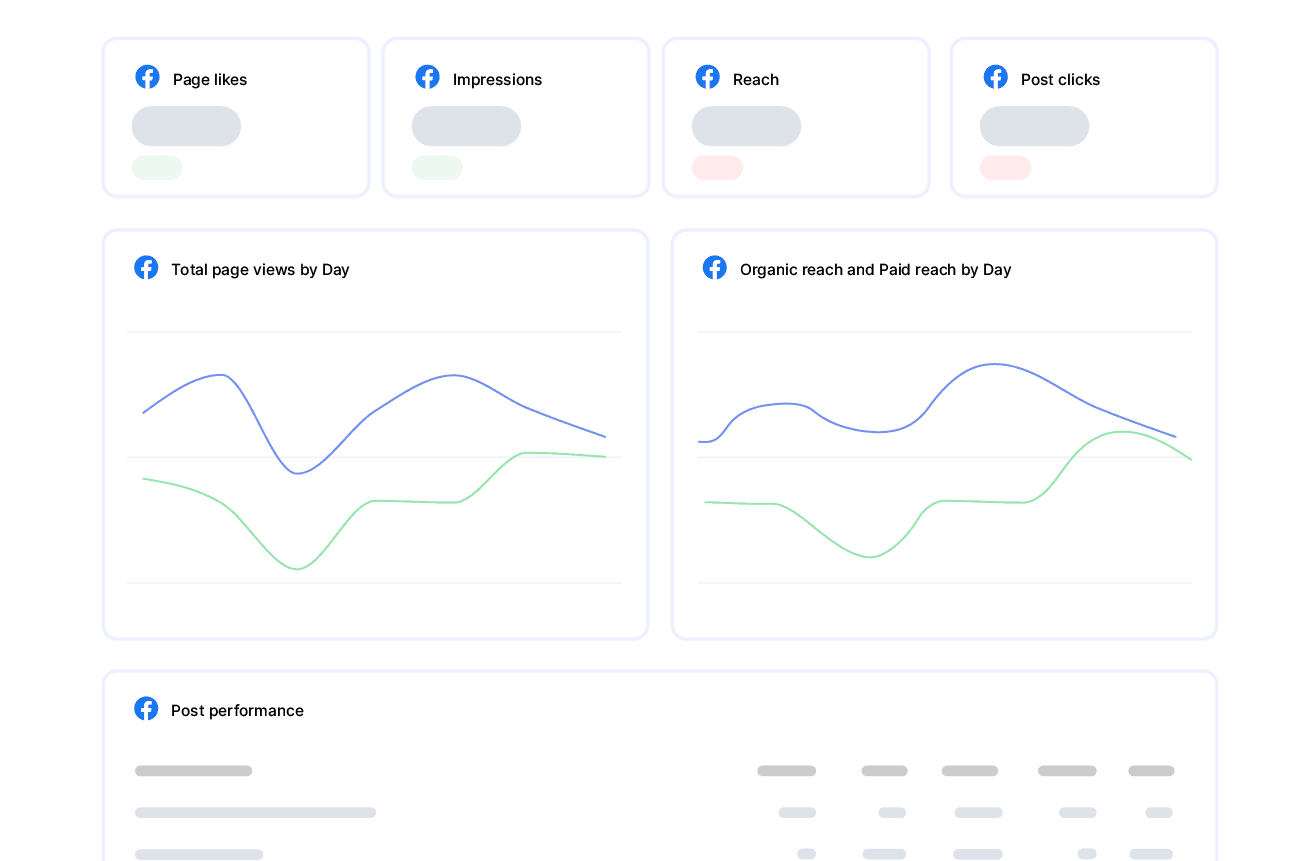
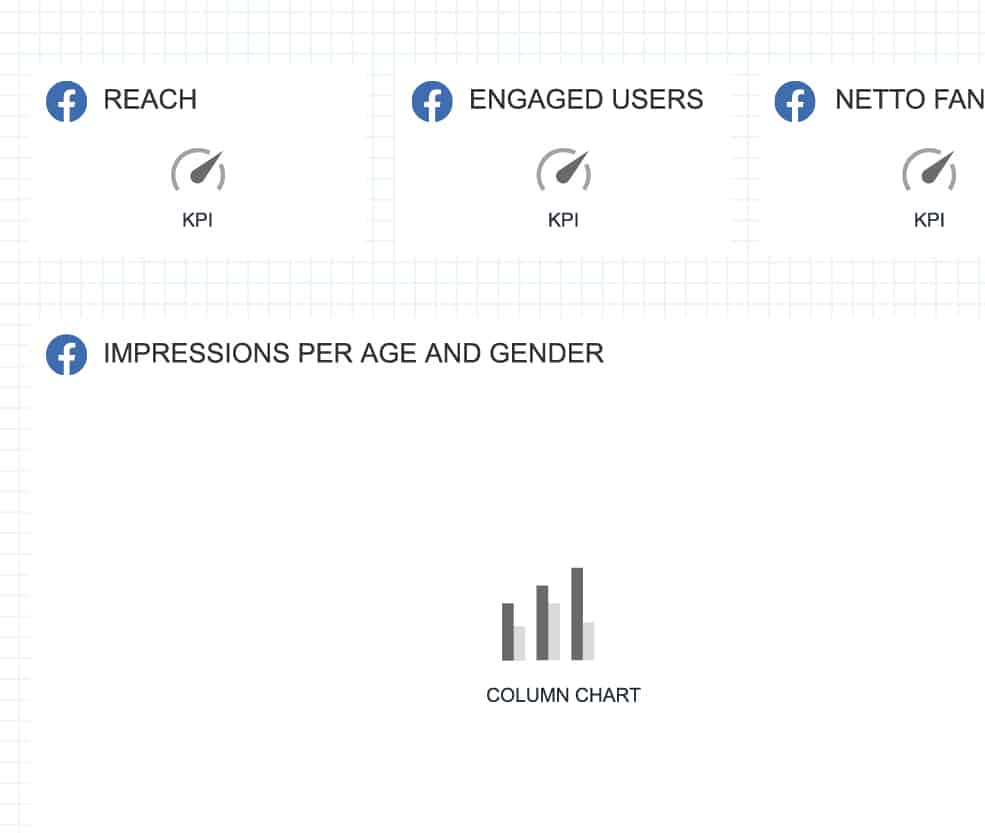
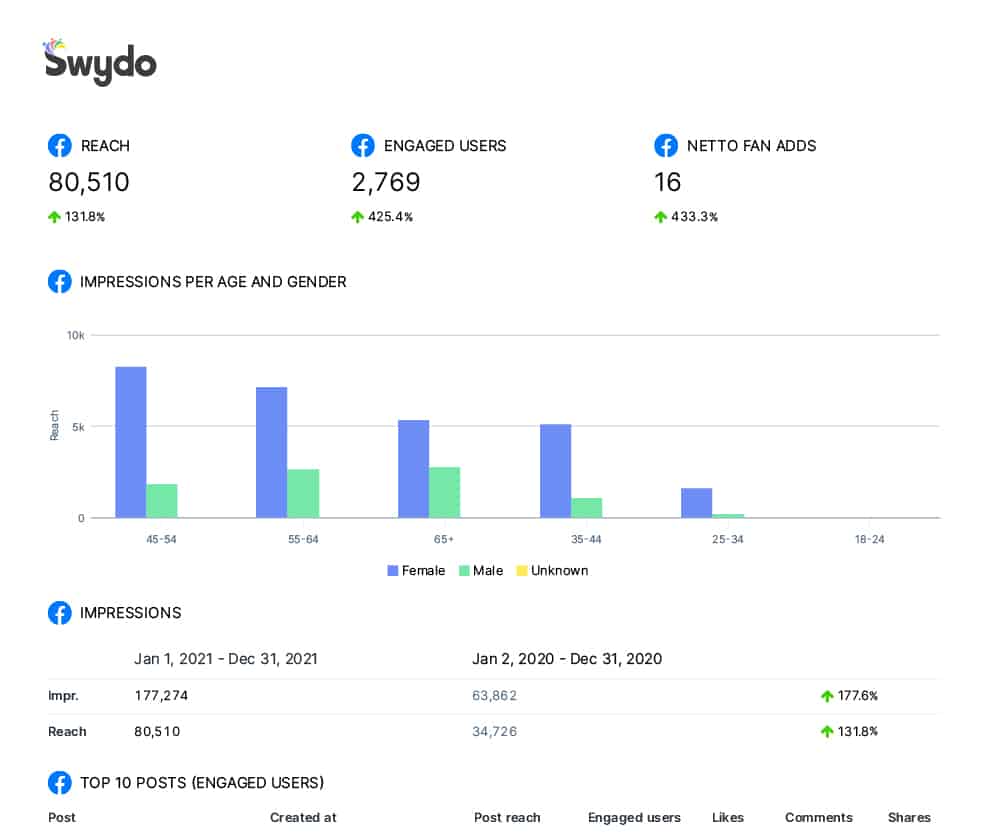
Use our goal tracking and monitoring tools to keep clients updated on key Facebook Page organic metrics like Reach, Engagement, Page Views, Video Views and more. Quickly see whether you’re hitting your KPIs or need to pivot. This eliminates guesswork and supports data-driven decisions.
Turn raw data into clear insights
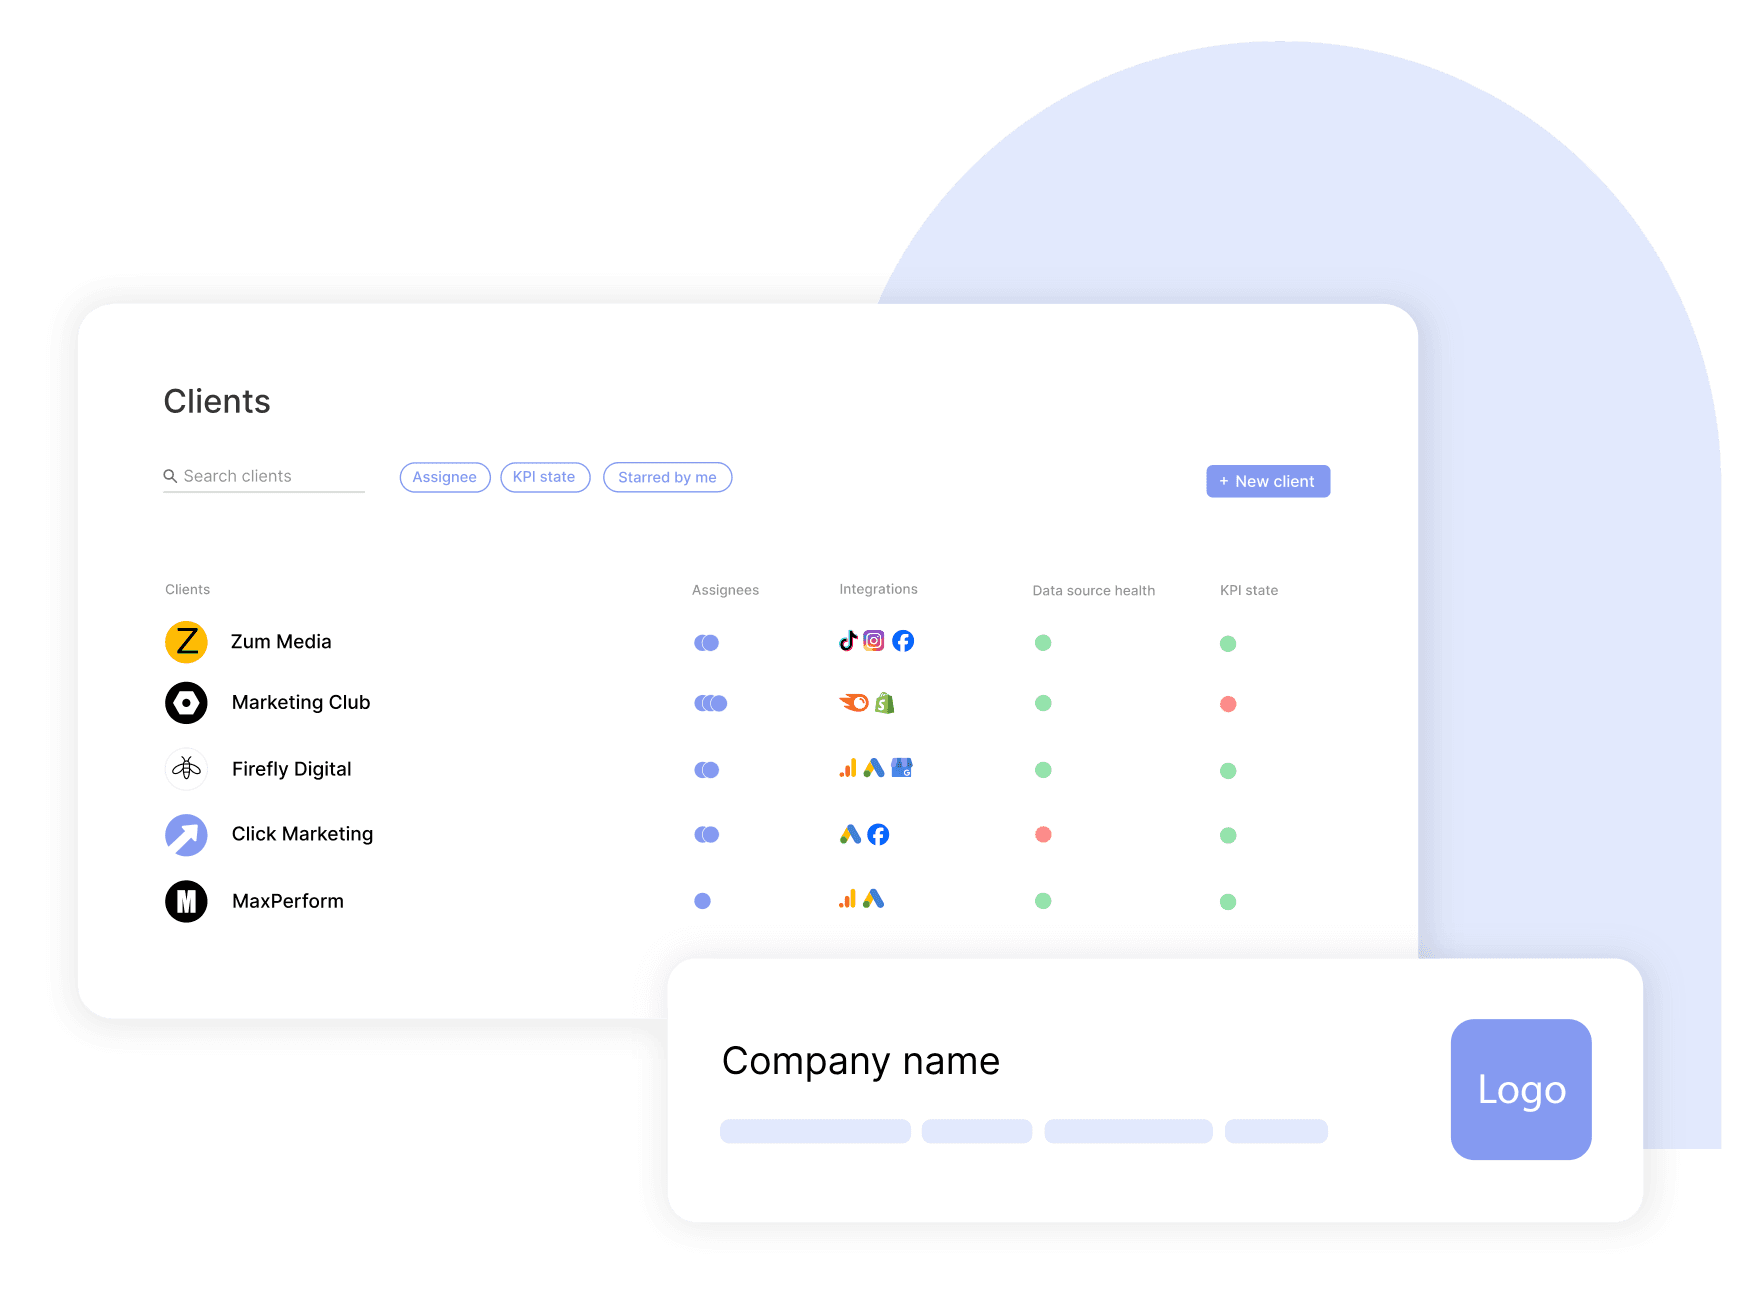
Easily Scale & Manage Multiple Clients
Manage multiple clients with ease and precision. Swydo equips agencies to onboard clients quickly with custom templates, update every client Facebook analytics report in a single click, and assign team roles for seamless collaboration. Control access, personalize delivery, and free up time to focus on growth—all from one platform.
Start scaling your reporting effortsPresent Your Brand with Confidence
Create white label Facebook Page reports that reflect your agency’s look and feel. Include your logos, colors, and layouts to match your style. Use interactive dashboards on your custom domain URL for added trust. Show your expertise while delivering professional, ROI-focused updates.
Showcase your brand in every Facebook Insight report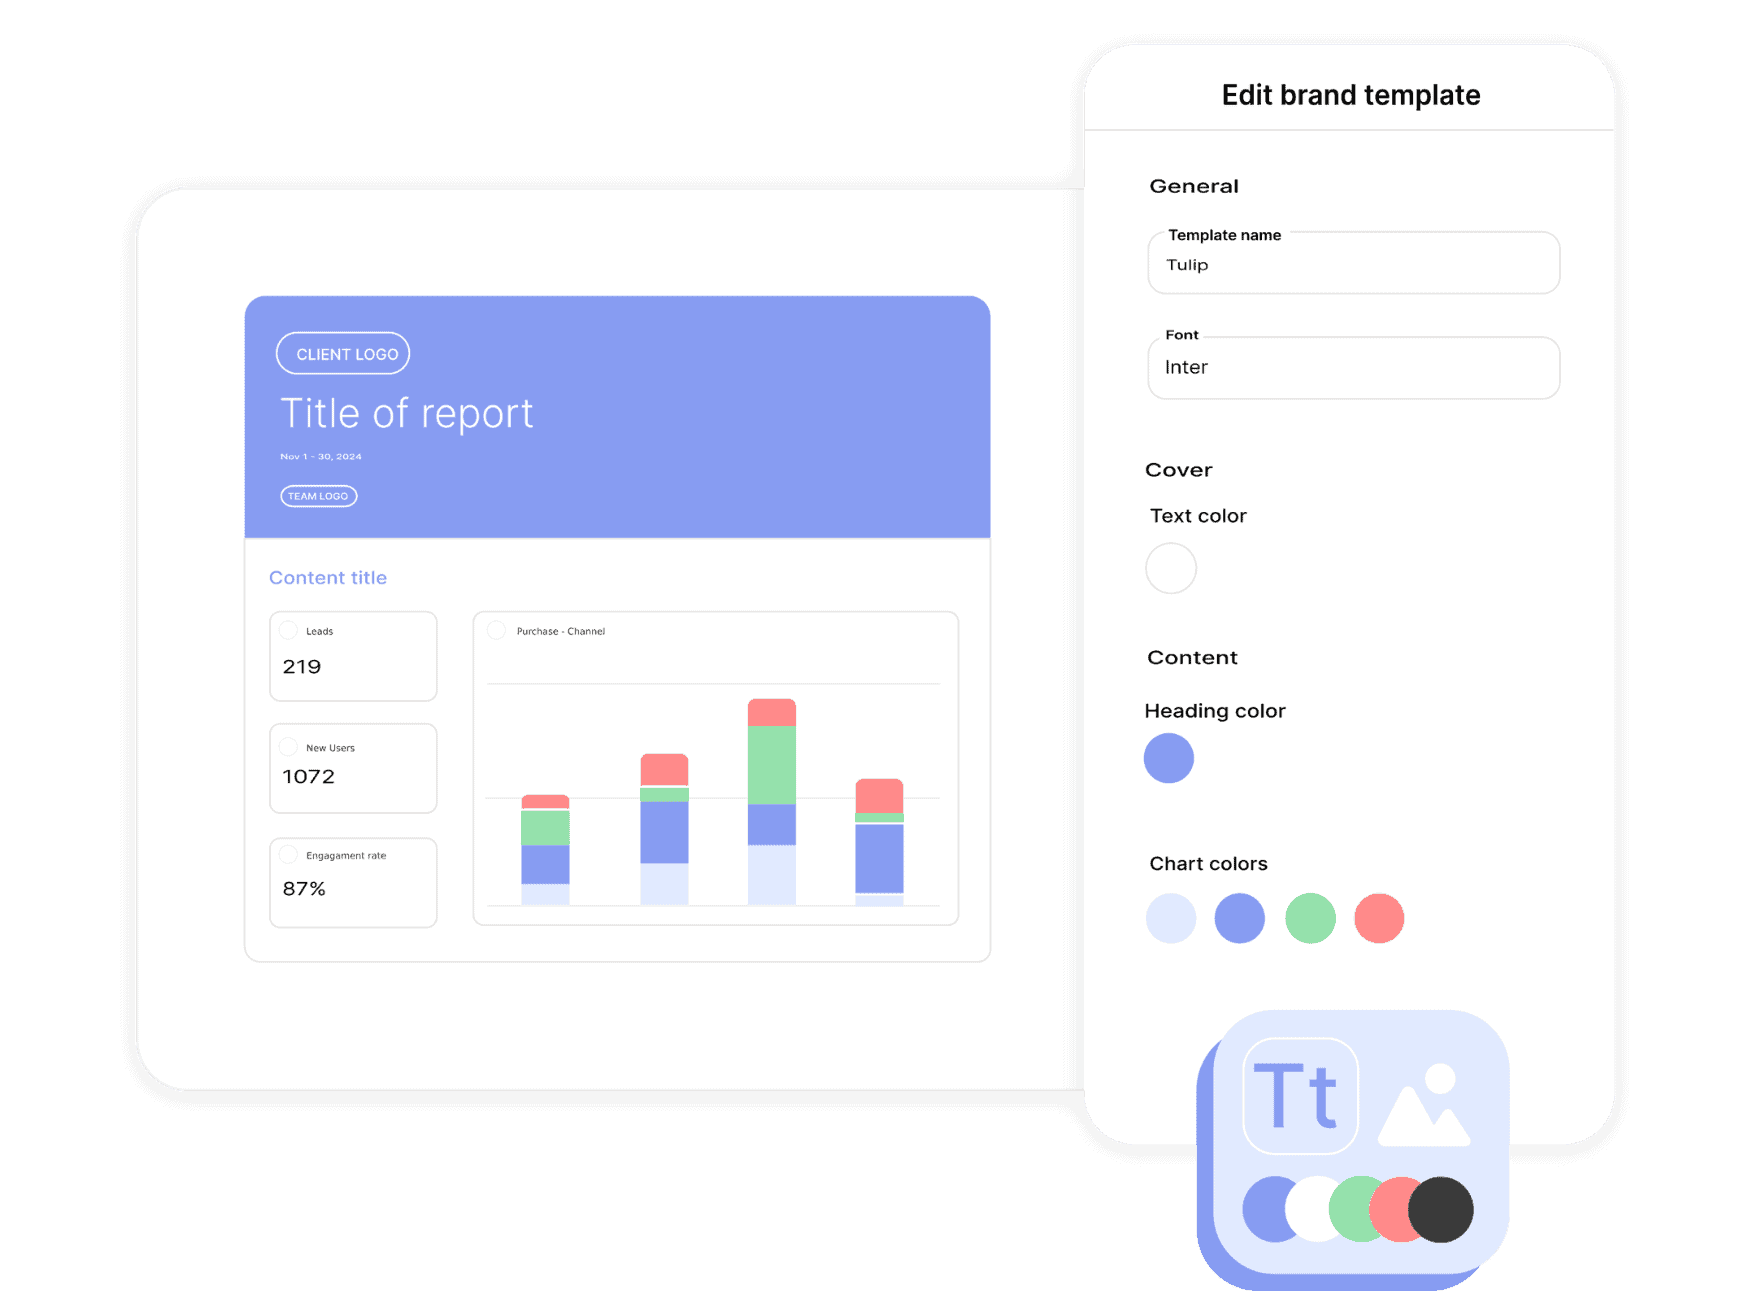
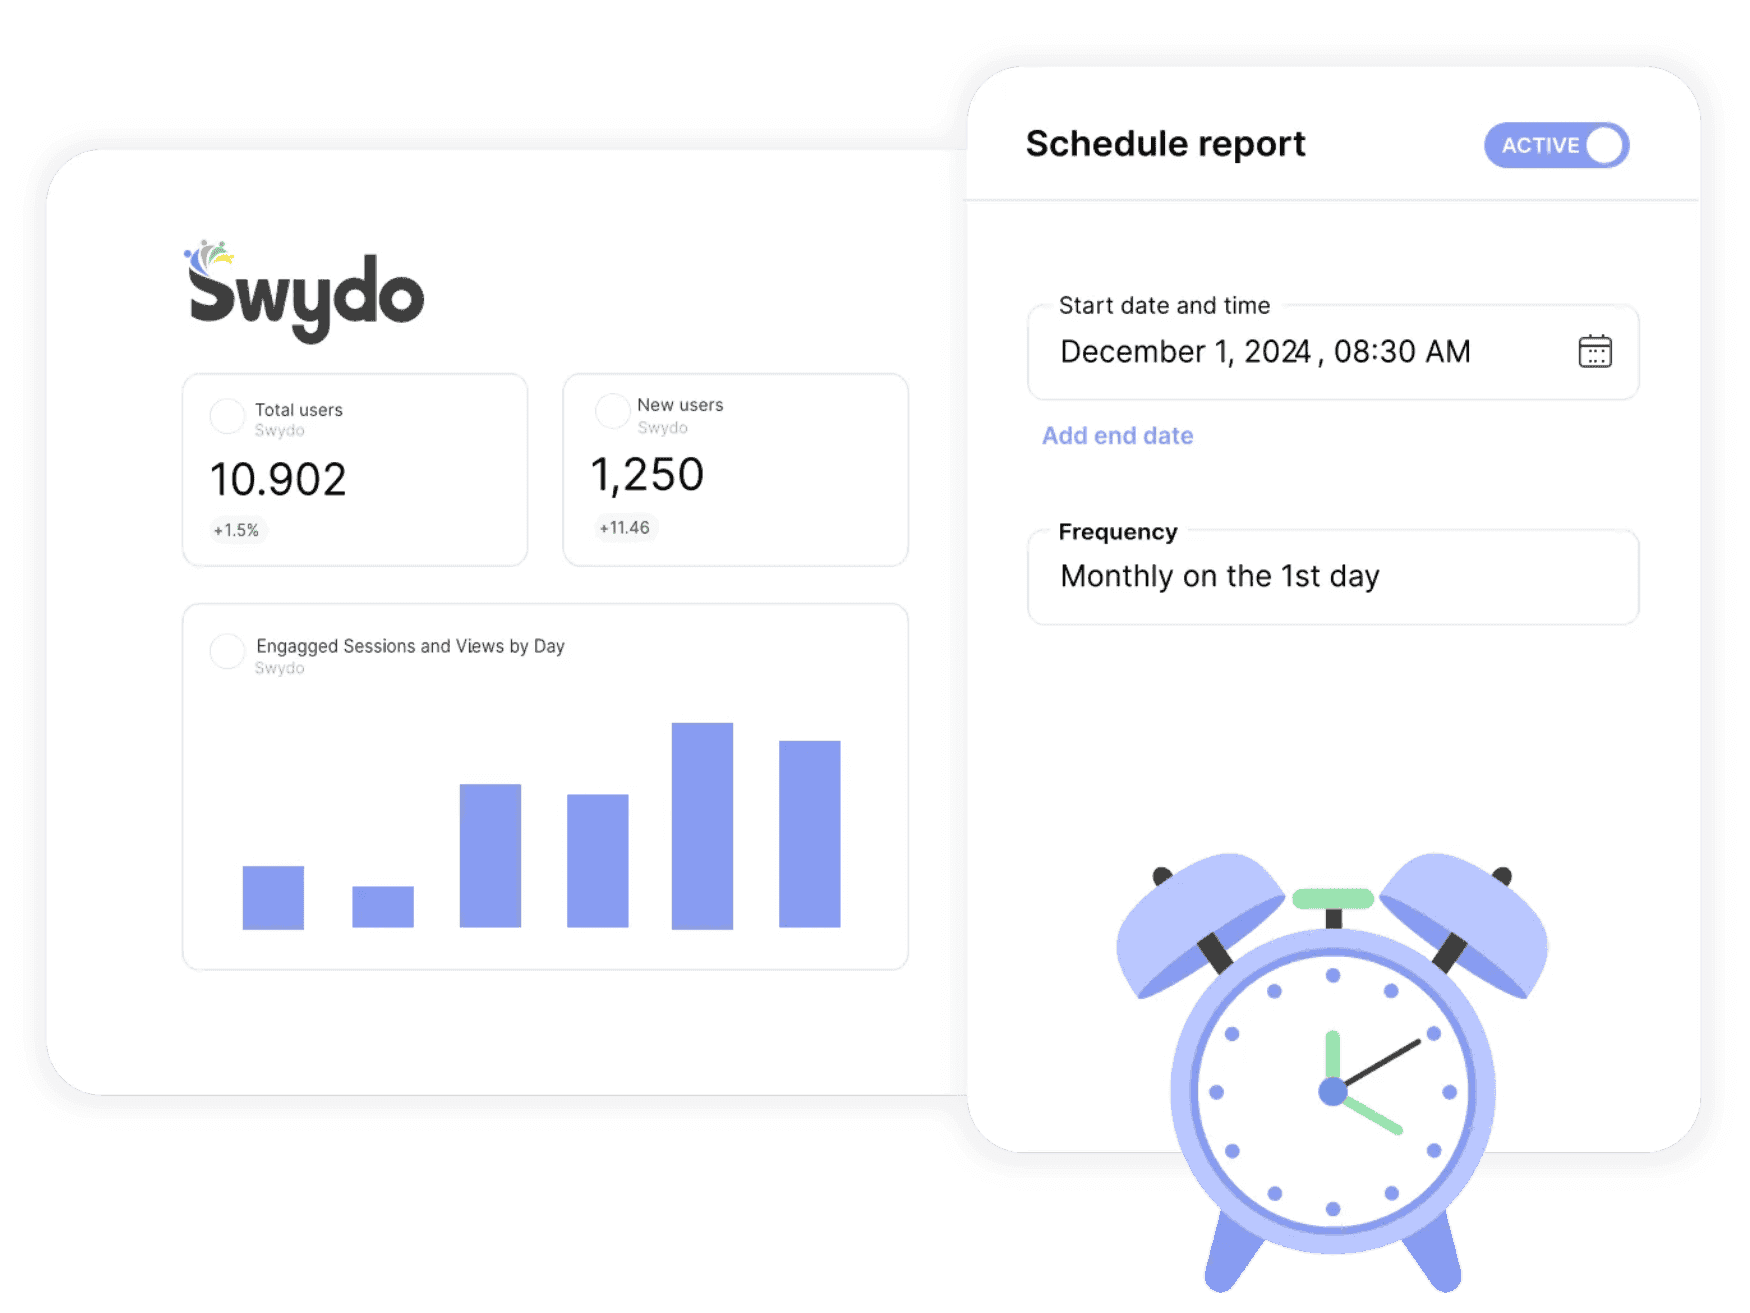
Automate Your Reporting Workflow
Set up automatic deliveries of your Facebook Insights dashboards or shareable PDF reports. Configure once and ensure clients receive timely updates daily, weekly, monthly, or quarterly. Swydo automatically retries failed emails, so you never miss a deadline.
Never forget to send another reportSpot & Fix Connection Issues Fast
Accurate reporting starts with reliable data connections. Swydo sends instant alerts if your Facebook Insights integration connection fails. Reauthorize in a few clicks, and see all data sources on one screen. Control costs by managing active or inactive data feeds.
Keep your data flowing and your reports accurate

Get a single overview of top metrics for all your clients.

Get email alerts when results hit or miss targets.

Enjoy 99%+ report delivery with auto-resends.

Blend data from up to 5 ad platforms into one widget for a single, clear metric.

Blend data from up to 5 ad platforms into one widget for a single, clear metric.

Report-level and KPI status filters allow you to quickly identify issues and take action.
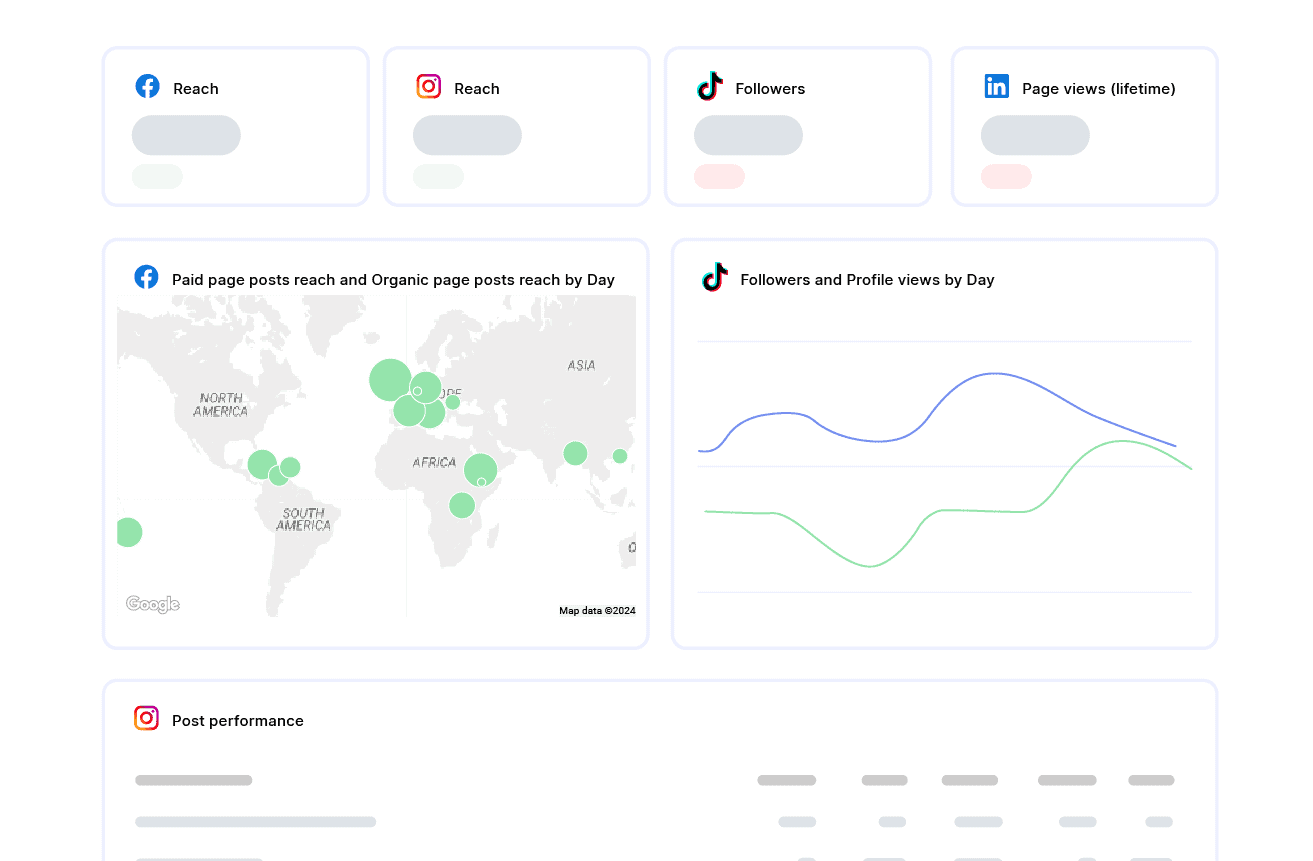
Bring all your PPC, SEO, social media and Google Analytics data together quickly and easily with hundreds of time-saving templates, predefined widgets, and KPIs.
Swydo enables you to build reports which reflect your brand by incorporating your logo, text styles, colors and personalized cover pages.

Swydo gives you the tools to dig deeper with monitoring boards, goals and target alerts, custom metrics, combined data sources, report filters, and more.
Once you’ve created a report, you can schedule and send that report automatically as frequently as needed - monthly, weekly, daily - whatever your clients need.
Customize reports to suit your clients’ needs. Build report templates and widgets from scratch. Provide executive summaries to help better understand the data.
Share your reports via PDF or use our online dashboard report option – whatever suits your clients or team best.
Easily Connect & Integrate Data in a Single Report
From your client page in Swydo, open the Data Sources tab and click New Data Source, then choose Facebook Insights. For most platforms you’ll authorize via OAuth; a few (Klaviyo, CallRail, Call Tracking Metrics, ActiveCampaign) use an API key instead. Once authorized, pick the specific account, property, or page you want to report on. Each one becomes a data source you can drop into any report.
Yes. Every Swydo report supports widgets and KPIs from multiple data sources side by side, so a single report can pull from Facebook Insights, Google Ads, GA4, Meta, and more. For paid-media platforms you can also blend up to five sources inside a single widget — useful for cross-channel ROAS, total spend, or unified conversion tables. Custom blended widgets aren’t available for non-ad platforms, but reports themselves can mix anything.
Yes. Swydo connects via OAuth or scoped API keys, encrypts data in transit over HTTPS, and stores access tokens with role-based controls. Swydo is GDPR-compliant and acts as a data sub-processor under a standard DPA. You can revoke any connection at any time, and on account closure all data and credentials are deleted within 90 days. Full details live on Swydo’s privacy and data-storage pages.
Swydo offers a 14-day free trial with no credit card required. Pricing is based on the number of data sources, not on users (seats are unlimited) or report volume. The flat plan includes 10 data sources, with a per-source rate beyond that which decreases as you scale. Frequency of reporting doesn’t affect cost. Use the calculator at swydo.com/pricing for an exact quote.
Meta removed several Page metrics across 2024, including Page Views (logged-in/out), Engaged Users, Negative Feedback, Storytellers, and several demographic dimensions. Swydo’s recommended workaround is custom metrics: rebuild Total Engagements as reactions + comments + shares, or Engagement Rate as engagements ÷ impressions. These reconstructed metrics aren’t identical to the deprecated originals but get you close enough for client storytelling.
Meta’s UI shows a combined organic + viral reach number; their API exposes them as two separate metrics. Swydo reports both individually so you can choose which to show. To match Meta’s UI, build a custom metric that adds organic reach + viral reach, then use that combined metric in your widget. Some agencies prefer keeping them split because viral reach (shares-driven) tells a different story than organic reach (followers-driven).
Meta’s API only returns Facebook reach in 1-, 7-, or 28-day intervals. For other date ranges, Swydo estimates by combining the largest available window with daily data — typically within a few percent of Meta’s UI. Exact matches require setting your widget to 1, 7, or 28 days, or entering Meta’s exact number as a Manual KPI for the period.
Facebook Insights is organic-only. Paid Page activity (boosted posts, Page-promotion ads) lives in your Facebook Ad Account, accessed through Swydo’s Facebook Ads integration. Add both data sources to your client and build separate Paid and Organic sections in the same report. Meta’s API doesn’t expose a single “paid + organic combined” view at the Page level, so any paid/organic split happens at the report-layout level.
Yes. Facebook Insights exposes video views, average watch time, video completion rate (25%/50%/75%/100%), and engagement-on-video metrics. Build a dedicated Video Performance section showing top videos by views, average watch time over time, and completion-rate breakdown. For Reels-on-Facebook specifically, Meta has been changing what’s exposed — current support reflects the latest API, and some legacy Reels metrics may have been deprecated.
Build a line-chart widget on Lifetime Fans (the followers count) over time — Swydo will show the daily progression. For a clean growth metric, add a custom metric that calculates (current period fans − previous period fans) ÷ previous period fans × 100 to express growth as a percentage. Pair with a New Page Likes widget showing daily new likes if you want to attribute growth to specific posts or campaigns.
Sign up for a 14-day free trial or start a subscription. Then:
No, Swydo is designed to be user-friendly and self-service, so no technical skills are required to get started quickly. Our setup guides walk you through every step. If you need assistance, our support team is here to help.
For a quick overview on how to set up your Facebook Insights account, check out the integration tutorial on our help center.
Yes, Swydo implements industry-standard measures to protect your information. This includes secure data storage, encryption, and compliance with privacy regulations. Learn more here.
Yes, Swydo offers several filter options to help you refine your data and focus on the most relevant insights. Some of the key filter types include:
Yes, you can combine Facebook Insights data with multiple integrations into one comprehensive report. This allows you to:
Perfect for multi-channel campaigns and seamless reporting.
Swydo actively monitors your data sources to keep everything running smoothly. If there’s a disruption, such as a password change or account update, you’ll receive an alert in the app, and a detailed email with easy steps to resolve the issue.
We accept credit cards (Visa, Mastercard & American Express) and PayPal.
Yes! Our onboarding ensures a seamless start with:
While Swydo is self-service, our support team is always available to help set up your first reports.
Client testimonials
Free for 14 days, no credit card required, cancel at any time
Request a demo ▶ Get started