
Your biggest client just asked why their conversion rate dropped 3% last month. You’ve got until tomorrow’s call to explain it and show them your fix.
Here’s what makes this hard: McKinsey research shows that 40% of consumers change their mind at the point of sale. Think about what that means. Your client could be doing everything right—driving traffic, building interest—only to lose the sale because their checkout asked for too much information.
When you can’t show clear conversion improvements, clients see you as an expense. Understanding conversion journeys gives you a way to improve every client’s bottom line while proving your value at renewal time.
What Conversion Journeys Actually Are
A conversion journey is the complete path someone takes from first hearing about your client’s product to becoming a paying customer. For B2B clients, this might mean going from downloading a white paper to booking a demo to signing a contract. For e-commerce, it’s browsing products to adding to cart to completing checkout.
Your clients think they get this. They don’t. They see the start (awareness) and the end (purchase) but miss everything in between. And that’s where conversions are won or lost.
Gartner research found that poor data quality costs organizations $12.9 million annually. Your clients are making decisions about marketing based on incomplete data about how people actually convert.
Here’s something concrete. Research shows a 1-second delay cuts conversions by 7%. When load time goes from 1 to 3 seconds? Bounce rate jumps 32%. If your client’s product page takes 5 seconds to load on mobile, you’re losing conversions before visitors even see what you’re selling.
That’s not a marketing problem. That’s a conversion journey problem.
The Three Core Stages of Every Conversion Journey
Most conversion journeys follow a three-stage pattern regardless of industry. Understanding these stages helps you diagnose problems fast across different client accounts.
Awareness
Problems Meet Solutions
3x more likely to purchase if in initial consideration
Consideration
The Evaluation Maze
Brands added during research, not eliminated
Decision
The Moment of Truth
40% change mind at point of sale
Beyond the Purchase
Retention
5% increase = 25%+ profit boost
Advocacy
Zero acquisition cost growth
Stage 1: Awareness (When Problems Meet Solutions)
Someone realizes they have a problem and your client’s brand enters their consideration set for the first time.
At this stage, people aren’t ready to buy. They’re not even ready to evaluate solutions. They’re in discovery mode asking themselves “Is this really a problem I need to solve?” or “What options exist?” Push too hard for a sale right now and you’ll scare them away.
Common awareness touchpoints:
- Organic search results when they Google their problem
- Social media posts that resonate with pain points
- YouTube videos about related concepts
- Podcast mentions or sponsored content
- Recommendations from friends or colleagues
- Display ads that catch attention
Your client’s job here is to educate, not sell. Think about it from the prospect’s perspective. They’re trying to figure out if they even have a fixable problem. They’re not ready for pricing or features yet.
McKinsey’s research found something crucial: brands in a customer’s initial consideration set are 3x more likely to be purchased than brands added later. So awareness isn’t just about visibility. Your client needs to be memorable enough to make that initial shortlist.
If your client isn’t investing in educational content at the awareness stage, they’re entering the game late. Prospects are already comparing them against competitors who’ve been building trust for weeks.
Stage 2: Consideration (The Evaluation Maze)
Now prospects are actively comparing solutions. They’re reading reviews, watching demos, and trying to determine which option solves their problem.
This stage involves both rational evaluation and emotional decision-making happening at the same time. People are asking “How does this solve my problem?” but also thinking “Can I trust this company?” and “What will my boss think?” Your job is addressing both types of concerns.
Here’s where traditional marketing wisdom gets it wrong. We’ve been taught that consideration narrows down options—picture a funnel getting smaller. McKinsey’s research discovered the opposite. People add brands during evaluation. In their study of personal computer purchases, consumers added an average of 1 brand during consideration. For automobiles? 2.2 brands.
Key consideration touchpoints:
- Product comparison pages and reviews
- Case studies showing results from similar customers
- Demo videos or free trials
- Pricing pages (visited multiple times)
- Testimonials and social proof
- Direct comparisons with competitors
- Consultation or sales calls
- Email nurture sequences
You need detailed information that helps prospects make informed decisions. This includes being honest about what your client does well and what situations they’re not ideal for. Sounds counterintuitive? Transparency about limitations often increases trust and conversion rates.
Let me give you a concrete example. Say your client requires 12 fields on their demo request form—company size, annual revenue, current software, timeline to purchase, number of employees, industry, role. You trim it to 4 fields: name, email, company, phone. Research shows that reducing form fields typically improves conversion by 5-10% per field removed, so cutting 8 fields could boost conversions by 40-80%.
And lead quality doesn’t drop. Your client’s sales team still asks all those qualification questions where they belong: on the demo call.
With prospects researching across multiple devices, someone might see your client’s Instagram ad on their phone during lunch, visit the website on their work computer, read reviews on their tablet at home, then revisit pricing on their phone while commuting. Each interaction needs to feel connected and move the journey forward, not restart it.
Stage 3: Decision (The Moment of Truth)
Prospects are ready to commit but need one final push to overcome lingering doubts.
This is where cognitive biases play a huge role. Decision fatigue sets in. Loss aversion creates hesitation. Anxiety about commitment peaks. Remember that 40% stat? This is where it happens—surprise fees, complicated checkout, lack of trust signals, or just cold feet.
Common decision touchpoints:
- Purchase page or signup form
- Cart or checkout process
- Product configuration
- Payment entry
- Confirmation emails
- Abandoned cart recovery emails
Your mission is removing friction and anxiety. Here’s what that looks like:
| Friction Point | Solution | Impact |
|---|---|---|
| Too many form fields | Streamline to essentials | +15-40% completion |
| Limited payment options | Add PayPal, Apple Pay | +12-25% checkout |
| Hidden costs | Show shipping upfront | -30-50% abandonment |
| Lack of trust | Security badges, guarantees | +8-18% conversion |
| Forced account creation | Guest checkout option | +23-45% completion |
| Unclear progress | Progress indicators | +10-20% checkout |
Every extra step or moment of confusion costs conversions.
Beyond the Purchase: Where Most People Stop
Most businesses think the journey ends when someone becomes a customer. That’s just the beginning of a more valuable relationship. This is where you can show clients the revenue opportunity they’re missing.
Stage 4: Retention (Where the Real Money Lives)
Retention vs Acquisition: The Math That Changes Everything
Scenario A: Focus on Acquisition
Annual Marketing Budget
$500,000
Cost Per Acquisition
$850
New Customers Acquired
588
Customer Churn Rate
35%
Net Customer Growth
+413
VS
Scenario B: Balanced Approach
Acquisition Budget
$445,000
Retention Budget
$55,000
New Customers Acquired
524
Customer Churn Rate
22%
Net Customer Growth
+634
Why Scenario B Wins
13%
Churn reduction
5-25x
Cheaper to retain
+221
Customers retained
25%+
Profit increase
💡 **The Math:** A 13-point churn reduction on a 500-customer base (at $6k LTV) saves **$390,000** in annual revenue.
The post-purchase experience determines whether someone becomes a one-time buyer or a loyal customer who increases spend over time.
Research by Frederick Reichheld of Bain & Company found that acquiring a new customer costs 5-25x more than retaining one. And here’s the powerful part: a 5% increase in retention can boost profits by more than 25% (with some industries seeing gains up to 95%).
Think about that math. Which sounds easier—improving retention by 5% or increasing new customer acquisition by 95%?
Critical retention touchpoints:
- Onboarding emails ensuring successful product use
- Educational content about getting maximum value
- Proactive support before problems arise
- Recognition of usage milestones
- Renewal reminders for subscriptions
- Exclusive perks for existing customers
- Regular check-ins
- Satisfaction surveys
Here’s a real scenario you might face. You’re managing paid acquisition for a B2B SaaS client spending $850 per customer acquisition. They’ve got 35% annual churn. You pitch a retention program: 90-day onboarding journey, milestone celebrations, proactive check-ins. They agree to $4,500 monthly.
Within 6 months, churn drops to 22%. For a company with 500 customers at $500 monthly value, that 13-point improvement saves $390,000 annually. Your client credits you directly, renews with a 40% retainer increase, and refers two similar companies.
That’s the power of focusing on retention.
Stage 5: Advocacy (Free Marketing That Actually Converts)
When customers are genuinely delighted, they tell others. This creates organic growth at zero acquisition cost.
Key advocacy touchpoints:
- Review platforms (Google, Yelp, G2, Trustpilot)
- Social media mentions and tags
- Referral programs
- Case study participation
- Community forums
- Testimonials
Nielsen’s research consistently shows that recommendations from people consumers know are among the most trusted forms of marketing. One delighted customer can influence dozens of prospects—each entering awareness already predisposed to trust your client.
Think about something practical. You work with e-commerce clients. You build a post-purchase email sequence that waits 14 days after delivery, then asks for a review. You implement this across all clients. Review volume increases 340% on average, improving both SEO rankings and conversion rates. You productize this as a $2,500 add-on service.
Most clients don’t have a systematic approach to generating advocacy. They hope satisfied customers will leave reviews but don’t proactively create systems to encourage it.
Where’s your opportunity there?
The 2025 Conversion Journey: What’s Changed
Human psychology hasn’t changed. But the environment where conversion journeys happen has transformed dramatically in the past two years. Your clients who haven’t adapted are bleeding conversions.
Real B2B Journey: 27 Touchpoints Over 87 Days
Why last-click attribution misses 95% of the story
🚨 Last-click attribution would credit only the final brand search, ignoring the 26 touchpoints that built trust, educated, and moved this prospect toward purchase.
The Multiplication of Touchpoints
B2B buyers now engage with 6-10 pieces of content before deciding. Complex B2B sales can involve 27+ interactions. For consumer purchases, the number varies by category but it’s consistently higher than three years ago.
What this means practically: a prospect might see your client’s Instagram ad, visit the website, leave, see a retargeting ad, watch a YouTube review, visit again, sign up for email, read three emails, check Google reviews, compare prices with competitors, revisit from a different device, watch a demo video, read a case study, visit once more from an email link, then finally convert.
For you, this makes attribution far more complex. Your client sees the final touchpoint—maybe a Google search ad—and wants to cut budget from earlier touchpoints that “didn’t convert.” But those earlier touchpoints made that final conversion possible.
Here’s a situation you might face. You’re managing PPC for a high-ticket B2B client where average deals are $50K. Your client wants to cut blog content budget because it’s not “directly generating leads.” You implement proper multi-touch attribution and show them that prospects who read 3+ blog posts before requesting demos have 67% higher close rates and 23% higher deal values.
Suddenly your client doesn’t want to cut content budget. They want to increase it 40%.
Privacy Changes and First-Party Data
The landscape of customer tracking has fundamentally changed. Third-party cookies are being phased out across browsers. Google announced in July 2024 they wouldn’t deprecate cookies in Chrome entirely but introduced a user choice prompt for privacy settings.
Bottom line: tracking is getting harder.
Privacy regulations like GDPR and various state laws mean you need to be more careful and strategic. Your clients need:
- First-party data strategies where users willingly share information
- Privacy-compliant tracking using Google Consent Mode V2 (mandatory in EEA)
- Server-side tracking through Meta’s Conversions API and Google’s Enhanced Conversions
- Value exchange models offering something useful for customer information
This isn’t just a technical headache. It fundamentally changes how you measure and optimize conversion journeys. If you can’t accurately track conversions, you can’t prove ROI. And you can’t justify your retainer.
Say you specialize in e-commerce clients. You implement server-side tracking via Google Tag Manager Server-Side for all of them. This improves data accuracy by 25-40% compared to pixel-based tracking. Your ROAS reporting is significantly more accurate. When renewal season comes and competitors can’t prove results because of iOS tracking limitations, you retain 94% of clients because you can actually show what’s working.
AI-Powered Personalization
AI has moved from “emerging technology” to “essential tool.” McKinsey research shows 78% of organizations have adopted AI in at least one business function. Marketing is a leading adoption area.
AI-powered personalization lets you show different homepage content to first-time visitors versus returning customers, adjust product recommendations based on browsing behavior, change messaging based on traffic source, time email sends based on when individuals are most likely to engage, and predict which visitors are most likely to convert.
Companies implementing AI personalization are seeing 10-20% conversion rate increases on average, with some seeing higher gains depending on their starting point and implementation quality.
Here’s a practical opportunity. You’re a 20-person agency. You add AI personalization as a premium service at $5,000 monthly per client. You start with 3 pilot clients. Demonstrate 15-25% conversion improvements within 90 days. Scale to 11 clients. That’s $660,000 in annual recurring revenue from one new service.
The Mobile Paradox
Mobile devices generate significant retail website traffic globally and drive a growing share of online orders. Yet mobile conversion rates still lag behind desktop in most industries.
Research shows that as page load time goes from 1 to 10 seconds, bounce probability increases by 123%. If your clients’ sites aren’t optimized for mobile speed, they’re losing 20%+ of potential conversions.
Think about offering this as a service. You run mobile speed audits for your top 10 clients. Average mobile load times: 6.2 seconds. You implement image optimization, code minification, server upgrades. Average load time drops to 2.8 seconds. Mobile conversion rates improve 31% on average. You package this as a one-time project at $7,500 per client, then convert 8 clients to ongoing mobile optimization retainers at $1,500 monthly.
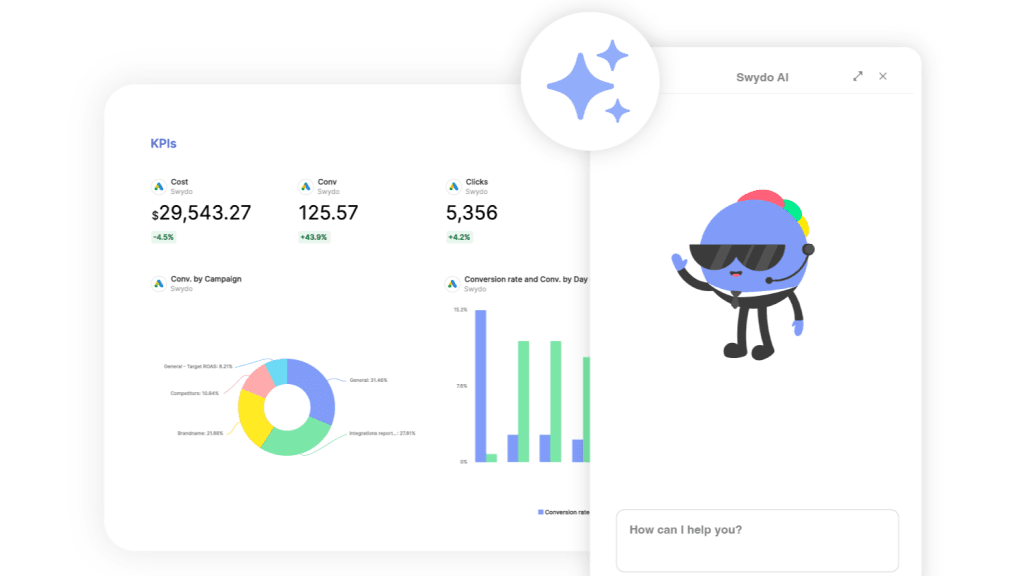
Conversational AI and Chatbots
Research by Grand View Research shows the chatbot market reached $7.76 billion in 2024 and is projected to reach $27.29 billion by 2030, growing at a CAGR of 23.3%.
Chatbots address a fundamental conversion journey challenge: prospects have questions at every stage and waiting for email responses or business hours kills momentum. Good chatbots provide instant answers, reduce cart abandonment, and handle routine inquiries so human agents focus on complex issues.
But here’s the critical caveat: poorly designed chatbots create frustration and drive users away. Implementation quality matters enormously. A poorly designed bot is worse than no bot.
Say you specialize in B2B clients. You implement Drift chatbots for 6 clients focusing on qualification questions and calendar booking. Average demo booking rate increases 43%. Sales teams report higher lead quality because basic qualification happens before the demo. You charge $2,500 setup plus $1,500 monthly management per client. That’s $15,000 in setup fees plus $9,000 monthly recurring revenue from 6 clients.
Social Commerce
Research from Statista shows social commerce generated approximately $571 billion globally in 2023 and is projected to reach over $1 trillion by 2028. More than doubling in just 5 years.
This creates entirely new conversion journey patterns. Someone discovers a product through a TikTok video, purchases without visiting your client’s website, and shares their experience back on social media. This is a circular journey that traditional funnel thinking can’t explain or optimize.
If you work with e-commerce clients and haven’t set up social commerce yet, that’s a massive opportunity. Say you specialize in D2C brands. You implement TikTok Shop for your clients. Average client sees 18% revenue increase from TikTok alone within 6 months. You charge $3,500 monthly per client for social commerce management across Instagram, Facebook, and TikTok.
How to Map Your Client’s Conversion Journey
Understanding theory is one thing. Actually implementing conversion journey optimization across multiple clients requires a systematic, scalable process that doesn’t consume 40 hours per client.
Step 1: Identify All Touchpoints
Build a standard touchpoint inventory template you use across all clients. The goal: complete this inventory in 2-3 hours per client, not 2-3 days.
Your touchpoint inventory template:
| Channel Type | Specific Touchpoints |
|---|---|
| Paid Channels | Google Ads, Facebook Ads, LinkedIn Ads, display networks |
| Organic Channels | SEO, content marketing, blog posts |
| Social Media | Organic posts, stories, comments, DMs |
| Email Marketing | Welcome series, newsletters, promotional emails |
| Website | Homepage, product pages, landing pages, blog |
| Third-Party Sites | Review platforms, comparison sites, marketplaces |
| Offline | Trade shows, direct mail, retail locations, phone calls |
| Partners | Affiliates, resellers, integration partners |
Pull your client’s Google Analytics acquisition reports and CRM source data. You need efficiency here.
Step 2: Understand Sequence and Behavior Patterns
You need to understand how prospects move through touchpoints, not just that touchpoints exist. This requires both quantitative data and qualitative insights.
For quantitative analysis, use Google Analytics Path Analysis to see common navigation patterns. Review multi-touch attribution reports. Analyze time between touchpoints. How long does it take someone to go from awareness to decision? Look at device switching patterns. Do people research on mobile and buy on desktop?
For qualitative research, interview 5-10 recent customers about their decision process. Ask specific questions:
- How did you first hear about us?
- What made you decide to look further?
- What almost stopped you from buying?
- What ultimately convinced you?
This gives you insights no analytics tool can provide.
Here’s how to systematize this. Create a 10-question customer interview template you use across all clients. Your account managers conduct 3 interviews per client per quarter. Takes about 2 hours quarterly but provides invaluable qualitative data. You’re not just looking at numbers. You’re understanding the actual human experience of moving through the conversion journey.
Step 3: Identify Drop-Off Points and Friction
Where are prospects falling out of your client’s conversion journey? Every journey has leaks. Your job is finding the biggest leaks fast so you can prioritize fixes that move the needle.
High-impact areas to investigate:
- Landing pages with high bounce rates (under 3 seconds = wrong message-match)
- Form abandonment (which fields cause people to give up?)
- Cart abandonment (what’s causing 70% to bail?)
- Email unsubscribes after specific messages
- Session recordings showing confusion or frustration (use Hotjar or FullStory)
Real scenario: your e-commerce client has 68% cart abandonment. You use session recordings and discover mobile users struggle entering credit card information because the form doesn’t auto-format numbers. Sixteen digits running together is hard to read. There’s also no Apple Pay option. Two simple fixes—add number formatting and Apple Pay—reduce abandonment by 23%. For a client doing $400K annually, that’s $84K in additional revenue.
That’s the kind of concrete impact that justifies your retainer and earns referrals.
Build a standard “friction audit” process you can deploy across clients in 3-4 hours each. This becomes valuable during onboarding and annual reviews.
Step 4: Measure What Matters at Each Stage
Different stages require different metrics. Don’t track everything. Focus on metrics that actually indicate conversion journey health at each stage.
| Stage | Key Metrics to Track |
|---|---|
| Awareness | Traffic volume and quality, source diversity, engagement rate, brand search volume |
| Consideration | Email open rates and CTR, return visitor %, pages per session, demo/trial signups |
| Decision | Conversion rate, cart abandonment, checkout completion, average order value, CAC |
| Retention | Customer lifetime value, repeat purchase rate, churn rate, NPS, support tickets |
| Advocacy | Referral rate and revenue, review volume and rating, social mentions, case study participation |
Create a standard dashboard template in Data Studio that tracks these metrics across all clients. This lets you quickly compare performance, identify trends, and spot opportunities. One client implementing this reduced reporting time by 60%—from 4 hours per client weekly to 90 minutes. Account managers identified optimization opportunities faster. Client retention improved 28%.
The Psychology Behind Conversion
People don’t make purely rational decisions. Neuroscience research shows emotional brain centers activate before rational centers when we’re making choices. Then we retroactively justify emotional decisions with logic.
Understanding this psychology gives you a massive advantage. You’re not just fixing technical issues. You’re working with how humans actually think and decide.
Six Key Psychological Principles
Let’s walk through the six principles that have the biggest impact on conversion rates, with practical applications you can implement now.
Social Proof: The Power of “Everyone Else Is Doing It”
Humans are deeply influenced by what others do. When we’re uncertain—which is most of the time during purchase decisions—we look to others for guidance.
Real application: your B2B SaaS client converts at 2.1% on their pricing page. You add social proof elements—customer logos from recognizable companies, a “Join 2,500+ companies” badge, testimonials from brands in their target market. Conversion rate increases to 3.4%. For a company with 10,000 monthly visitors to pricing, that’s 130 additional conversions monthly. At $5,000 average contract value, that’s $650,000 in additional annual revenue from one optimization.
Scarcity and Urgency: Fear of Missing Out
We value things more when they’re scarce or time-limited. This taps into loss aversion—we feel the pain of loss about twice as strongly as the pleasure of equivalent gain.
Important caveat: only use scarcity and urgency when genuinely true. Fake scarcity erodes trust and tanks long-term conversion rates. If your client runs a “24-hour sale” every week, it stops working.
Real application: you test urgency elements for an e-commerce client. Add “Only 3 left in stock” when inventory drops below 5 units. Add “Order within 2 hours for next-day delivery” with real cutoff times. Conversion rate increases 17%.
Authority and Trust: Reducing Perceived Risk
Every purchase decision involves risk. Financial risk. Social risk. Functional risk. People look for signals that your client is credible and trustworthy to reduce perceived risk.
Real application: your healthcare client converts at 4.2% on their appointment booking page. You add trust elements—doctor credentials and photos, “HIPAA Compliant” badge, security certifications, clear privacy commitments. Conversion rate increases to 6.7%. For a practice with 5,000 monthly website visitors, that’s 125 additional appointment bookings monthly. At $500 average patient value, that’s $62,500 in additional monthly revenue.
Reciprocity: The Give-to-Get Principle
When you give someone something valuable, they feel psychological obligation to give something back. This is why content marketing and lead magnets work.
The key word: valuable. A thin 2-page PDF won’t trigger reciprocity. But a comprehensive guide that solves a real problem? That creates genuine goodwill.
Real application: your financial services client gets 1.8% conversion on their homepage lead magnet—a generic “Financial Planning Checklist” PDF. You upgrade to an interactive “Retirement Readiness Calculator” providing personalized results and recommendations. Lead generation increases 340%. Even better, leads who use the calculator have 43% higher show rates for consultations because they’re more invested.
Consistency Through Small Commitments
People have a deep psychological need to be consistent with their past actions. Each small “yes” makes the big “yes” more likely.
This is why multi-step processes can actually convert better than single-step forms. When someone takes time to complete a quiz, configure a product, or answer questions about their needs, they’re psychologically invested in seeing it through.
Real application: your SaaS client has a single-step demo request form converting at 3.1%. You rebuild it as 3 steps: (1) “What’s your biggest challenge?” with multiple-choice options, (2) “What’s your company size?” with ranges, (3) Contact information for personalized demo. Conversion rate increases to 4.8%. The multi-step approach feels less intimidating upfront and creates progressive commitment.
The Paradox of Choice
Conventional wisdom says more choice is better. Psychology research shows the opposite. Too many options create decision paralysis.
There’s a famous study where a store offered samples of 24 jams. Only 3% bought. When they offered 6 jams? 30% bought. That’s a 10x difference from reducing options.
Real application: your B2B client offers 7 service tiers with confusing differentiation. You simplify to 3 clear tiers—Starter, Professional, Enterprise—with explicit “Best For” descriptions. Conversion rate increases 29%. Average contract value increases 12% because more prospects choose mid and top-tier options when the path is clearer.
Common Mistakes That Kill Client Conversions
After analyzing hundreds of client accounts, the same mistakes appear repeatedly. Understanding these helps you avoid them.
Treating It Like a Linear Funnel
The traditional marketing funnel—wide at top, narrow at bottom—creates a misleading mental model. Real conversion journeys aren’t linear.
McKinsey’s research found consumers actually add brands during consideration rather than narrowing down. People loop back to earlier stages, research across devices, and follow unpredictable paths.
If you’re reporting to clients using a traditional funnel, you’re misrepresenting how their customers actually behave. You’re making optimization decisions based on a flawed model.
Build client dashboards showing actual journey paths using Google Analytics Path Analysis. Show your clients that prospects who consume multiple content types—blog posts and videos and case studies—convert at 3x the rate of those who only hit one type, even if their journey took 45 days instead of 7.
Optimizing Stages in Isolation
Many agencies have specialists who only work on specific channels. Your PPC team optimizes paid ads. Your SEO team optimizes organic. Your email team optimizes nurture. But nobody owns the complete journey.
This creates disconnected experiences. The ad promises one thing. The landing page emphasizes something different. The nurture emails mention different benefits. The sales team has their own pitch. Prospects get confused and leave.
If you’re running a larger agency, consider restructuring from channel-specific teams to client-specific pods. Each pod owns the entire conversion journey for their accounts. Client retention typically improves significantly because your team can optimize the complete experience rather than individual touchpoints in isolation.
Ignoring Mobile Experience
Mobile devices drive a significant portion of retail traffic. Yet many agencies and businesses still build campaigns desktop-first, treating mobile as an afterthought.
The problem compounds because mobile users are less patient. 1-second delay reduces conversions by 7%. Load time goes from 1 to 10 seconds? Bounce probability increases by 123%.
Practical action plan:
- Test every client landing page on actual mobile devices (not just Chrome’s emulator)
- Set up mobile-specific conversion tracking and reporting
- Flag any page with 3+ second mobile load time as urgent priority
- Recommend mobile-first redesigns for clients where 60%+ traffic comes from mobile
Think about offering this. You audit mobile performance for your top 15 clients. Eleven have critical issues. You pitch “Mobile Conversion Optimization” projects at $5K-$12K depending on scope. Nine clients approve immediately after seeing their mobile conversion rates compared to desktop. Projects generate $87K revenue and improve mobile conversion rates 34% on average.
Asking for Too Much, Too Soon
Forms are notorious conversion killers. Every additional field reduces completion rates. Yet clients routinely ask for information they don’t actually need right now because “it would be nice for segmentation.”
Your job is protecting conversion rates by pushing back when clients want unnecessary form fields.
Scenario: your client wants to add 6 fields to their newsletter signup—job title, company size, industry, phone, company website, “How did you hear about us?” You explain each field reduces conversion by roughly 5-10%. They insist they “need” this data.
You propose a test: run the long form one month, short form (just email) the next. Long form converts at 1.2%. Short form converts at 4.7%. Your client keeps the short form and you implement progressive profiling—gathering additional data through subsequent emails with subscribers who are already engaged.
Neglecting Post-Purchase Experience
Most clients focus entirely on acquisition. They want more leads, more traffic, more conversions. They treat retention as someone else’s problem—usually their customer success team.
This is a massive opportunity for you. When you show a client that retaining 5% more customers can boost profits by more than 25%, you’ve justified expanding your scope and increasing your retainer.
Think about these opportunities:
- Build post-purchase email journeys for e-commerce clients
- Create onboarding sequences for SaaS clients
- Develop loyalty programs for subscription clients
- Implement win-back campaigns for lapsed customers
- Build referral programs to generate advocacy
Real scenario: you’re managing paid acquisition for a SaaS client. You notice 35% annual churn. You pitch a retention program—90-day onboarding journey, quarterly check-ins, proactive value content. They agree to $4,500 monthly. Within 9 months, churn drops to 22%. For a company with 500 customers at $500 monthly value, that 13-point improvement saves $390K annually. Your client credits you directly, renews at 40% higher retainer, and refers two similar companies.
Using Last-Click Attribution
Despite overwhelming evidence that modern conversion journeys involve multiple touchpoints, many agencies still use last-click attribution. This gives 100% credit to the final touchpoint and completely ignores all other interactions that made conversion possible.
Same Journey, Different Stories: How Attribution Models Change Everything
A $50,000 B2B deal with 7 touchpoints over 45 days
Day 1
Day 8
Day 15
Day 22
Day 30
Day 38
Day 45
Last-Click Attribution
100% credit to final touchpoint
⚠️ Ignores 6 touchpoints that built trust and educated prospect
Linear Attribution
Equal credit to all touchpoints
✓ Recognizes all contributions but may overvalue minor interactions
Time Decay Attribution
More credit to recent touchpoints
✓ Weights closing interactions while acknowledging journey
Position-Based (U-Shaped)
40% first, 40% last, 20% middle
✓ RECOMMENDED: Credits awareness AND conversion while recognizing nurture
Why This Matters for Budget Decisions
Last-Click Thinking
“Cut LinkedIn ads, they don’t convert”
Result: Awareness drops, pipeline dries up in 60 days
Position-Based Thinking
“LinkedIn drives awareness, search captures demand”
Result: Balanced investment across full journey
This leads to disastrous budget allocation. When your client sees their Google Brand search campaign has the highest ROAS, they want to shift budget there. But those brand searches only exist because of educational content, social media ads, and email nurture that happened earlier. Cut those earlier touchpoints and brand search volume will drop. Overall conversions will crash.
Practical fix:
- Implement data-driven attribution in Google Analytics
- Build custom multi-touch attribution models showing all touchpoint contributions
- Educate clients on how awareness and consideration investments drive decision-stage conversions
- Create reports showing assisted conversions, not just last-click
Example: you’re managing a complex B2B client. LinkedIn ads show poor last-click ROAS but excellent assisted conversion metrics. When you implement position-based attribution (giving credit to first touch, last touch, and middle touches), you prove LinkedIn ads are critical for deal velocity. Your client increases LinkedIn budget 40%. Overall conversion rate improves 18%. Sales cycle shortens by 12 days.
That’s strategic insight that differentiates you from agencies still using last-click.
Ignoring Data Quality
Gartner research found poor data quality costs organizations $12.9 million annually. For agencies, dirty data means you can’t accurately track conversions, prove ROI, or make optimization decisions.
Common data quality issues:
- Duplicate contacts in CRM
- Inconsistent UTM parameter naming
- Unverified form submissions with fake data
- Bot traffic inflating metrics
- Cross-device tracking gaps
- Incorrect conversion tracking setup
Real problem: you discover 23% of your client’s CRM contacts are duplicates because form integrations aren’t de-duping. Your “cost per lead” reporting has been 23% lower than reality. Your client’s been making budget decisions based on false data.
Fix: implement data hygiene protocols across all clients. Standardize UTM naming conventions. Set up weekly de-duplication. Add form validation and reCAPTCHA. Implement bot filtering. Within 90 days, reporting accuracy improves dramatically and you can confidently recommend budget optimizations that actually work.
Industry-Specific Journey Adaptations
Different industries have unique conversion journey characteristics. Understanding these patterns lets you deploy proven strategies quickly rather than starting from scratch with each client.
B2B SaaS Clients
B2B SaaS typically has longer sales cycles (30-180+ days), higher price points ($5K-$500K+ annually), and multiple decision-makers (average of 6-10 people in enterprise deals). The consideration stage dominates because prospects are doing extensive research.
Unique characteristics:
- Product-led growth creates unique journeys where users experience value before buying
- Free trials serve as both consideration and decision touchpoints
- Actual buyer might differ from end user (IT buys, marketing uses)
- Integration capabilities often make or break decisions
Critical metrics: Trial-to-paid conversion rate (15-25% is strong), time to value, feature adoption rates, expansion revenue, sales cycle length
Optimization priorities: Focus first on demo request conversion (often easiest to improve), then trial activation (biggest revenue impact), then sales enablement content (case studies, ROI calculators, comparison guides), and multi-stakeholder nurture (reaching both users and economic buyers).
E-commerce Clients
E-commerce has shorter decision cycles (minutes to days) but higher cart abandonment (around 70% average). Mobile drives significant traffic but desktop often wins conversions for higher-value items.
Unique characteristics:
- Product discovery happens across multiple channels (social, search, marketplaces)
- Visual presentation dramatically impacts conversion
- Checkout friction kills conversions (unexpected costs, limited payment options, forced account creation)
- Review quality and quantity directly predict conversion rates
Critical metrics: Cart abandonment rate (aim for 60% or lower), checkout completion rate, average order value, mobile conversion rate, CAC by channel, repeat purchase rate within 90 days
Optimization priorities: Week 1—audit checkout and implement quick wins (guest checkout, multiple payment options, shipping transparency). Week 2-3—implement cart abandonment emails (typically recover 10-30%). Week 4—mobile optimization audit. This consistently delivers 15-25% conversion improvement within the first month.
Healthcare Clients
Healthcare involves significant trust barriers. People are making decisions affecting their health, often while anxious or ill. Privacy concerns are paramount (HIPAA compliance is mandatory). Credibility signals matter enormously.
Unique characteristics:
- Credentials and qualifications must be prominently displayed
- Educational content needs to be accurate, empathetic, and helpful
- Appointment scheduling needs to be frictionless
- Insurance acceptance and costs create major decision-stage questions
- Online reviews are extremely influential
Critical metrics: Appointment booking rate, first-visit show rate (10-30% no-show is common), phone call tracking (many conversions happen offline), patient satisfaction scores, provider ratings and review volume
Optimization priorities: Implement online booking first (typically delivers 20-40% lift), optimize for trust signals (credentials, reviews, facility photos), address insurance and pricing transparency, set up automated appointment reminders (reducing no-shows improves revenue without additional marketing).
Financial Services Clients
Financial services face heavy regulation impacting what you can say and how you market. Journeys tend to be longer because of financial decision significance and natural customer risk aversion.
Unique characteristics:
- Compliance requirements constrain messaging
- Security and trust signals are non-negotiable
- Comparison shopping is intense
- Personalization must balance with privacy protection
- Educational content helps but requires compliance review
Critical metrics: Application start rate, application completion rate (often 40-60% drop-off), approval rate, funding rate for loans, account opening time (faster = higher completion)
Optimization priorities: Start with security and trust signals (SSL, encryption, regulatory memberships), simplify application process (remove unnecessary steps), provide transparent pricing upfront (hidden costs kill conversions), create educational content helping people understand products, implement multi-device application continuity (let people start on mobile, finish on desktop).
Key Takeaways
Every client you manage has a conversion journey. Whether they’ve intentionally designed it or not. The difference between thriving agencies and struggling ones? Systematic implementation.
You need to map conversion journeys. Identify high-impact optimization opportunities. Demonstrate measurable revenue improvement.
When you walk into renewal conversations with concrete data—”We increased your conversion rate from 2.3% to 4.1%, which generated $230,000 in additional revenue this year”—retention becomes easy.
Your clients see you as the agency that actually moves the needle.
Conversion Journey FAQ
Quick answers to optimize every step from awareness to advocacy
A conversion journey is the complete path someone takes from first discovering your product to becoming a paying customer. It includes every interaction—from seeing an ad to reading reviews to completing checkout.
Most businesses only see the start and end but miss the critical middle stages where conversions are actually won or lost.
It varies widely by industry and price point. E-commerce purchases can take minutes to days. B2B SaaS sales typically take 30-180 days. Complex enterprise deals often extend beyond 6 months.
B2B buyers now engage with 6-10 pieces of content before deciding, and complex sales can involve 27+ touchpoints. The higher the investment and risk, the longer prospects take to research and evaluate.
The five key stages are: Awareness (discovering solutions exist), Consideration (comparing options), Decision (ready to buy but need final push), Retention (keeping customers engaged), and Advocacy (turning customers into promoters).
Most businesses only focus on the first three stages, missing massive revenue opportunities in retention and advocacy. Research shows retaining customers costs 5-25x less than acquiring new ones.
No. A traditional sales funnel assumes a linear path where prospects steadily narrow down options. Real conversion journeys are messier—people loop back, research across devices, and actually add brands during evaluation rather than eliminating them.
McKinsey research found consumers add an average of 1-2 brands during consideration for major purchases, contradicting the funnel model that assumes narrowing choices.
Decision fatigue, surprise costs, complicated checkout processes, lack of trust signals, limited payment options, and forced account creation all trigger last-minute abandonment.
The most common reasons: unexpected shipping costs (shown too late), too many form fields, security concerns, confusing navigation, and slow page load times. Each extra step or moment of confusion directly costs conversions.
Show all costs upfront (reduces abandonment 30-50%), add guest checkout without forced registration (23-45% improvement), offer multiple payment options including PayPal and Apple Pay (12-25% boost), display security badges prominently, and add progress indicators showing checkout steps.
Send abandoned cart emails within 1 hour of abandonment, then follow up at 24 hours and 72 hours. These typically recover 10-30% of abandoned carts.
As few as possible. Each form field you remove typically improves conversion by 5-10%. For lead generation, stick to name, email, and one qualifying question. For checkout, only ask what’s absolutely necessary to complete the transaction.
Use progressive profiling to gather additional information over time through follow-up emails with engaged users, rather than demanding everything upfront when trust is lowest.
A 1-second delay reduces conversions by 7%. When load time increases from 1 to 3 seconds, bounce rate jumps 32%. From 1 to 10 seconds, bounce probability increases 123%.
If your site takes 5+ seconds to load on mobile, you’re losing 20%+ of potential conversions before visitors even see your content. Mobile speed optimization should be a top priority since mobile drives significant traffic but typically converts at lower rates.
Multi-step forms often convert better because they feel less intimidating upfront and create progressive commitment. Each small “yes” makes the final “yes” more likely due to consistency bias.
A SaaS client increased demo requests from 3.1% to 4.8% by splitting one long form into three shorter steps: challenge selection, company size, then contact info. The key is making each step feel easy and showing clear progress.
Optimize page speed first (aim for under 3 seconds), use larger tap targets (minimum 48×48 pixels), enable autofill for forms, add one-click payment options like Apple Pay, minimize typing required, and test on actual devices—not just browser emulators.
Design mobile-first, then adapt for desktop. Make sure CTAs are thumb-friendly, text is readable without zooming, and navigation works with one hand. Session recordings on mobile often reveal friction that analytics miss.
Display security badges (SSL, payment processor logos), customer testimonials with photos and company names, recognizable client logos, money-back guarantees, clear return policies, professional photos, real team member pictures, industry certifications, and recent customer reviews.
A healthcare client increased appointment bookings from 4.2% to 6.7% by adding doctor credentials, HIPAA compliance badges, and security certifications. Trust signals reduce perceived risk, which is the main barrier at the decision stage.
Essential tools: Google Analytics 4 for path analysis and multi-touch attribution, session recording software like Hotjar or FullStory to see actual user behavior, heatmapping tools to identify where users click and scroll, form analytics to find abandonment points, and a CRM to track the complete customer lifecycle.
For advanced tracking post-cookie deprecation, implement server-side tracking via Google Tag Manager, Meta Conversions API, and Google Enhanced Conversions to maintain 25-40% better accuracy.
Multi-touch attribution gives credit to all touchpoints in a conversion journey, not just the last click. This prevents bad budget decisions like cutting awareness campaigns that don’t directly convert but make all other conversions possible.
Use position-based attribution (40% credit to first touch, 40% to last, 20% to middle) to recognize both awareness-building and conversion-driving activities. Last-click attribution is dangerously misleading in modern multi-touchpoint journeys.
Implement server-side tracking (not reliant on browser cookies), use first-party data collection where users willingly share information, collect zero-party data through quizzes and preference centers, enable Google Consent Mode V2, and focus more on owned channels like email where tracking doesn’t depend on third-party cookies.
Build value exchange models: offer useful tools, calculators, assessments, or exclusive content in return for email addresses and profile information. This creates trackable, consented data relationships.
It varies dramatically by industry, traffic source, and what you’re measuring. E-commerce averages 2-3% overall, but can be 10%+ for warm email traffic. B2B lead forms typically convert 2-5%. Landing pages from paid ads average 2-6%, while organic traffic often converts 3-5% higher.
Instead of comparing to industry averages, focus on improving YOUR baseline. A consistent 10% improvement quarter-over-quarter compounds to dramatic results. Track conversion by source—email, organic, paid, social—since each has different benchmarks.
Review high-level metrics weekly (overall conversion rate, major drop-off points), conduct deep analysis monthly (path analysis, device comparison, source performance), and do comprehensive quarterly audits including session recordings, form analysis, and journey mapping.
Set up automated alerts for sudden drops in conversion rate (20%+ decline) or traffic. These can indicate technical issues, broken tracking, or external factors requiring immediate attention.
Implement AI-powered personalization to show different content based on visitor behavior, traffic source, and previous interactions. Use predictive analytics to identify high-intent visitors and serve them conversion-optimized experiences. Deploy chatbots for instant answers to common questions.
Companies implementing AI personalization see 10-20% conversion increases on average. Start with personalizing homepage content for returning visitors versus first-time visitors, then expand to product recommendations and email send-time optimization.
Both, but retention offers better ROI. A 5% increase in retention can boost profits by 25-95%. Acquiring a new customer costs 5-25x more than retaining one. Yet most businesses spend 80%+ of marketing budget on acquisition.
Allocate at least 10-15% of budget to retention: onboarding sequences, milestone celebrations, proactive support, loyalty programs, and win-back campaigns. For a SaaS company with $500K customers at 35% churn, reducing churn to 22% saves $390K annually—often more than acquisition campaigns generate.
Build a systematic approach rather than hoping for organic advocacy. Send review requests 14 days after purchase when satisfaction is highest, create referral programs with meaningful incentives, make sharing easy with pre-written social posts, feature customer success stories, and build community spaces where customers connect.
A post-purchase email sequence asking for reviews increased review volume 340% on average, improving both SEO rankings and conversion rates. Make it frictionless—include direct links and take less than 2 minutes to complete.
Progressive profiling collects customer information gradually over multiple interactions instead of demanding everything upfront. First interaction asks for email only. Second asks for company size. Third asks for specific challenges. Each request comes after delivering value.
This dramatically improves initial conversion rates while still gathering detailed information over time. You convert more leads initially with low-friction forms, then enrich data through subsequent engaged interactions when trust is higher.
Implement cross-device tracking to understand when users start on mobile and finish on desktop. Enable save-for-later features and send reminder emails. Ensure consistent branding and messaging across devices so each interaction feels connected.
Common pattern: prospects see ads on mobile during commute, research on work computer, check reviews on tablet at home, then purchase on mobile or desktop. Make sure abandoned actions on one device can be resumed on another. Email links to saved carts or started applications.
Optimizing stages in isolation rather than the complete journey. When your PPC team optimizes ads separately from your landing page team who works separately from your email team, prospects experience disconnected messaging and contradictory promises.
The ad might promise one benefit, the landing page emphasizes different features, and email nurture discusses completely separate advantages. This confusion kills conversions. Optimize the complete experience, not individual touchpoints.
Use only genuine scarcity and urgency. Real inventory limitations (“Only 3 left in stock”), authentic time-bound offers (actual sale end dates), legitimate seasonal availability, or capacity constraints (limited appointment slots) all create honest urgency.
Fake urgency erodes trust and tanks long-term conversion rates. If you run a “24-hour sale” every week, it stops working. Transparency about actual limitations increases both urgency and trust simultaneously.
B2B journeys are longer (30-180+ days versus minutes-to-days), involve multiple decision-makers (average 6-10 in enterprise deals), require more educational content, emphasize ROI and business outcomes, and depend heavily on trust-building through case studies and demos.
B2C journeys are shorter, more emotional, often single-decision-maker, driven by reviews and social proof, and focus on benefits rather than detailed ROI. Tailor your optimization approach to match these fundamental differences.
Show clients exactly how you improved their conversion rates with automated reports that prove your value.
Start Your Free Trial Today