
Tracking the performance of your LinkedIn Ads campaigns closely will help you see the fruits of your labor in the form of increased engagement, leads, and conversions. But how do you know which metrics to track to get the most accurate picture?
Let’s take a look at the top 8 LinkedIn Ads KPIs that you should be monitoring to optimize your campaigns and drive better results.
What Are LinkedIn Ads?
LinkedIn is the world’s largest professional network, with more than 900 million members in over 200 countries. It’s an excellent place to reach professionals and businesses on their own turf. LinkedIn Ads are paid advertisements on the LinkedIn website. LinkedIn Ads can be in the form of
- Sponsored content
- Sponsored InMail
- Display ads
- Sponsored job ads
These ads are designed to reach business professionals and decision-makers and can be targeted to specific industries, job titles, or company sizes and interest groups.
Why use LinkedIn Ads?
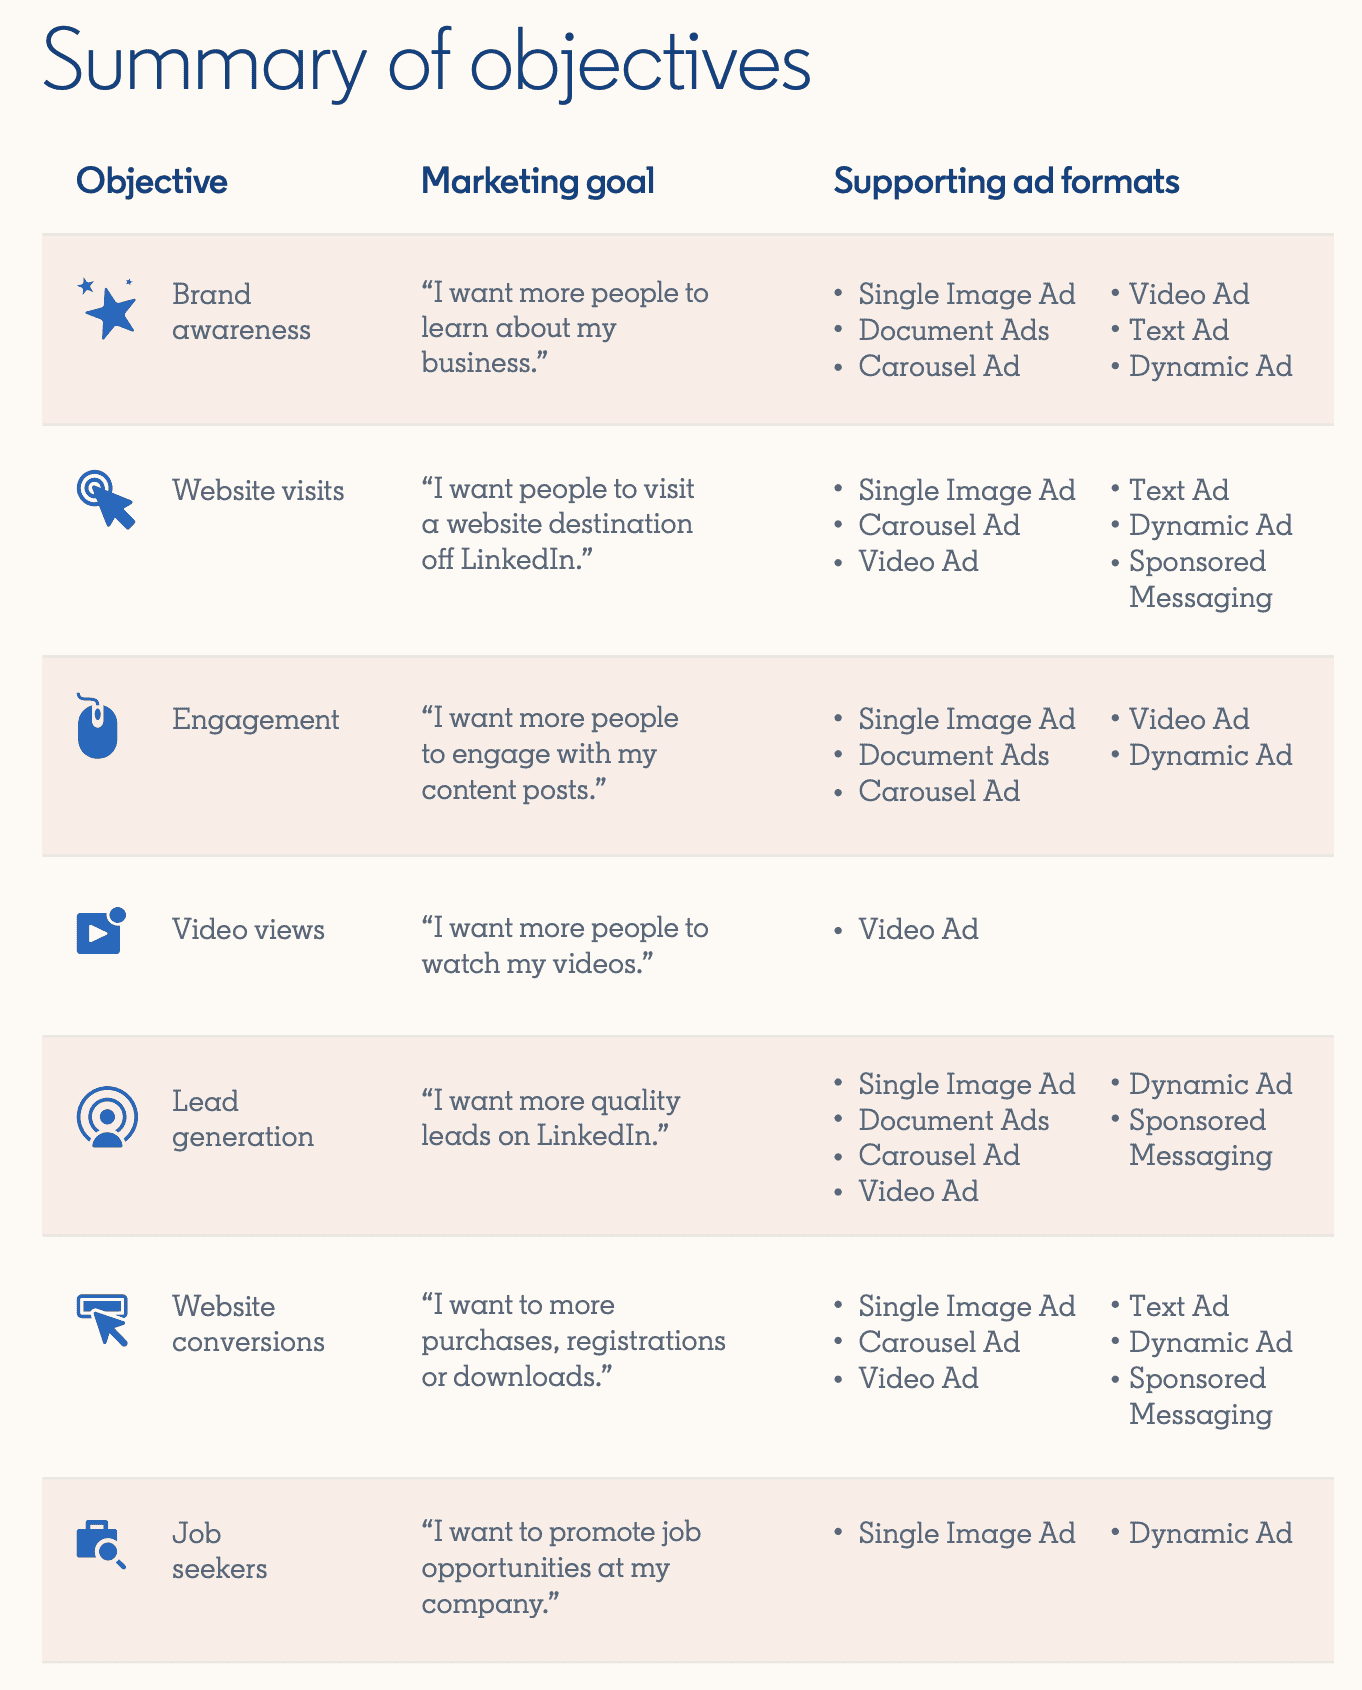
Setting up advertising on LinkedIn can help you achieve brand awareness, improve website conversions and generate leads.
What Metrics Should You Include in Your LinkedIn Ads Report?
If you cannot measure it, you cannot improve it. To cover all your business bases, you not only need to understand reporting metrics but also the context behind those metrics. What are your marketing objectives? Based on those, these are some of the metrics you should be tracking
- Build Brand Awareness: Impressions, Engagement Rate
- Increase Consideration: Clicks, Click-through-Rate
- Drive Leads/Conversions: Conversion Rate, Cost per Conversion, Cost per Lead, Lead Gen form completion
Related: The 5-Minute Guide to Understanding KPIs
Let’s understand, why it is important to include these metrics in your report and what these mean for your marketing goals.
1. Impressions
Impressions refer to the number of times your ad was shown to users on LinkedIn. This is a good metric that will help you understand how many people are seeing your ad, but it is important to note that it doesn’t indicate how well your ad is performing.
2. Click-through Rate
The click-through rate (CTR) measures the percentage of people that viewed your ad and actually clicked on it. A high click-through rate means that people are finding your ads relevant, and it’s a strong indicator that you’re using the right keywords and targeting data.
If you’re running multiple ad campaigns, tracking your average CTR across campaigns will also help you evaluate which campaigns are performing the best.
According to LinkedIn Benchmarks, you should expect
- An average CTR of 0.44% for Sponsored Content
- Text Ads typically see a 0.025% CTR on average
- CTRs for Dynamic Ads can be almost three times as high as Text Ads. On average around 0.08%
3. Cost Per Click
CPC is the cost of an ad divided by the number of clicks. This metric can help you determine how much you’re paying for each click and help you identify which ads are the most cost-effective. According to benchmarking reports for 2022, across all campaign and offer types, LinkedIn advertisers saw an average of $11.03 CPC.
4. Conversions
Conversion rate is the percentage of people who eventually took the action your ad wanted them to take. Such as filling out a form or making a purchase, or signing up for a demo or an event.
To set realistic KPIs setting up LinkedIn conversion tracking will help you better understand the actions people take after viewing or clicking on your ad.
This is a step-by-step process, Stef Osterik, Quality Manager with digital marketing agency Team Nijhuis, explains: “Before setting up conversion tracking it is important to note that the Insights tag is set up appropriately on your website. Make sure you install the LinkedIn Insight Tag and create the conversions you want to measure for your LinkedIn campaigns. To set realistic KPIs, you will have to use the input from LinkedIn to create your campaign. LinkedIn will track conversions, retarget website visitors, and unlock additional insights about members interacting with your ads once you start creating your campaign and setting up your audience.”
Watch this video and learn how to set up LinkedIn conversion tracking and make your conversion reporting smarter and more accurate.
5. Lead Gen Form Fill Completion Rate
89% of B2B marketers use LinkedIn for lead generation and it is also noted that LinkedIn Lead Gen Forms drive 5x higher conversion than landing pages. Reporting on this metric is essential because it helps you understand how many people went beyond clicking your ad and moved forward to completing a favorable action. The benchmark for lead gen form fill completion rate is usually 10%
This metric can be measured by the following conversions:
- LinkedIn or website form completion
- Sign-ups for a trial
- Subscribing to newsletters
Ad Specialist Paul Fairbrother says LinkedIn Lead Gen forms are his go-to method to track the quality of leads: “This is my favorite method as the reporting is accurate. If you collect leads on the website, the reporting isn’t so accurate as Apple’s privacy changes can limit the tracking of the LI Insight Tag.
Pro-tip: Use different landing pages to collect leads. Paul says: “If I’m collecting leads on the website I try and use a separate landing page that is only used for ads traffic. I can keep things simple and say that all leads coming from that landing page must have come from the ad campaigns and not other sources.”
6. Cost Per Lead
Cost per lead (CPL) is the average amount you pay for every customer that contacts you as a result of your ads.
For example, suppose you’ve received 50 leads in a month, but only 25% of them decided to buy something from you. In that case, you may want to consider changing your target audience criteria and experimenting with different interests and traits to drive more revenue. increase that percentage.
7. Cost Per Conversion
(CPC) indicates the average amount you’re paying to get each conversion. This can be attributed to your product costs, so you can determine whether or not you’re earning a profit at the end of the day or need to make any adjustments to your strategy.
It can also be quite tricky to get an accurate estimate of your CPC, so keep in mind that you might have to run it against your historical data if you want to see how much you’re paying for ad conversions.
8. Engagement Rate
This shows you how well your audience interacts with your content. It can be in the form of liking, sharing, or commenting. The engagement rate helps you track how people communicate with your brand. The best time to post on LinkedIn is from Tuesdays through Thursdays to get the most eyeballs. A good engagement benchmark for Linkedin is about 2%, however, it can also go up to 5 or 6%, depending on the content type.
Measuring LinkedIn Conversions and the quality of your leads
LinkedIn ads typically yield high-return leads. Even more, companies can leverage their niche and hit their target audience more accurately than they would be able to on any other platform.
Ads Specialist, Paul Fairbrother, explains his strategy for a successful LinkedIn Ads campaign: “It’s a mix of understanding the quality of leads, reporting, and using specific landing pages for Lead Gen forms. Leads on LinkedIn are expensive. You need to be checking their quality regularly by using a lead scoring tool. I use Breadcrumbs.io which can integrate with your CRM and gives a daily update on lead quality.”
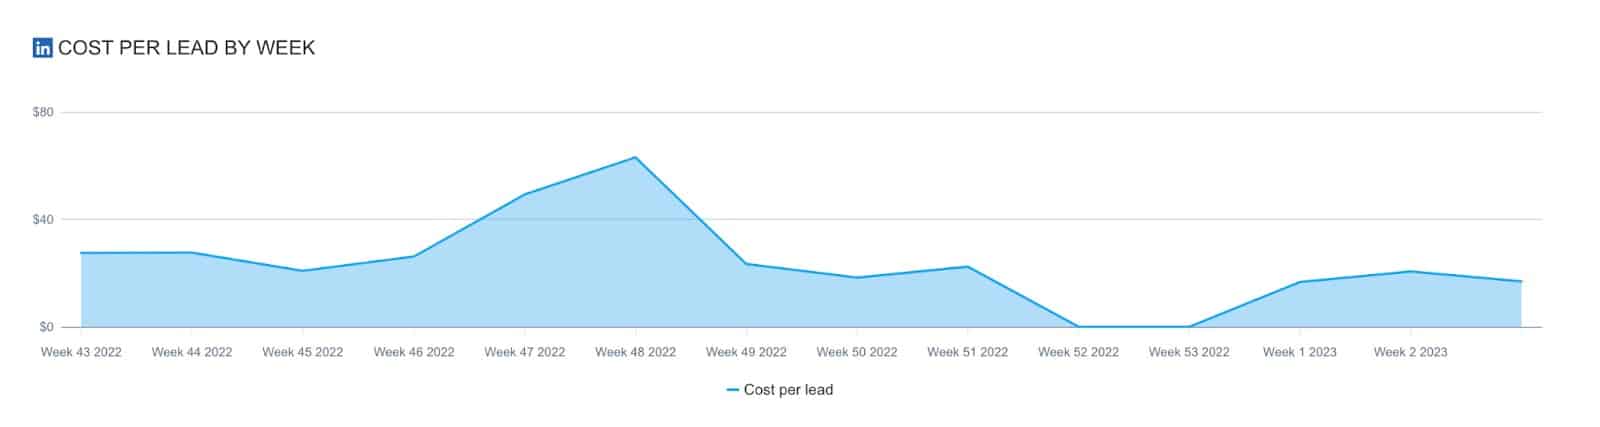
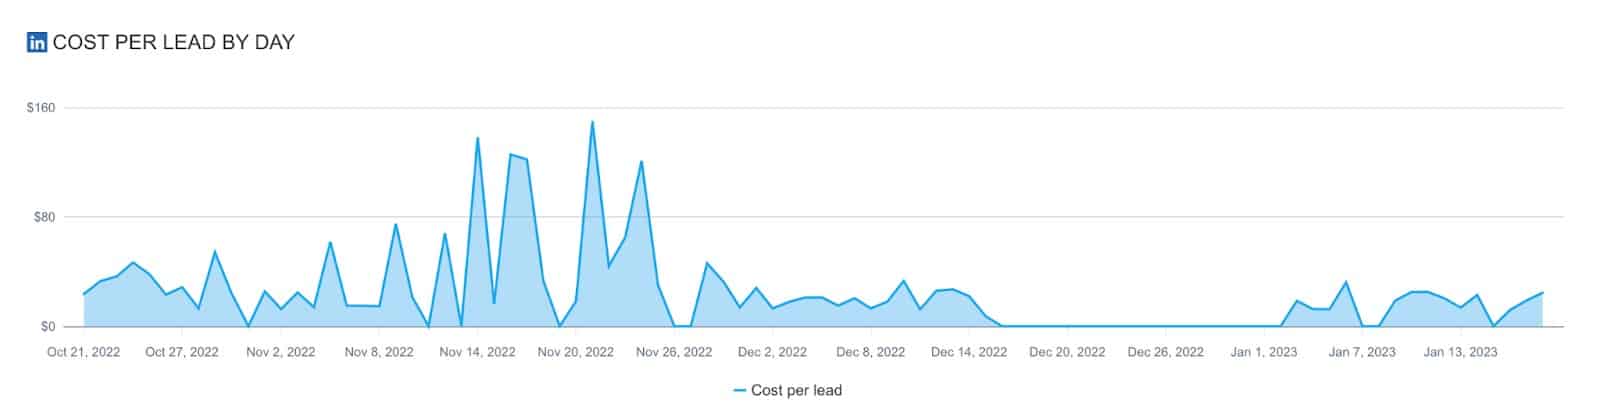
Paul uses Swydo charts and reports to track LinkedIn trends over time. “LinkedIn Campaign Manager has a built-in function called ‘performance chart’ but it’s limited as it only uses daily time intervals. Daily performance can be very random, especially when the cost per lead is high and you only get a handful of leads per week. Therefore I love Swydo’s Linkedin Ads Integration which has an option of using a weekly or monthly time interval for charts. This example shows the cost per lead by day and by week, it’s much clearer to spot the trends using the weekly intervals. Swapping between days/weeks/months is easier with a reporting software like Swydo,” he said.
How To Use Swydo To Improve and Customize Your LinkedIn Ads Reporting
Imagine a world where all your Linkedin Ads data is seamlessly integrated into one platform, easily accessible and understandable. No more wasted time trying to make sense of multiple spreadsheets and reports. Yes! Use Swydo’s LinkedIn Ads Integration to effortlessly track performance, set goals, and monitor social media KPIs to help your clients gain insights into campaign performance and ROI. 👇
- Set goals and monitor your progress toward achieving your goals
- Quickly identify campaigns that need attention and take swift actions to resolve issues
- Save time and increase your efficiency
- Improve decision-making
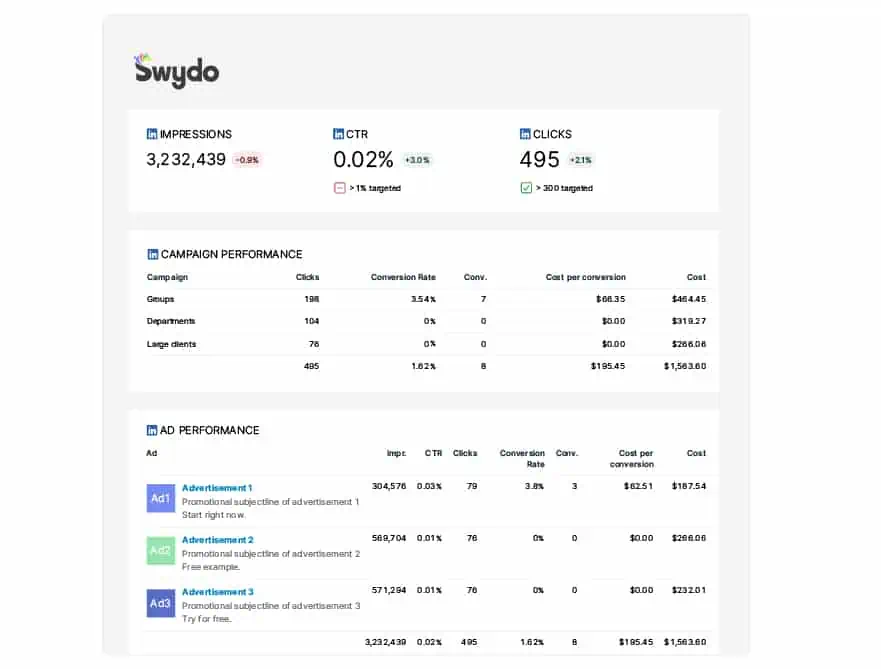
Over 200 LinkedIn Ads metrics available in Swydo
Once you connect a LinkedIn Ads account with Swydo, you’ll have access to over 200 metrics to include and visualize in your LinkedIn Ads performance reports and dashboards. Swydo’s LinkedIn Ads integration provides metrics in three categories – Ad Analytics, Campaigns, and Follower Stats. Some key metrics from Ad Analytics include:
- Ad performance
- Campaign performance
- Clicks
- Comments
- Company page clicks
- Conversion value
- Conversion Rate
- Cost
- Landing page clicks
- Likes
Looking to report on metrics that are specific to your organization or clients? Create your own custom metrics and KPIs for next-level reports that deliver actionable insights to optimize campaign performance and maximize marketing ROI. Setting up your first LinkedIn Ads report with Swydo is easy, but we are happy to help out as needed. Try it for free today or schedule a walkthrough and we’ll show you how to get the most value out of the platform.
Track your essential LinkedIn Ads KPIs in one simple dashboard
Start Your Free Trial