
Your agency is grappling with multiple clients, each with their own data sources, KPIs, and “urgent” reporting requests. But you’re managing them — from under a confusing heap of dashboards, CSVs, and half-baked screenshots. You don’t need another tool that adds to the noise; you need one that cuts through it. Something that works reliably, looks professional, and doesn’t require special technical knowledge to use.
Here’s the real question agencies have struggled with for years: Do you stick with Google’s free but temperamental Looker Studio, or step up to a heavyweight like Tableau and pay for enterprise-level polish? The choice isn’t just about software — it’s about how fast your agency can scale, impress clients, and keep margins healthy.
Here’s a field-tested breakdown of everything agencies need to decide — pricing, integrations, learning curve, scalability, and client experience. We’ll look at where each platform shines, where it fails, and which type of agency gets the most out of each one. By the end, you’ll know exactly which tool matches your agency’s stage of growth.
Why Do Marketing Agencies Need a Reporting Platform?
You can’t keep emailing clients blurry screenshots from Google Analytics or those messy Excel files that take 10 minutes to figure out. If you charge premium agency rates, your reports better look like they’re worth it.
When clients see ROI in a dashboard that makes sense at a glance — not buried in pivot tables — they loosen the purse strings. Imaging it: a client sees a simple chart showing their $10,000 ad spend generated $70,000 in pipeline value. That story sticks. Agencies that show impact clearly don’t just keep clients; they get bigger budgets approved faster.
The right reporting tool also scales with your agency. What works for five clients won’t work for 50, and you need a platform that can handle growth without breaking your workflow or your budget.
What’s the Price Difference?
Let’s start with the elephant in the room — budget. Looker Studio offers a free version that includes basic data visualization and reporting capabilities, which is enough for most marketing agencies that haven’t hit huge scale yet.
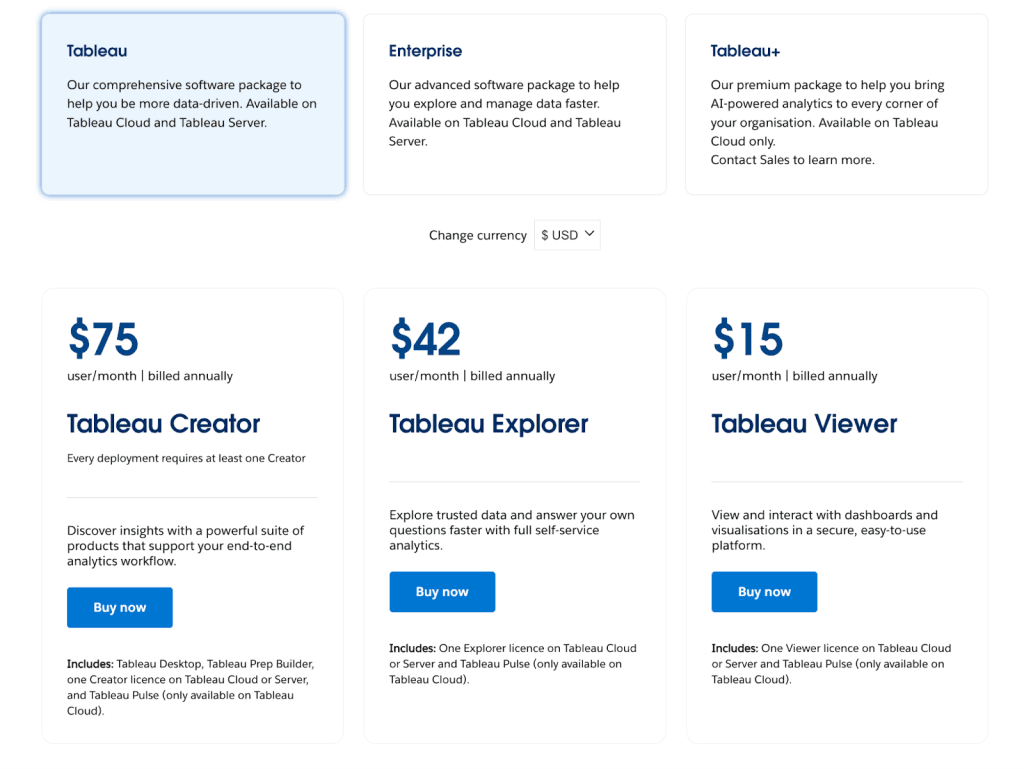
To begin creating reports in Tableau, you’ll need at least one Creator license that starts at $75 per month. If you want teammates or clients to view reports, you’ll also need a viewer license, which costs an additional $15 per month. So a small agency with 3-5 team members creating reports is looking at $200-350 monthly for Tableau versus zero for Looker Studio’s basic features.
However, don’t let Looker Studio’s “free” tag trick you. As your agency grows and client demands for reporting increase, you might find yourself in need of more advanced features or hitting usage limits that make paid alternatives more attractive.
Data Connectivity
The most critical feature for agencies isn’t how pretty the charts look — it’s whether you can plug in all your data sources without headaches. As marketing agencies work with data from Google Ads, Facebook Ads, LinkedIn, TikTok, Google Analytics, Search Console, and likely a dozen other platforms, one-click setup is the ultimate goal.
Looker Studio gives you a lot more connectivity than Tableau. That’s mostly because of Google’s huge ecosystem. With 1200+ data connectors available, it’s flexible and works across tons of different data setups.
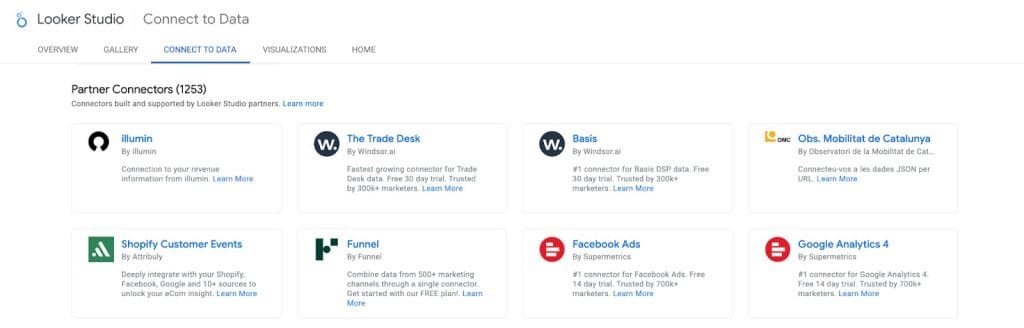
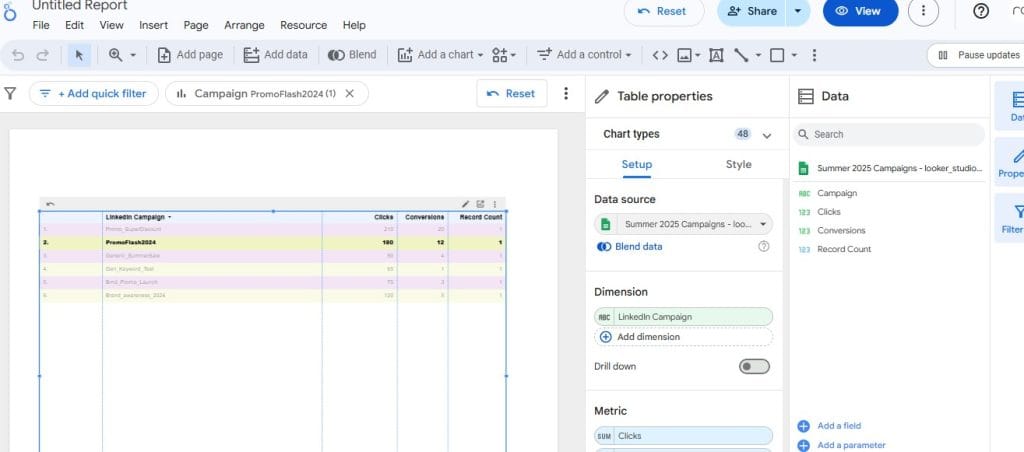
Looker Studio shines here because it’s Google’s very own reporting platform. Native connections to Google Ads, Analytics, Search Console, and YouTube Analytics work seamlessly. Plus, with hundreds of third-party connectors available through partners like Funnel, Windsor, or Power My Analytics, you can connect to virtually any marketing platform your clients use.
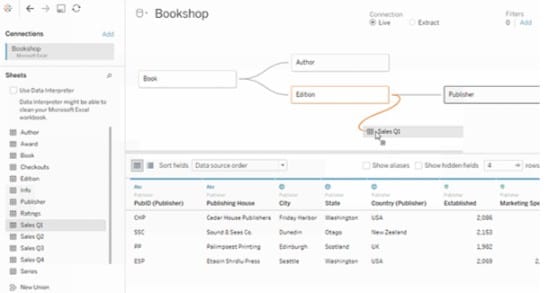
Tableau, while powerful, requires more technical knowledge and setup for marketing-specific integrations. You’ll often need to export data manually or use additional ETL tools to get your marketing data in the right format.
Data Connectivity Comparison — Looker Studio vs Tableau
| Feature | Looker Studio | Tableau |
|---|---|---|
| Native Google connectors | Seamless (Google Ads, Analytics, Search Console, YouTube, BigQuery) | None — requires manual exports or third-party connectors |
| Third-party connectors | 1,200+ via partner marketplace (Funnel, Windsor, Power My Analytics, etc.) | Limited; relies heavily on ETL (extract, transform, load) tools |
| Setup complexity | Plug-and-play for most marketing platforms | Requires technical setup and data prep |
| Best use case | Agencies running multi-channel digital campaigns | Agencies with advanced BI (business intelligence) or mixed data sources |
Visualization Capabilities
Tableau offers some of the best data visualization capabilities among all Looker Studio alternatives. And its features are praised by dozens of users on various community platforms.
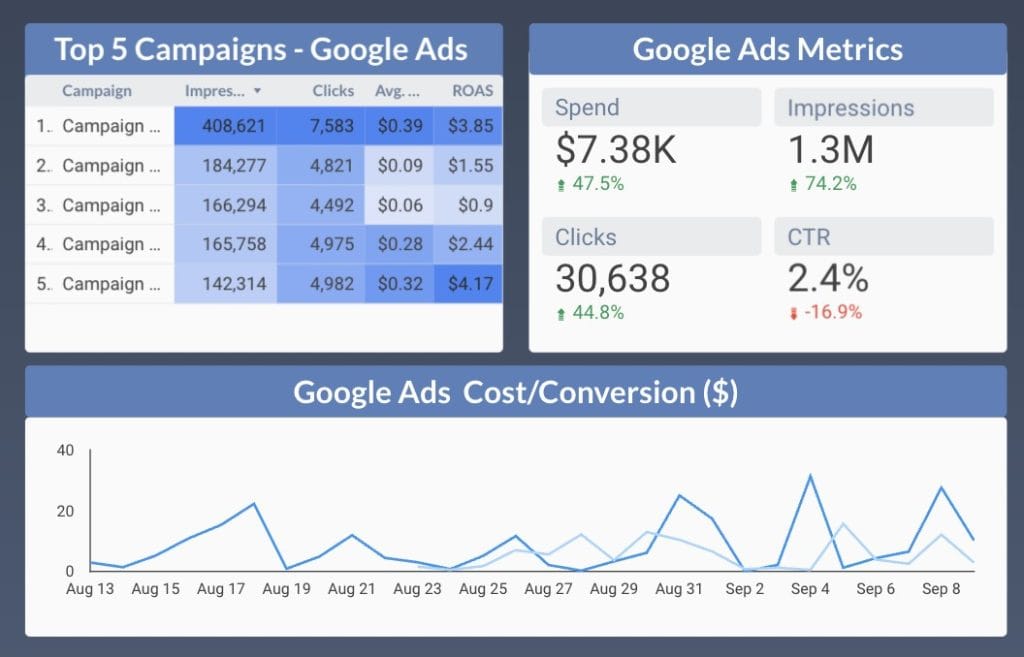
With Tableau, marketing agencies can create complex visualizations or just a simple report with the most vital KPIs. Build interactive dashboards, advanced statistical charts, and virtually unlimited customization options. In practice, Tableau lets you build anything from a basic KPI tracker to a narrative-driven client story that rivals a McKinsey-style boardroom deck.
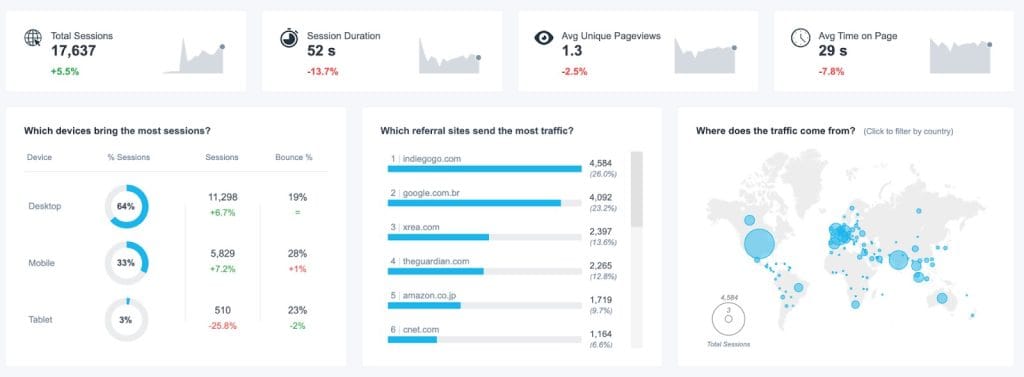
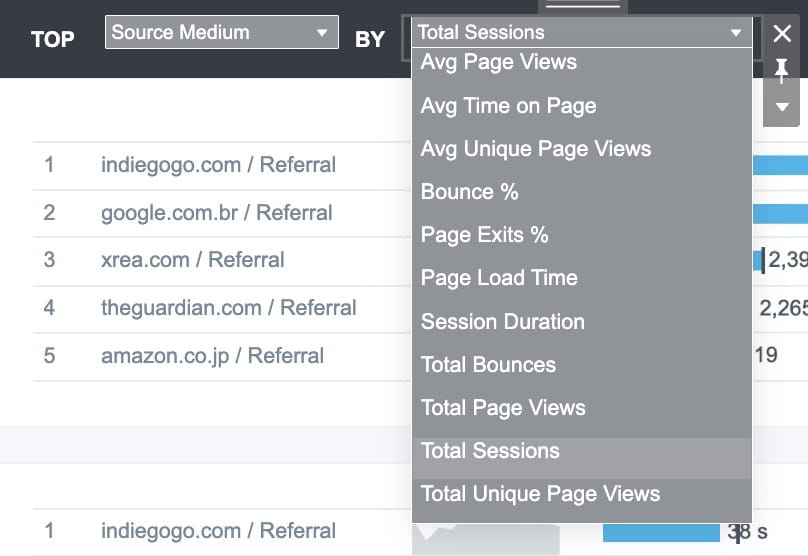
Looker Studio, on the other hand, is a traditional way to sort the data and build a performance report. It gets the job done with clean, professional-looking reports that clients understand. The chart types are more limited, but they cover 90% of what most marketing agencies actually need – line graphs, bar charts, tables, scorecards, and basic geographic visualizations.
For most agency reporting needs — tracking month-over-month performance, comparing campaigns, and displaying key KPIs — Looker Studio delivers everything you need. The real question is whether you require that extra 10% of advanced features that Tableau provides.
Let’s look closer at how the two tools compare.
Basic & marketing-friendly visuals
| Type | Looker Studio | Tableau |
|---|---|---|
| Basic charts | Bar, column, line, area, pie, donut, table, scorecards, combo charts | Same as Looker Studio, plus more styling options |
| Marketing visuals | Time series, bullet charts, scatter plots, treemaps, pivot tables | Same with deeper customization and reference lines |
Maps & advanced analytics
| Type | Looker Studio | Tableau |
|---|---|---|
| Maps | Geo maps (country, region, city, coordinates) | Customizable maps with layers, heatmaps, custom shapes, background imgs |
| Advanced analytics | Limited scatter, trendlines (requires external tools) | Box plots, histograms, heat maps, Gantt, waterfall, Pareto, funnel, bullet graphs |
Interactivity & storytelling
| Type | Looker Studio | Tableau |
|---|---|---|
| Interactive elements | Filters, drop-down selectors, drill-downs | Same, plus advanced interactivity (actions, parameters, tooltips) |
| Custom visuals | Community-built add-ons (funnels, gauges, word clouds) | Fully customizable via Tableau Desktop and Exchange marketplace |
| Storytelling | Page navigation, clickable filters, embedded reports | Story points, parameter-driven storytelling, customizable dashboard flows |
User Experience and Learning Curve
Tableau is incredibly powerful, but your team will need serious training to unlock all of the capabilities. Looker Studio is a better match for digital marketers who need fast integration with Google products.
Looker Studio’s interface mirrors other Google Workspace tools. If your team can navigate Docs or Slides, they can be productive in Looker Studio within hours. For agencies where junior team members need to create and modify reports regularly, Looker Studio’s simplicity is a massive advantage. Less training time means more billable hours and faster onboarding for both new hires and new clients.
Tableau, on the other hand, delivers enterprise-level capabilities, but you’ll also need an upfront investment. Advanced features like statistical modeling, predictive analytics, and complex multi-source data blending require considerable training, and even after that, not every marketer can easily use those features.
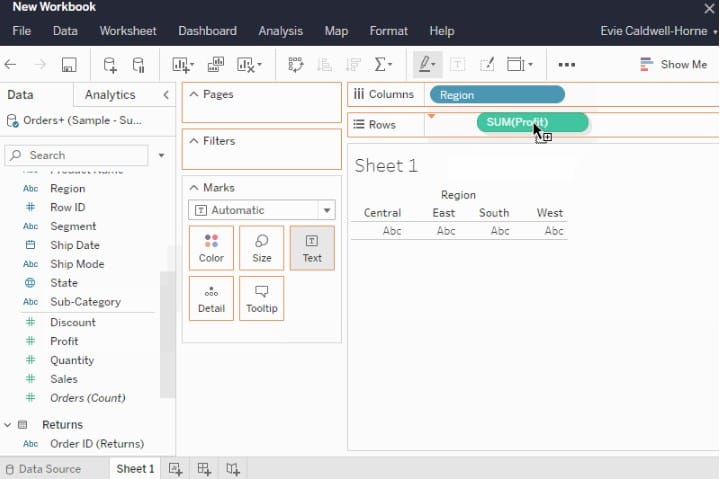
The drag-and-drop interface — powerful but complex — demands a deep understanding of dimensions, measures, and calculated fields to unlock its full potential. Tableau provides tutorials, best practices, and tips to support day-to-day reporting, but your team will still need time and guidance to apply them effectively.
Performance and Scalability
Some marketers know the awkward moment when a client meeting arrives and the performance report won’t load. Understand each platform’s advantages and limits to avoid these painful “still loading…” moments.
Looker Studio
- Free and budget-friendly, but limits creep up fast
- Most connectors handle up to 150,000 rows per query (for example, MySQL); exceed that, and your data is truncated
- Browser display caps at 5,000 rows, which may hide important details
- File uploads: 100MB per dataset, 2GB total per user
- Multiple clients? You’ll hit these limits quickly, forcing choices about which data appears
- Push beyond caps and you risk timeouts or failed refreshes
Tableau
- Handles millions of rows quickly
- Optimized for large datasets with in-memory processing
- Advanced features like statistical modeling, cohort analysis, and predictive forecasts remain stable even with complex data
- Refresh times remain fast, avoiding “still loading” moments
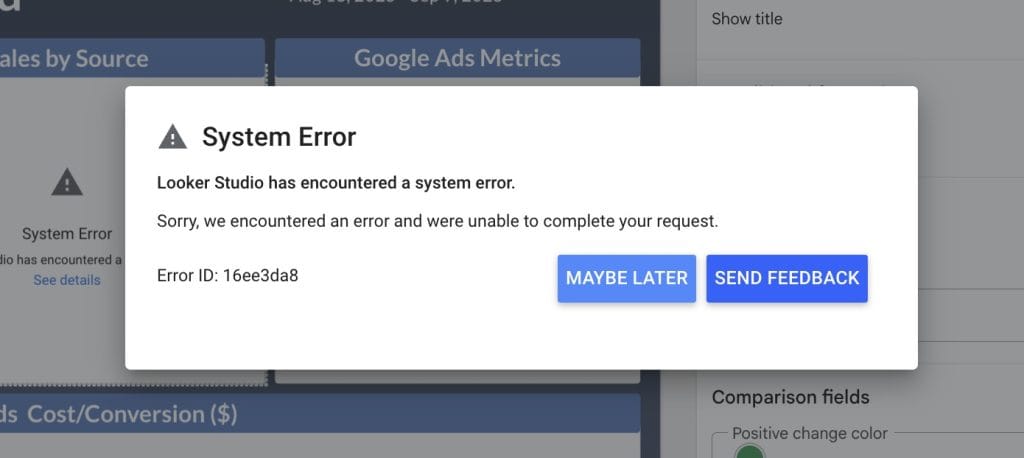
Tableau costs $75 per user monthly but delivers reliable performance. It processes millions of rows in seconds thanks to in-memory analytics. In tests, Tableau handles 10+ million row datasets with refresh times under 5 seconds.
Unlock advanced features like statistical models, deep filters, cohort analysis, and predictive forecasts. These capabilities let you charge consultant rates instead of basic report fees.
Tableau handles multiple connectors without crashing. This beats Looker Studio, whose connectors can fail under heavy loads.
Collaboration and Sharing Features
When you run a marketing agency, collaboration goes beyond keeping your team on the same page. You need to get reports to clients fast. Let them give feedback directly where they see the data. Avoid confusing clients who aren’t tech-savvy.
Looker Studio and Tableau both enable collaboration, but they target different audiences.
Collaboration & Sharing Comparison
| Feature | Looker Studio | Tableau |
|---|---|---|
| Ease of sharing | Share dashboards like Google Docs — add client emails and set view/edit/comment rights instantly | Requires Tableau Server/Cloud setup — manage user licenses and permissions for sharing reports |
| Fit for non-tech users | Feels like other Google tools — most clients navigate without training | Powerful but overwhelming interface — best for users tracking advanced analytics |
| Client collaboration | Clients comment directly on reports — feedback stays tied to data | Limited direct commenting — feedback often happens through separate channels |
| Scalability | Ideal for small to mid-sized client teams with less complex reporting needs | Best for enterprises with advanced analytics needs |
| Agency value | Keeps collaboration lightweight, flexible, and client-friendly | Builds enterprise credibility for agencies serving clients with complex BI needs |
AI Features for Agencies
Marketing agencies need speed, automation, and sharper storytelling from their data. Both Looker Studio with Gemini and Tableau with Tableau Agent and Tableau Next promise to shoulder the grunt work and free your team to focus on strategy. Here’s what they actually deliver:
Looker Studio With Gemini
With a Looker Studio Pro license, you get conversational analytics — just type a normal question and watch it generate charts or tables with explanations. Build calculated fields in plain English so junior team members don’t need to master complex formulas. Gemini connects seamlessly to Google Slides, exporting visuals with written summaries straight into client presentations.
This trims away repetitive manual tasks that quietly drain hours from your team every day. However, you won’t create some in-depth reports with these AI features. Gemini sometimes returns errors or results that don’t fully match what you actually need.
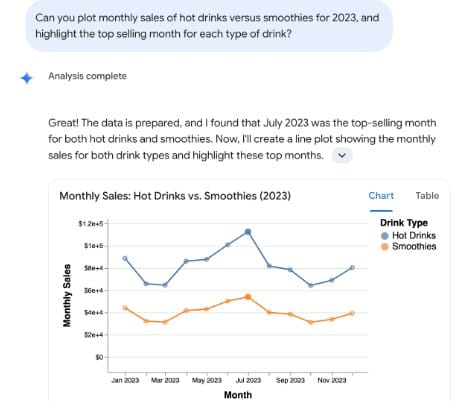
Tableau With Agent and Next
Tableau includes Tableau Agent, which cleans, transforms, and visualizes data using simple language. It suggests questions and builds calculations automatically. The AI agent comes with top-notch security, so you don’t have to worry about exposing confidential client data.
Tableau Next goes further with agentic analytics. It automates data prep, answers questions in context, monitors your data proactively, and lets you take action directly from insights. Think of it like having a full-time junior analyst who never sleeps — running checks at 2 a.m., flagging anomalies, and surfacing fixes before your morning stand-up.

AI Features Comparison
| Feature | Looker Studio (Gemini) | Tableau (Agent/Next) |
|---|---|---|
| Natural language | Chat with your data, build formulas in plain English, export to Google Slides | Prep and visualize data with full conversational AI, get suggested questions, auto explanations |
| Story creation | Export narratives easily to Google Slides | Generate narratives with suggested questions and visual summaries |
| AI automation | Ask on demand, create basic visualizations and calculations | Automate data prep, visualization, proactive alerts, and full assistance |
| Security | Use standard access controls included with Pro | Leverage highest-level security with audit trails and encrypted data |
| Agency fit | Set up quickly for performance reports, prompt easily | Deploy for agencies needing advanced automation features |
Feature-by-Feature Breakdown
Before you move your performance reporting to Looker Studio or Tableau, check the full feature-by-feature comparison:
Ease of use
| Feature | Looker Studio | Tableau (Server / Cloud) |
|---|---|---|
| Learning curve | Beginner-friendly — clients pick it up with little or no training | Steep learning curve — onboard clients so they can navigate reports |
| Training resources | Google’s free docs and community | Extensive documentation, community, Twitter, and email support |
Data & integrations
| Feature | Looker Studio | Tableau (Server / Cloud) |
|---|---|---|
| Data sources | 1200+ connectors, including Google Ads, GA4, Search Console, YouTube, and a range of third-party connectors | 100+ native connectors — get strong support for databases, warehouses, and files |
| Marketing platform integrations | Integrate directly with Google Ads, GA4, SA360, DV360, YouTube, and BigQuery — connect others with third-party tools | Set up or use third-party connectors for ad platforms — get stronger support with warehouses (Snowflake, Redshift, etc.) |
| Data blending | Join data sources with basic blends — track cross-channel KPIs | Blend and model data with advanced AI-powered features |
| Integration complexity | Plug and play with the Google ecosystem — set up quickly for agencies | Use ETL tools, data prep, or technical support for integration |
Collaboration & sharing
| Feature | Looker Studio | Tableau (Server / Cloud) |
|---|---|---|
| Collaboration | Share like Google Docs — set permissions and let clients comment directly in reports | Use enterprise-grade permissions — collaborate internally and manage access for clients |
| Mobile responsiveness | Set dynamic viewing while building reports — watch for widgets breaking on mobile devices | Optimize manually for mobile — rely on apps for power users |
| Sharing options | Export as PDF, share via direct link, or embed | Save in multiple formats — use advanced options like Packaged Workbooks |
Visualizations & Reporting
| Feature | Looker Studio | Tableau (Server / Cloud) |
|---|---|---|
| Visualization types | Choose from a range of basic chart types — keep reports clean for marketing KPIs, tweak more with third-party connectors | Choose from 50+ advanced types — dig into deep analytics, but expect overkill for weekly client reports |
| Custom branding | Apply logos and themes, but keep Google branding visible | Customize fully — create branded, white-labeled reporting portals |
Analytics & Calculations
| Feature | Looker Studio | Tableau (Server / Cloud) |
|---|---|---|
| Calculated fields | Build basic formulas and advanced calculated fields for ROAS, CPC, and other marketing metrics | Build advanced calculations, statistics, and custom logic |
| Predictive analytics | No tools for forecasting available natively | Forecast, cluster, and analyze trends with built-in predictive tools |
| Advanced analysis | Descriptive KPIs with limited analysis | Run deeper analytics and extensive performance audits |
Data Management, Performance & Pricing
| Feature | Looker Studio | Tableau (Server / Cloud) |
|---|---|---|
| Data refresh | Schedule or refresh manually — rely on connectors, often with ~15-minute delays | Automate refreshes with notifications and alerts |
| User management | Tie access to Google accounts — keep it simple for agencies with many small clients | Manage with role-based access — fit enterprises with strict security measures |
| Performance | Expect slowdowns with very large datasets — run best on Google BigQuery | Optimize performance for complex datasets at scale |
| In-house server support | No in-house support — cloud only | Host with Enterprise plans that include server support |
| Offline access | Cloud-only — no offline access | Work offline with Tableau Desktop when needed |
| Pricing | Use free, or upgrade with Pro plan per-license purchase | From $75/user per month |
What Makes Sense for Your Agency
Your choice between Looker Studio and Tableau isn’t about which one is “better.” It’s about your agency’s size and client needs. Are you a small agency, or are you managing Fortune 500 accounts? The gap between them is huge. Pick wrong, and you either drain your budget or spend hours on manual work.
Looker Studio usually fits small to mid-sized agencies
- Use it free, with hundreds of marketing-focused connectors
- Get native integrations with Google Ads, GA4, Search Console, YouTube, and BigQuery
- Navigate a simple, Google-like interface that clients understand without training
- Share reports easily with view, edit, or comment permissions
- Cover essentials like campaign KPIs, trend charts, and clean performance reports
But Looker Studio can fall short:
- Slow down with larger or complex datasets
- Offer limited customization and branding options
- Lack built-in, free connectors for third-party platforms
Tableau targets enterprise needs
- Process millions of rows quickly with powerful analytics features
- Access 50+ advanced visualization types, including forecasting and predictive modeling
- Apply strong security features, granular permissions, and robust data storage
- Customize reports fully, including branded, white-labeled portals
- Scale easily for large datasets and complex reporting setups
Challenges with Tableau for agencies:
- Require paid licenses for every user and client viewer
- Demand a steep learning curve; your team may need formal training
- Often exceed needs if you only report monthly KPIs
The Reporting Growth Curve for Agencies
Compare the features, costs and efficiencies you’ll need at 5, 20 and 50 clients — and see where advanced tools start paying for themselves.
| 5 Clients | 20 Clients | 50+ Clients |
|---|---|---|
| Manual but Flexible | Automate & Standardize | Enterprise-Grade & Profitable |
| Needed features: • Free Looker Studio • Basic Google connectors • Ad-hoc spreadsheetsCost-benefit:• Almost no tool cost but very labor-heavy • Reports take hours per client • Can’t charge extra • Reporting is a cost center | Needed features: • Paid connectors • Swydo or Looker Studio Pro • Templates, scheduled refresh • White-label dashboardsCost-benefit:• Moderate tool spend but big time savings • Time per client drops to <1 hour per week • Can bundle “advanced reporting” into retainers • Start offsetting costs | Needed features: • Data warehouse (BigQuery, Snowflake) • Tableau/Power BI, or advanced Swydo • ETL automation • Client portals with role-based accessCost-benefit:• Higher fixed cost but huge scale • One analyst can service dozens of accounts • Advanced reporting becomes premium upsell • Reporting becomes a revenue stream |
The Best Alternative to Looker Studio and Tableau
We’ve explored Looker Studio and Tableau. But here’s what nobody mentions — neither was actually made for people running marketing agencies. That’s where tools like Swydo come in and actually solve real agency problems.
You won’t need to hire a data scientist just to make a decent report. You also won’t have to apologize to clients for reports that look like they belong on a Windows XP desktop. These platforms are built for agencies already drowning in client work and monthly reporting deadlines.
Why These Agency Tools Work
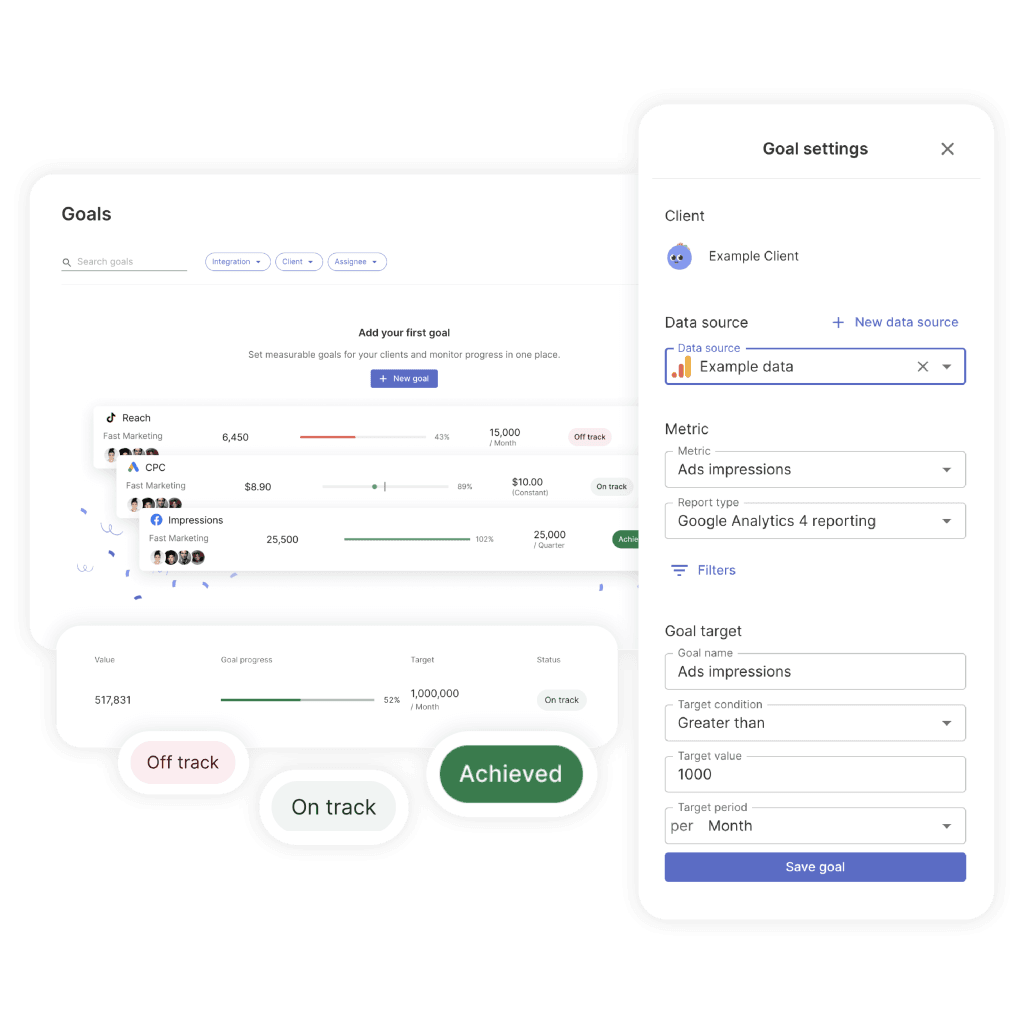
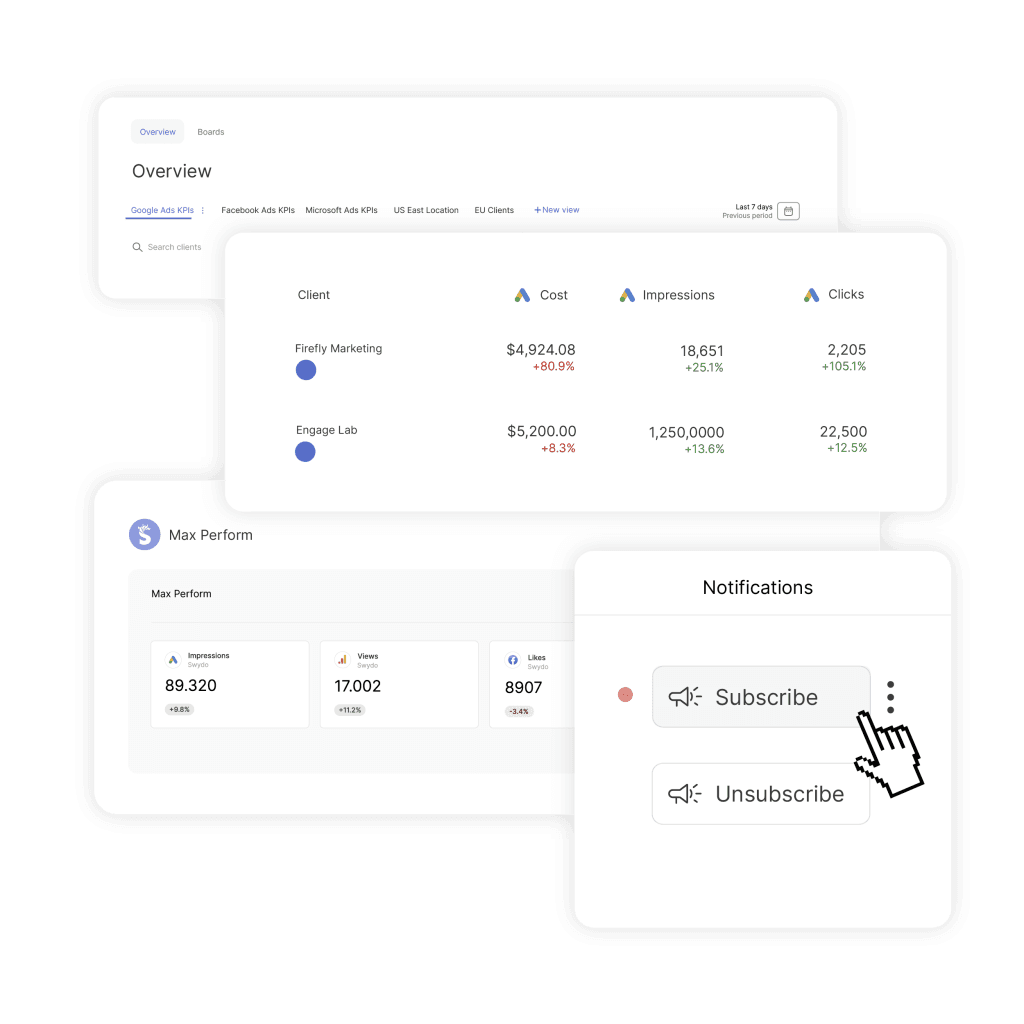
- Automate report scheduling — deliver reports straight to client inboxes weekly or monthly
- Use connectors that actually work — connect Google Ads, Facebook Insights, LinkedIn Pages, TikTok Ads, ActiveCampaign, and more in one click without extra fees
- Drag and drop reports — pick a pre-made template or build from scratch using widgets, text fields, and other flexible features
Rely on solid performance — handle large datasets for big clients without crashes or slowdowns, just like a single-channel report
Tools like Swydo grab the easy sharing from Looker Studio, add the professional polish from Tableau, then ditch everything that makes both of them frustrating for agencies. No massive price tag, no advanced coding knowledge required.
The Smart Path Forward for Agency Reporting
If you’re a smaller agency focused on clean monthly reports, Looker Studio gets the job done without costing a dime. The Google integrations run smoothly, sharing feels effortless, and your team won’t waste hours trying to figure it out
If you’re managing enterprise clients who expect deep analysis — or if you’re done with reports breaking in the middle of a client call — Tableau earns its price tag. It costs more and takes longer to learn, but it delivers features that put it in a different league
Here’s the truth most agencies miss — neither platform was built for them. Tools like Swydo exist because agencies need professional reporting without enterprise headaches or free-tool limits
Choose a platform that solves your real agency problems. The right tool should claw back hours, easily churn out reports that impress clients, and grow with your agency. If you want to see how a purpose-built platform stacks up, try Swydo free for 14 days.
Looker Studio vs Tableau FAQ
Quick answers to help agencies choose the right reporting tool
Yes, Looker Studio has a completely free version with robust reporting capabilities. However, you’ll likely need paid add-ons as you grow: third-party connectors ($50-200/month per data source), Looker Studio Pro for advanced features, and premium support options.
Tableau Creator licenses start at $75/month per user. Viewer licenses cost $15/month for clients who need access. A typical agency setup with 3 creators and 10 client viewers runs about $375/month, plus potential server hosting costs.
Looker Studio is significantly easier. If you can use Google Sheets, you can create reports within hours. Tableau requires weeks of training to use effectively and months to master advanced features like calculated fields and data modeling.
Looker Studio struggles with datasets over 150,000 rows and can only display 5,000 rows in browser tables. For agencies with multiple large clients or historical data analysis, these limits become problematic quickly.
Tableau offers predictive analytics, statistical modeling, advanced calculations, handles millions of rows without slowdowns, provides complete white-labeling, and includes sophisticated data blending across multiple sources. It’s essentially enterprise business intelligence software.
Start with Looker Studio. It’s free, connects instantly to Google Ads and Analytics, and your team can create professional client reports immediately. Only consider Tableau if you already have enterprise clients demanding advanced analytics.
Looker Studio: 30-60 minutes for a basic Google Ads performance report. Tableau: Several hours to days, depending on your technical background and data complexity. Most agencies can be productive in Looker Studio immediately.
Looker Studio requires minimal technical skills—similar to using Google Workspace tools. Tableau demands understanding of data structures, calculated fields, and often requires formal training or hiring someone with existing Tableau experience.
Yes. Looker Studio is completely free to test. Tableau offers a 14-day free trial of Tableau Desktop. However, testing Tableau properly requires connecting your actual data sources and learning the interface, which takes significant time investment.
Looker Studio connects to Google Ads natively in one click—just authorize your account. Tableau requires manual data exports, ETL tools, or third-party connectors like Funnel or Supermetrics to get Google Ads data in the right format.
Both require third-party connectors for Facebook Ads. Looker Studio has more marketing-focused connector options through partners like Windsor and Power My Analytics. Tableau typically requires more expensive ETL solutions or manual data preparation.
Yes, both platforms blend data, but differently. Looker Studio offers basic data blending suitable for combining Google Ads with Analytics data. Tableau provides advanced data modeling and complex multi-source relationships that enterprise clients often require.
Looker Studio offers 1,200+ connectors through its partner marketplace, covering most marketing platforms. Tableau has fewer native connectors but handles custom databases and file imports better. For unsupported sources, both platforms accept CSV uploads.
Looker Studio refreshes Google data sources every 15-30 minutes, third-party connectors vary by provider. Tableau allows custom refresh schedules but requires Tableau Server for automation. Both platforms support manual refresh when needed.
Looker Studio sharing works like Google Docs—add client emails with view/edit/comment permissions. Tableau requires Tableau Server or Cloud setup with managed user licenses, making client access more complex and expensive to scale.
Looker Studio allows basic branding (logos, colors) but always shows “Report created with Looker Studio.” Tableau offers complete white-labeling and custom client portals, which justifies premium pricing for agencies serving enterprise clients.
Looker Studio reports can timeout with large datasets or multiple connectors, especially during client meetings. Tableau handles complex data and multiple users more reliably, with faster load times even for sophisticated visualizations.
Looker Studio Pro offers scheduled email delivery of reports as PDFs. Tableau provides more sophisticated automation through Tableau Server, including conditional alerts and custom distribution lists, but requires additional setup and licensing costs.
Yes. Agency-specific platforms like Swydo, AgencyAnalytics, and ReportGarden combine ease-of-use with professional features. They cost $50-200/month but include automated scheduling, white-labeling, and pre-built marketing templates without technical complexity.
Switch when manual reporting takes more than 2 hours per client weekly, when clients request more sophisticated analysis, or when report quality affects your ability to retain or attract premium clients. The time savings quickly justify tool costs.
Calculate hours saved per month × your hourly rate, plus any additional revenue from improved client retention or premium pricing for professional reports. Most agencies see positive ROI within 3-6 months when tools save significant manual work.
Skip the complexity of Tableau and limitations of Looker Studio—get professional agency reports in minutes.
Start Your Free Trial Today