
Every marketing agency eventually hits a wall with their client reporting tools. Maybe it’s the third time this week your dashboard integrations disconnected overnight. Perhaps you just watched your monthly bill jump because you added five new clients. Or you’ve spent hours trying to customize a report that still doesn’t quite tell the story your client needs to hear.
If you’re running an SEO, PPC, social media, or full-service marketing agency, your reporting platform shapes how clients perceive your work. A clunky tool doesn’t just waste your time—it undermines the professionalism you’ve worked hard to build.
This guide cuts through the noise to help you evaluate whether AgencyAnalytics (or one of its competitors) actually fits how your agency operates today and how you plan to grow tomorrow.
AgencyAnalytics Alternatives at a Glance
Compare pricing, features, and capabilities to find the best fit for your agency

AgencyAnalytics
Swydo
DashThis

Whatagraph
Databox
ReportGarden
Looker Studio
Raven Tools
Klipfolio
Cyfe
NinjaCat
TapClicks
Core Capabilities
Additional Info
What AgencyAnalytics Does Well and Where It Falls Short
Before exploring alternatives, you need a clear picture of what AgencyAnalytics offers and where it genuinely falls short. This context helps you identify which limitations actually matter for your agency’s workflow.
The Core Platform and Its Intended Use Case
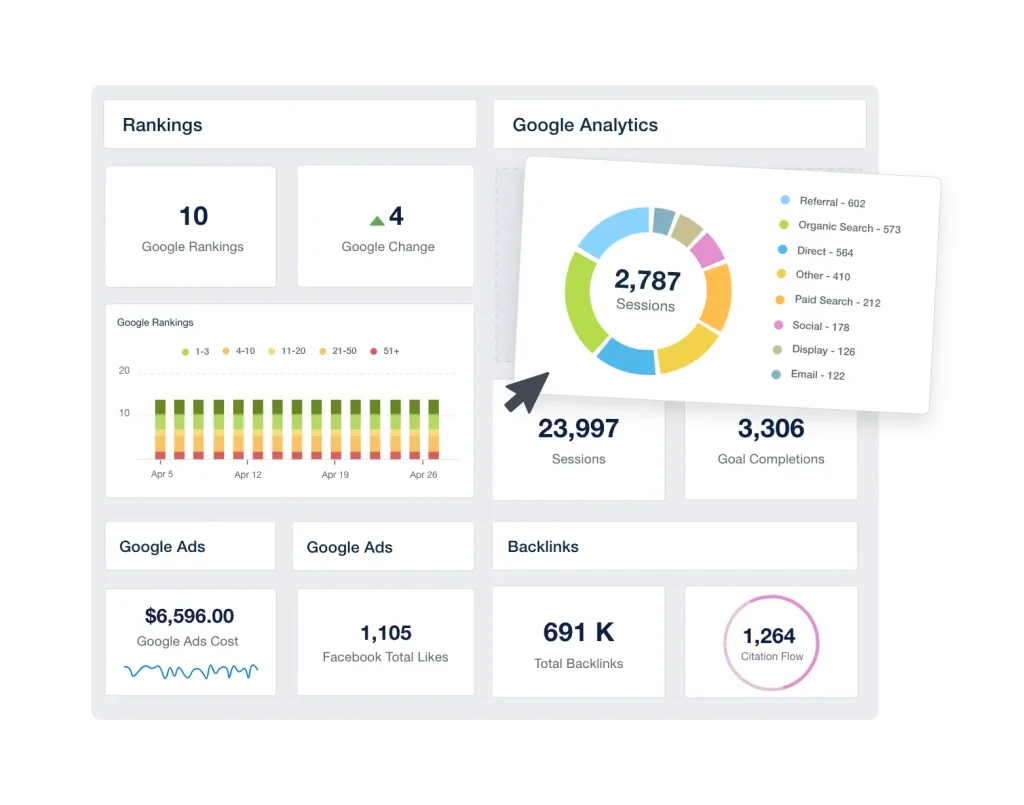
AgencyAnalytics positions itself as an all-in-one reporting platform built specifically for marketing agencies. It pulls data from over 80 integrations—Google Analytics 4, Google Ads, Meta Ads, SEO tools, social platforms—and packages them into white-labeled dashboards and automated reports you can send to clients.
The platform includes built-in SEO tools like rank tracking, site audits, and backlink monitoring, which means you don’t necessarily need separate subscriptions for those capabilities. For many small agencies managing 5-15 clients who need standard reporting without deep customization, this combination works well.
Current Pricing With Monthly and Annual Options
AgencyAnalytics restructured its pricing in late 2024 and again in October 2025. Here’s what you’re actually looking at with both billing options:
| Plan | Monthly Billing | Annual Billing | Clients Included | Additional Clients |
|---|---|---|---|---|
| Freelancer | $79/month | $59/month | 5 clients | $20/month each |
| Agency | $239/month | $179/month | 10 clients | $20/month each |
| Agency Pro | $479/month | $349/month | 15 clients | $20/month each |
| Enterprise | Custom | Custom | Custom | Custom |
The per-client add-on cost doubled from $10 to $20 in October 2025. At 30 clients on the Agency plan with annual billing, you’re paying $179 base plus $400 in add-ons—$579/month before any other extras.
The Problems Users Report Most Often
After reviewing hundreds of user reviews across G2, Capterra, and TrustRadius, plus Reddit discussions from agency owners, certain issues surface consistently.
Integration reliability concerns. Multiple reviewers describe connections that “frequently break” or take 2-3 days to fetch data. When scheduled reports go out with blank sections because an integration silently disconnected, you look unprofessional to clients—even though it wasn’t your fault.
Customization limitations. Users describe report layouts as “rigid.” There’s no master template system—if you need to make the same edit across 50 client reports, you’re doing it manually, one by one. Custom metrics are limited to 15 combinations, and cross-channel data blending isn’t available.
Feature gating. Many capabilities agencies consider essential—bulk operations, API access, custom domains, forecasting—are locked behind the Agency Pro tier ($479/month monthly or $349/month annually). One G2 reviewer noted they were “forced to upgrade to the most expensive plan” when they needed features previously available on lower tiers.
Scaling costs. The per-client surcharge adds up quickly. Reddit users describe the pricing model as “punishing growth.”
The Reasons Agencies Stay Despite These Issues
It wouldn’t have 7,000+ agency customers if it didn’t do some things well:
- Fast initial setup. You can connect integrations and build a basic report within an hour. The learning curve is gentle.
- Customer support. Reviews consistently praise responsive chat support—unusual for this price point.
- 14-day free trial. No credit card required, which lets you genuinely test the platform.
How Different Agency Types Have Different Reporting Needs
Before diving into specific alternatives, you need to understand what your agency actually requires. Different agency types have fundamentally different needs, and choosing a tool optimized for the wrong use case creates friction you’ll feel every day.
What SEO Agencies Need From a Reporting Platform
Your clients care about rankings, organic traffic trends, and the technical health of their websites. You need:
- Daily rank tracking across multiple locations and devices
- Backlink monitoring with authority metrics
- Site audit capabilities that identify technical issues
- Google Search Console integration with historical data
- Competitor analysis to show clients where they stand
Key question: Does the tool have native SEO capabilities, or will you need to pay for separate integrations to SEMrush, Ahrefs, or Moz?
What PPC Agencies Need From a Reporting Platform
Your value comes from managing advertising budgets efficiently across channels. You need:
- Support for Google Ads, Meta Ads, LinkedIn Ads, TikTok Ads, and Microsoft Ads
- Budget and spend tracking with pacing alerts
- ROAS and conversion tracking across platforms
- The ability to blend data from multiple ad accounts into unified views
- Historical comparison capabilities to show improvement over time
Key question: Can you actually combine Google Ads and Meta Ads spend into a single “total ad spend” metric without manual calculation?
What Social Media Agencies Need From a Reporting Platform
Your clients want to see their audience growing and engaging. You need:
- Coverage across Facebook, Instagram, LinkedIn, TikTok, YouTube, and Twitter/X
- Engagement metrics that go beyond vanity numbers
- Content performance analysis showing what’s actually working
- Competitor monitoring capabilities
- Posting schedule analytics
Key question: Does the platform actually pull granular engagement data, or just surface-level metrics?
What Full-Service Agencies Need From a Reporting Platform
You’re juggling SEO, PPC, social, and potentially email, PR, and content. You need everything above, plus:
- Predictable cost scaling as you add clients
- Cross-channel dashboards that tell a unified story
- White-labeling that extends to custom domains and emails
- Automated reporting that actually saves time at scale
- Team collaboration features with permission controls
Key question: At 50 clients with full-service reporting needs, what does this tool actually cost—including all add-ons and hidden fees?
12 AgencyAnalytics Alternatives Ranked by Use Case
The reporting tool market splits into distinct categories, each serving different agency needs. Understanding where each alternative fits helps you narrow your evaluation to tools that actually match your requirements.
Agency-Focused Reporting Platforms That Compete Directly
These tools compete directly with AgencyAnalytics, targeting marketing agencies with similar feature sets but different pricing models and capabilities.
Swydo
What it is: A budget-friendly option particularly popular with PPC-focused agencies, charging per data source rather than per client.
Current pricing:
| Usage Level | Monthly Cost (USD) |
|---|---|
| Base plan | $69/month (includes 10 data sources) |
| 11-100 data sources | $4.50 per additional source |
| 101-500 data sources | $3.00 per additional source |
| 501+ data sources | $2.00 per additional source |
What makes it different: The sliding scale pricing rewards growth—the more data sources you connect, the cheaper each one becomes. Unlike AgencyAnalytics where scaling costs compound, Swydo’s model becomes more economical at higher volumes.
All Swydo plans come with AI Reporting, so you get automatic report summaries and can ask questions about your data directly inside the platform.
All features, users, and clients are unlimited from day one. There’s no feature gating between plan tiers.
Integration coverage: 30+ native integrations. Covers major advertising and analytics platforms but has fewer social media integrations than competitors.
Where it falls short: The integration library is smaller than AgencyAnalytics or Whatagraph. The interface, while functional, is less visually polished than competitors.
Best fit: PPC-focused agencies managing many ad accounts who need solid reporting without premium pricing. The data source model particularly benefits agencies whose clients have multiple ad accounts each.
Whatagraph
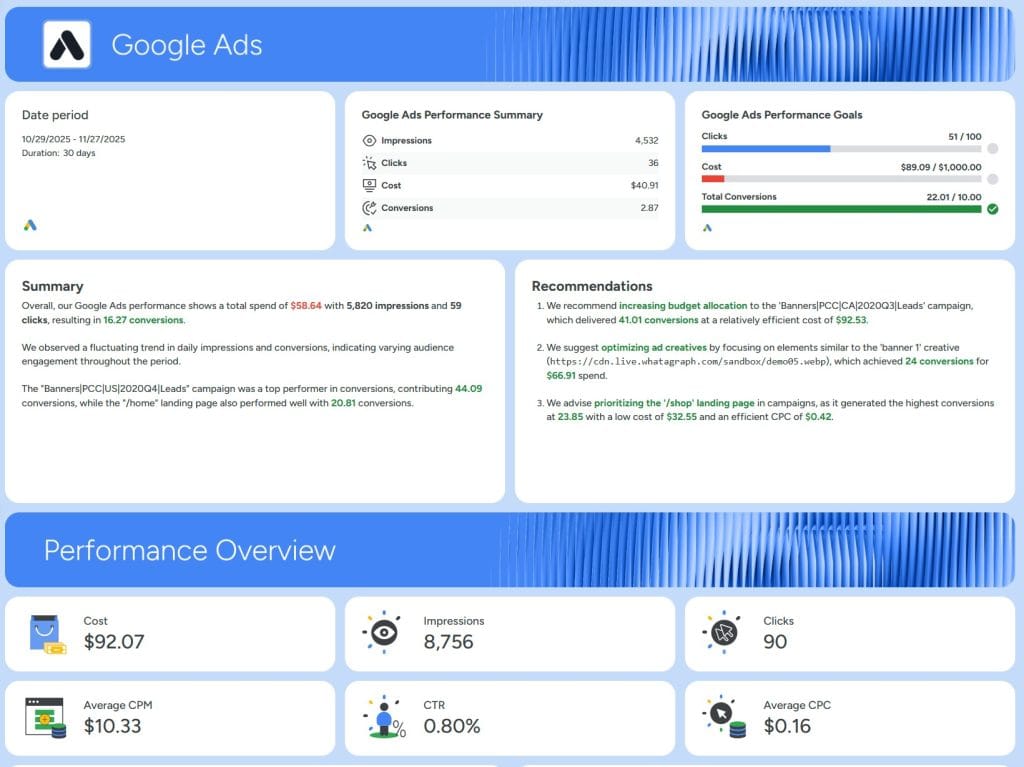
What it is: A marketing intelligence platform that positions itself as the premium alternative to AgencyAnalytics, focusing heavily on visual report quality and data blending capabilities.
Current pricing:
| Plan | Annual Billing | Source Credits | Users |
|---|---|---|---|
| Free | $0 | 5 | Unlimited |
| Start | $286/month) | 20 | Unlimited |
| Boost | $724 /month | 60 | Unlimited |
| Max | Custom | 100+ | Unlimited |
What makes it different: Whatagraph doesn’t charge per client or per user—pricing is based on “source credits,” where each connected data account (like one client’s Facebook Ads account) uses one credit. This model works well for agencies with clients who have multiple ad accounts each.
The platform includes “Whatagraph IQ,” an AI feature available on all plans that generates report summaries, creates themes from uploaded brand images, and answers questions about your data through a chatbot interface.
Integration coverage: 55+ native integrations covering major advertising, analytics, and social platforms. Notably, it includes data warehouse destinations (BigQuery, Looker Studio) that AgencyAnalytics lacks.
Where it falls short: No built-in SEO tools—you’ll need to connect external SEO platforms. The premium positioning means it’s significantly more expensive than AgencyAnalytics for smaller agencies. Some users report slower data refresh rates compared to competitors.
Best fit: Agencies with 20+ clients who prioritize beautiful, highly customized reports and have budget to match. The unlimited users model works well for larger teams.
DashThis
What it is: A simplicity-first dashboard platform that charges based on the number of dashboards you create, not per client or data source.
Current pricing:
| Plan | Monthly Billing | Annual Billing | Dashboards | Users/Data Sources |
|---|---|---|---|---|
| Individual | $49/month | $42/month | 3 | Unlimited |
| Professional | $159/month | $135/month | 10 | Unlimited |
| Business | $309/month | $264/month | 25 | Unlimited |
| Standard | $479/month | $409/month | 50 | Unlimited |
What makes it different: The dashboard-based pricing model is refreshingly simple—you know exactly what you’ll pay regardless of how many clients or integrations each dashboard contains. All features are available on all plans, including white-labeling on Professional and above.
DashThis focuses specifically on making beautiful dashboards quickly. It includes 50+ preset templates and emphasizes speed over deep customization.
Integration coverage: 34+ native integrations. Recently added TikTok Ads, Reddit Ads, and Pinterest. All plans include unlimited data sources.
Where it falls short: Limited customization compared to more complex tools. No data blending across sources. No public API for custom integrations. No AI features in the core product (AI Insights Pro is available as a $15-19/month add-on). One reviewer noted that needing multiple dashboards per client (for different report types) can quickly escalate costs.
Best fit: Freelancers and small agencies who value simplicity and predictability over advanced features. The pricing model works well if you only need one comprehensive dashboard per client.
ReportGarden
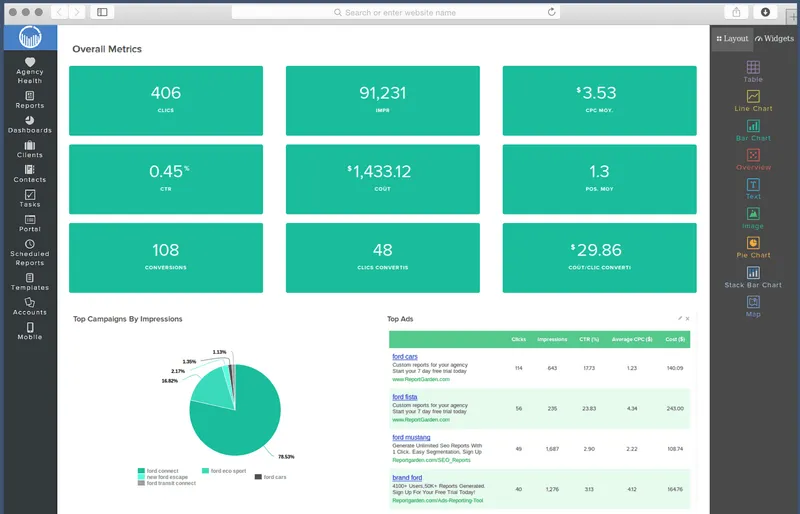
What it is: A full-service agency platform that combines client reporting with invoicing, proposals, and project management tools.
Current pricing:
| Plan | Monthly Billing | Annual Billing | Clients |
|---|---|---|---|
| Standard | $99/month | $89/month | 10 clients |
| Professional | $169/month | $149/month | 20 clients |
| Agency | $299/month | $249/month | 50 clients |
| Enterprise | $749/month | $649/month | 100 clients |
What makes it different: ReportGarden goes beyond reporting to include SEO audit tools, proposal templates, invoicing, and time tracking. If you need an all-in-one agency management system rather than just a reporting tool, this integration of operational features saves you from stitching together multiple tools.
The platform includes budget pacing for ad campaigns and cross-client data blending capabilities.
Integration coverage: 22+ integrations with major advertising, analytics, and SEO platforms.
Where it falls short: Fewer integrations than competitors focused purely on reporting. The broader feature set means the reporting-specific capabilities aren’t as deep as dedicated tools. Some users report a steeper learning curve.
Best fit: Full-service agencies who want client reporting, invoicing, and proposals in a single platform—particularly those currently paying separately for each of these tools.
Enterprise Platforms for Large-Scale Operations
When agencies outgrow mid-market tools, these platforms offer the depth and customization that larger operations require. The price points are higher, but so is the capability ceiling.
NinjaCat
What it is: An enterprise-grade reporting and campaign monitoring platform with 150+ integrations, built for large agencies managing hundreds of clients.
Pricing: Custom pricing starting around $3,000/contract. Implementation typically takes 4-6 weeks with dedicated onboarding support.
What makes it different: NinjaCat’s depth of integrations—including call tracking, franchise rollup reporting, and AI-powered presentation generation—goes beyond what mid-market tools offer. The platform can handle complex multi-location and franchise reporting scenarios that would be difficult to replicate in simpler tools.
Where it falls short: The learning curve is significant—users report onboarding taking 3+ hours of training sessions. Some reviewers mention data loading delays and integration reliability issues. The price point puts it out of reach for smaller agencies.
Best fit: Large agencies managing 100+ clients, franchise operations with complex rollup reporting needs, or organizations with dedicated reporting staff who can fully utilize the advanced capabilities.
TapClicks
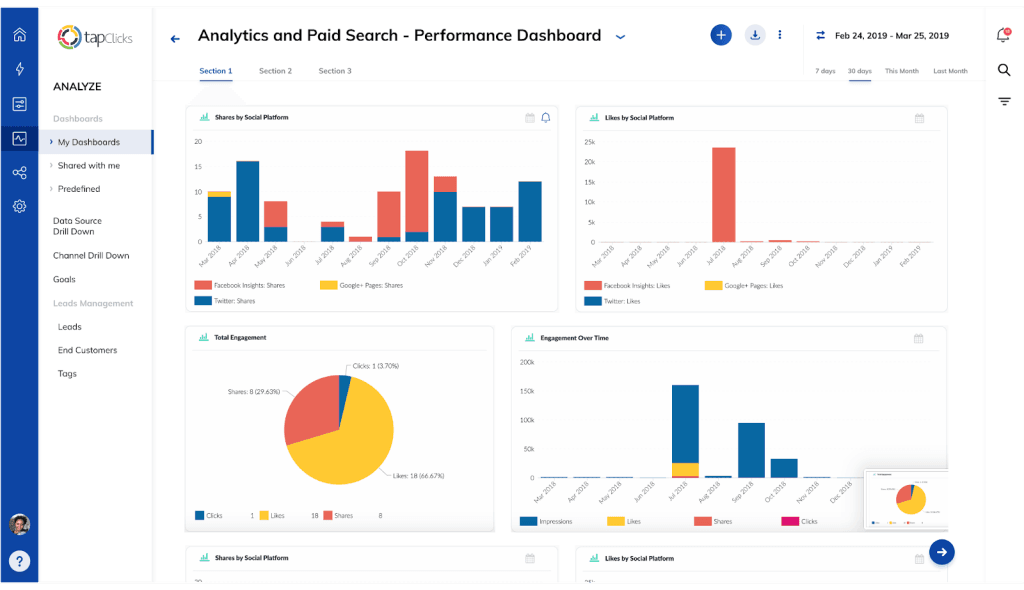
What it is: The most comprehensive marketing operations platform, with 250+ integrations and enterprise-grade data transformation capabilities.
Pricing: Custom pricing typically ranging from $350-1,750+/month depending on data volume and features. Implementation is included for enterprise accounts.
What makes it different: TapClicks offers capabilities that go beyond reporting into true marketing operations—including AI-powered SmartSlides that automatically generate presentation decks, order management systems, and workflow automation. The integration breadth is unmatched in the category.
Where it falls short: The complexity requires dedicated implementation time and ongoing management. This isn’t a tool you set up in an afternoon. The pricing makes sense only for agencies with significant reporting volume.
Best fit: Enterprise marketing teams and large agencies with complex data transformation needs, multi-channel attribution requirements, or those who need to automate presentation creation for high-volume client reporting.
BI and Data Tools That Require Technical Assembly
These platforms offer more flexibility than packaged reporting tools, but require technical capability to implement effectively. They’re building blocks rather than complete solutions.
Google Looker Studio
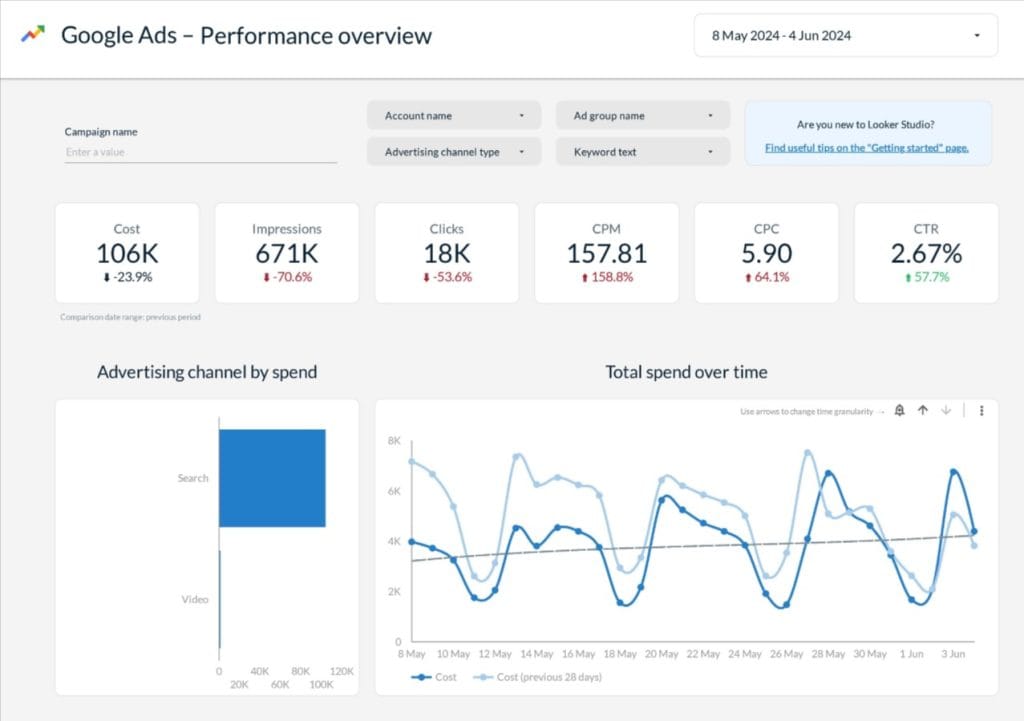
What it is: A free data visualization platform from Google that lets you build custom dashboards and reports.
Pricing: The platform itself is free. However, connecting non-Google data sources typically requires paid third-party connectors:
| Connector Service | Starting Price (USD) |
|---|---|
| Supermetrics for Looker Studio | $37/month (annual) or $45/month (monthly) |
| Funnel.io | Custom pricing |
| Porter Metrics | $25/month |
What makes it different: Complete customization freedom. You can build literally anything—if you have the technical skill. The 1,000+ partner connectors mean almost any data source can be connected somehow.
Where it falls short: There’s no built-in client portal, white-labeling, or report scheduling without add-ons. Non-Google data sources require paid connectors. The learning curve for complex dashboards is steep. You’re essentially building and maintaining a reporting system rather than using one.
One Reddit user described it bluntly: AgencyAnalytics dashboards are “mediocre” but comparable to “what could be built for free in Looker Studio”—which cuts both ways depending on your technical capability.
Best fit: Technically capable agencies who want complete control over their reporting and are willing to invest time in building and maintaining custom solutions. Works well when the Google ecosystem (GA4, Google Ads, Search Console) is your primary data source.
Databox
What it is: A BI-focused dashboard platform that bridges the gap between simple reporting tools and full business intelligence systems.
Current pricing:
| Plan | Monthly Billing | Annual Billing | Data Sources | Key Features |
|---|---|---|---|---|
| Professional | $199/month | $159/month | 3 included (+$7/source monthly, +$5.60 annual) | Unlimited dashboards, 130+ integrations |
| Growth | $499/month | $399/month | 3 included (+$7/source monthly, +$5.60 annual) | AI summaries, datasets, benchmarks |
| Premium | $999/month | $799/month | 100 included | Forecasting, OKRs, dedicated analyst |
What makes it different: Databox positions itself as “modern BI” for teams that need answers now. The platform includes benchmark data comparing your clients’ metrics against similar companies—genuinely useful for demonstrating relative performance. The Growth plan’s AI summaries can automatically generate narrative explanations of dashboard data.
Integration coverage: 130+ integrations including database connections (MySQL, BigQuery, PostgreSQL) for pulling custom data.
Where it falls short: White-labeling is limited compared to agency-focused tools. Some users report slow customer support response times. The data source-based pricing can escalate quickly for agencies with many clients. Several reviewers describe persistent integration issues, particularly with Meta and LinkedIn data.
Best fit: In-house marketing teams or agencies that need BI capabilities (benchmarking, forecasting, OKRs) alongside client reporting. Less suitable for agencies prioritizing white-labeled client-facing dashboards.
Supermetrics
What it is: A pure data connector—not a reporting tool itself—that moves marketing data from source platforms to visualization tools and data warehouses.
Current pricing:
| Destination | Monthly Billing | Annual Billing |
|---|---|---|
| Looker Studio | $45/month | $37/month |
| Google Sheets | $35/month | $29/month |
| BigQuery | $119/month | $99/month |
| Power BI | $119/month | $99/month |
What makes it different: Supermetrics connects 150+ data sources to your choice of visualization tools or data warehouses. If you’re already invested in Looker Studio, Power BI, or Tableau, Supermetrics is how you get marketing data into those platforms without manual exports.
Where it falls short: You still need a separate visualization tool—Supermetrics doesn’t create reports. Costs multiply quickly if you need multiple destinations. The per-connector pricing model can get expensive for agencies using many data sources.
Best fit: Agencies with established data infrastructure who need to move marketing data into existing BI tools or data warehouses. Pairs naturally with Looker Studio for a “build-your-own” reporting solution.
Specialized Tools for Specific Agency Niches
These tools excel in particular niches rather than trying to serve all agency types. If your agency fits their target market, they often outperform generalist alternatives.
Raven Tools
What it is: An SEO-focused reporting platform that bundles multiple SEO data sources into unified reports.
Current pricing:
| Plan | Monthly Billing | Annual Billing | Key Limits |
|---|---|---|---|
| Small Biz | $49/month | ~$39/month | 2 domains, 2 users, 1,500 position checks |
| Start | $109/month | $79/month | 20 domains, 4 users, 15,000 position checks |
| Grow | $199/month | $139/month | 80 domains, 8 users, 20,000 position checks |
| Thrive | $299/month | $249/month | 160 domains, 20 users, 25,000 position checks |
| Lead | $479/month | $399/month | 320 domains, 40 users, 30,000 position checks |
What makes it different: Raven Tools integrates Moz and Majestic data directly, giving you access to domain authority, backlink metrics, and competitive analysis within a single platform. The 45+ integrated marketing tools make it genuinely comprehensive for SEO work.
Integration coverage: Strong SEO tool coverage (Moz, Majestic, SEMrush data), plus Google Analytics, Search Console, and major ad platforms.
Where it falls short: Email-only support on lower tiers. Traffic estimates aren’t always accurate. Less suited for agencies whose primary focus is PPC or social rather than SEO.
Best fit: SEO agencies who want built-in access to Moz and Majestic data without separate subscriptions. The value proposition is strongest if you’d otherwise be paying for these tools individually.
Klipfolio
What it is: A power-user BI tool with spreadsheet-like formula capabilities for sophisticated calculated metrics.
Current pricing:
| Product | Plan | Monthly Billing | Annual Billing |
|---|---|---|---|
| Klips (Agencies) | Agency Lite | $229/month | $190/month |
| Klips (Agencies) | Agency Pro | $504/month | $420/month |
| Klips (Agencies) | Agency Premier | $1,230/month | $1,025/month |
| PowerMetrics | Professional | $360/month | $300/month |
What makes it different: The formula editor gives you spreadsheet-level control over data transformation. If you need to create complex calculated metrics, blend data in unusual ways, or apply sophisticated logic to your reporting, Klipfolio offers capabilities that simpler tools can’t match.
Where it falls short: White-labeling requires a $199/month add-on. The learning curve is steep—this is not a “set up in an hour” tool. Several users mention the interface can feel overwhelming.
Best fit: Data-savvy agencies who need custom calculations beyond what template-based tools offer. Pairs well with teams that have some technical capability and need to build truly custom metrics.
Cyfe
What it is: An ultra-budget option for basic KPI monitoring across multiple channels.
Current pricing:
| Plan | Monthly Billing | Annual Billing | Features |
|---|---|---|---|
| Starter | $19/month | $19/month | 5 dashboards |
| Standard | $29/month | $29/month | 10 dashboards |
| Pro | $49/month | $49/month | 20 dashboards |
| Agency | $149/month | $149/month | Unlimited dashboards, white-label |
What makes it different: At $19/month, Cyfe is among the cheapest options available. If you need basic dashboard visibility into marketing metrics without advanced features, it gets the job done.
Where it falls short: Product development appears to have slowed. Reviews mention dated interface design and limited functionality compared to competitors. Best suited for internal monitoring rather than client-facing work.
Best fit: Freelancers or very small agencies on tight budgets who need basic KPI visibility and don’t require advanced reporting, automation, or white-labeling.
How These Tools Compare on Price, Features, and Fit
With so many options available, a direct comparison helps narrow your evaluation to the tools that match your specific requirements.
Pricing and Value at a Glance
| Tool | Entry Price (Annual) | Entry Price (Monthly) | Pricing Model | White-Label |
|---|---|---|---|---|
| AgencyAnalytics | $59/month | $79/month | Per client | Higher tiers |
| Whatagraph | ~$219/month | N/A (annual only) | Per source credit | Full |
| DashThis | $42/month | $49/month | Per dashboard | Professional+ |
| Swydo | $69/month | $69/month | Per data source | Full |
| ReportGarden | $89/month | $99/month | Per client | Full |
| Databox | $159/month | $199/month | Per data source | Limited |
| NinjaCat | ~$3,000/contract | ~$3,000/contract | Custom | Full |
| Looker Studio | Free + connectors | Free + connectors | Per connector | Limited |
| Raven Tools | $79/month | $109/month | Per domain | Full |
| Klipfolio | $190/month | $229/month | Per dashboard | Add-on |
| Cyfe | $19/month | $19/month | Per dashboard | Agency plan |
Feature Availability Across Platforms
| Tool | Integrations | Built-in SEO | AI Features | Data Blending | API Access |
|---|---|---|---|---|---|
| AgencyAnalytics | 80+ | Yes | Yes | No | Pro tier |
| Whatagraph | 55+ | No | Yes (all plans) | Yes | Yes |
| DashThis | 34+ | Basic | Add-on | No | No |
| Swydo | 34+ | Basic | No | No | No |
| ReportGarden | 22+ | Yes | No | Yes | Yes |
| Databox | 130+ | Basic | Growth+ | Yes | Yes |
| NinjaCat | 150+ | Yes | Yes | Yes | Yes |
| Looker Studio | 1,000+ | No | Limited | Yes | Yes |
| Raven Tools | 45+ | Strong | No | Limited | Yes |
How to Evaluate Reporting Tools the Right Way
Choosing a reporting platform requires more than comparing feature lists. You need to model real costs, test with actual data, and ask questions that reveal how the tool will work in your specific situation.
Calculate Your True Cost at 10, 25, and 50 Clients
Forget starting prices. Model your actual cost at different growth stages:
AgencyAnalytics at 30 clients (Agency plan, annual billing):
- Base: $179/month
- 20 additional clients × $20: $400/month
- Total: $579/month
DashThis at 30 dashboards (Business plan, annual billing):
- Fixed: $264/month
- Total: $264/month
Swydo at 60 data sources (30 clients × 2 sources each):
- Base (10 sources): $69/month
- 50 additional sources × $4.50: $225/month
- Total: $294/month
Whatagraph at 60 source credits:
- Need Boost plan (60 credits): ~$549/month (annual)
- Total: ~$549/month
The “cheapest” option depends entirely on your specific usage pattern.
Test With Real Client Data, Not Demo Accounts
Every platform offers a trial. Use it with actual client data:
- Connect your most problematic integrations (the ones that break elsewhere)
- Build a report for an actual client—not a test account
- Check data accuracy against source platforms
- Test automated scheduling and verify it actually sends
- Contact support with a real question and time the response
Questions to Ask Vendors That Reveal What Actually Matters
Generic feature comparisons miss the operational details that affect daily work. Ask vendors directly:
- Data reliability: “When was the last time your Facebook Ads integration had issues? How long did the outage last?”
- White-labeling depth: “Can I use my own email domain for sending reports? Is that included or an add-on?”
- Contract flexibility: “What happens if I need to downgrade in six months?”
- Data portability: “If I cancel, how do I export my historical data?”
Red Flags That Signal Future Problems
Watch for warning signs that indicate future problems:
- Hidden per-client surcharges buried in FAQ sections
- Integration connections that require frequent re-authentication during your trial
- Priority support only available on enterprise tiers
- PDF-only exports with no CSV/Excel option for data analysis
- Inability to blend data across sources for unified reporting
- Difficult data export processes that create vendor lock-in
When AgencyAnalytics Is the Right Choice vs. When to Switch
Not every frustration justifies a platform migration. Understanding when AgencyAnalytics actually fits—versus when alternatives genuinely solve problems—helps you make a rational decision rather than an emotional one.
Situations Where AgencyAnalytics Makes Sense
- You’re a small-to-medium agency managing 5-15 clients
- You need built-in SEO tools (rank tracking, site audits) without separate subscriptions
- Quick setup and gentle learning curve are priorities
- Standard SEO/PPC/social reporting without deep customization meets your needs
- Integration reliability hasn’t been a significant problem for your specific data sources
Situations Where You Should Evaluate Alternatives
- Integration stability is business-critical and you’re experiencing frequent disconnects
- You’re scaling rapidly beyond 20 clients and watching costs balloon
- Deep data customization and cross-channel blending are essential for your reporting
- Specific integrations you need are missing (Reddit Ads, AppsFlyer, certain e-commerce platforms)
- Enterprise security requirements (SSO/MFA enforcement) are mandatory for your organization
- You need to push data to warehouses or external BI tools (AgencyAnalytics’ API can’t pull third-party marketing data)
What to Expect When You Switch Reporting Platforms
Most comparison articles stop at feature lists. But if you’re actually switching platforms, the transition itself creates costs and risks that deserve consideration.
The Hidden Costs of Platform Migration
Moving reporting platforms isn’t just about monthly fees. Consider:
- Time investment: Expect 1-2 weeks to recreate templates, reconnect integrations, and train your team
- Historical data: Most platforms don’t let you export historical data in a usable format. Your comparison reporting to “same period last year” may require maintaining access to your old platform during the transition
- Client communication: You may need to explain why dashboards look different or why historical views have changed
A Step-by-Step Migration Plan That Works
- Overlap period: Run both platforms for at least one full reporting cycle
- Start with new clients: Test your new setup on fresh accounts before migrating existing clients
- Template first: Build your core templates before connecting all integrations
- Document everything: Create internal documentation for your new platform so you’re not rebuilding institutional knowledge from scratch
The Bottom Line
There’s no universally “best” reporting platform—only the right fit for your agency’s specific situation. AgencyAnalytics works well for many small agencies with straightforward needs. But if you’re hitting limitations, several alternatives offer genuine improvements in specific areas.
Start by honestly assessing your pain points. Then model your true costs at scale. Finally, test with real data before committing.
The hours you invest in choosing the right platform will pay dividends in the quality of your client reporting—and the hours you won’t spend fighting with integrations, explaining dashboard errors, or manually editing the same report across dozens of clients.
AgencyAnalytics Alternatives FAQ
Direct answers to help you find the right AgencyAnalytics replacement for your agency
The best alternative depends on your priority. Swydo for budget-friendly PPC reporting with per-data-source pricing. Whatagraph for visual reports with AI features and data blending. DashThis for simplicity with predictable dashboard-based pricing. Raven Tools for SEO agencies needing built-in Moz and Majestic data. Google Looker Studio if you want free and have technical capability to build custom dashboards.
Cyfe at $19/month for 5 dashboards is the cheapest paid option, though development has slowed. DashThis starts at $42/month (annual) for 3 dashboards with unlimited data sources. Google Looker Studio is free but requires paid connectors ($25-350/month) for non-Google data. Swydo at $69/month often costs less than AgencyAnalytics at scale because it charges per data source rather than per client.
Whatagraph offers better data blending, AI features on all plans, and data warehouse exports (BigQuery, Looker Studio) that AgencyAnalytics lacks. However, Whatagraph has no built-in SEO tools and costs more for smaller agencies. Choose Whatagraph if you prioritize visual customization and cross-channel reporting. Choose AgencyAnalytics if you need built-in rank tracking and site audits.
Swydo is better for PPC-focused agencies because its per-data-source pricing becomes cheaper as you scale, and all features are included on all plans. AgencyAnalytics is better if you need built-in SEO tools or manage clients with single data sources each. Swydo has fewer integrations (30+ vs 80+) and no AI features, but offers more predictable costs at higher volumes.
DashThis is simpler and more predictable—you pay per dashboard, not per client, with all features included. It’s better for agencies wanting fast setup and straightforward pricing. AgencyAnalytics is better if you need built-in SEO tools, more integrations (80+ vs 34+), or deeper customization. DashThis lacks data blending and has no public API.
Yes, but with trade-offs. Looker Studio is free and highly customizable, but lacks built-in white-labeling, automated report scheduling, client portals, and SEO tools. Non-Google data sources require paid connectors ($25-350/month). You’re essentially building and maintaining a reporting system rather than using a ready-made one. Best for technically capable agencies primarily using Google’s ecosystem.
Swydo. Its per-data-source pricing ($69/month base plus $4.50 per additional source) rewards agencies managing many ad accounts. The rate drops to $2-3 per source at higher volumes. All features including white-labeling are included on all plans—no feature gating. Trade-off: fewer integrations (30+) and no AI features.
Raven Tools. It integrates Moz and Majestic data directly, giving you domain authority, backlink metrics, and competitive analysis without separate subscriptions. Starting at $79/month (annual) for 20 domains. If you’d otherwise pay for Moz and Majestic separately, Raven Tools consolidates costs. AgencyAnalytics itself remains competitive here with built-in rank tracking and site audits.
Whatagraph or DashThis. Whatagraph offers strong visual reports with AI-generated summaries and covers major social platforms. DashThis provides simple, fast dashboard creation with good social media templates. Both lack the depth of dedicated social tools like Sprout Social, but work well for reporting-focused needs. Check that your specific platforms (TikTok, Pinterest, etc.) are supported.
NinjaCat or TapClicks for enterprise needs. NinjaCat offers 150+ integrations, franchise rollup reporting, and AI-powered presentations (starting ~$3,000/contract). TapClicks has 250+ integrations with advanced data transformation (typically $350-1,750+/month). Both require implementation time but handle complex multi-location and high-volume reporting that mid-market tools can’t match.
DashThis ($42/month for 3 dashboards) or Cyfe ($19/month for 5 dashboards) for simplicity and low cost. Google Looker Studio if you have technical skills and mainly use Google data sources. AgencyAnalytics’ Freelancer plan ($59/month for 5 clients) remains competitive if you need built-in SEO tools.
At 30 clients, AgencyAnalytics costs ~$579/month (Agency plan + 20 extra clients at $20 each). Alternatives at similar scale: DashThis ~$264/month (25 dashboards), Swydo ~$294/month (60 data sources), Cyfe $149/month (unlimited dashboards). Savings range from 50-75% depending on your client structure and which features you need.
Swydo charges per data source. DashThis charges per dashboard. Whatagraph charges per source credit. Cyfe’s Agency plan ($149/month) includes unlimited dashboards. These models make scaling more predictable—you won’t pay $20 extra for each new client like AgencyAnalytics charges.
Google Looker Studio is the main free option. It’s powerful and customizable but requires paid third-party connectors ($25-350/month) for non-Google data sources and lacks built-in white-labeling, client portals, and automated scheduling. Most agencies find the time investment and connector costs make “free” less free than expected.
Depends on your agency type. For PPC agencies: Swydo offers the best value with its sliding-scale data source pricing. For agencies wanting visual reports: Whatagraph includes AI features and unlimited users on all plans. For simplicity seekers: DashThis provides all features at every tier with predictable dashboard-based pricing.
Whatagraph offers strong data blending with AI assistance. Klipfolio provides spreadsheet-like formula capabilities for custom blended metrics. Databox supports data blending on higher tiers. Funnel specializes in cross-channel data modeling. AgencyAnalytics has limited blending (15 custom metric combinations max). DashThis and Swydo have minimal blending capabilities.
Whatagraph includes AI on all plans—report summaries, brand theme generation, and data Q&A chatbot. Databox has AI summaries on Growth plan and above. DashThis offers AI Insights Pro as a $15-19/month add-on. NinjaCat and TapClicks have AI-powered presentation generation at enterprise level. Swydo and Cyfe have no AI features.
Raven Tools has the strongest built-in SEO with Moz and Majestic data integration. ReportGarden includes SEO audit tools. Most other alternatives (Whatagraph, Swydo, DashThis) require connecting external SEO tools like SEMrush or Ahrefs. This is a key AgencyAnalytics strength—its built-in rank tracking, site audits, and backlink monitoring.
Whatagraph exports to BigQuery and Looker Studio. Funnel pushes to any data warehouse (BigQuery, Snowflake, Redshift). Supermetrics is built specifically for moving data to warehouses and BI tools. AgencyAnalytics cannot export to data warehouses—it’s purely a visualization tool. This matters if you need data for advanced analysis outside the reporting platform.
Swydo and Whatagraph include full white-labeling (custom domains, branded emails, logo/colors) on all plans. DashThis includes white-labeling on Professional tier and above. AgencyAnalytics gates custom domains and some branding features behind Agency Pro ($349/month). Klipfolio charges $199/month extra for white-labeling.
TapClicks leads with 250+ integrations. NinjaCat has 150+. Databox and Klipfolio each have 130+. AgencyAnalytics has 80+. Whatagraph has 55+. DashThis has 34+. Swydo has 30+. However, integration count matters less than reliability—a tool with 30 stable connections often outperforms one with 150 buggy ones. Check that your specific platforms are supported.
Plan for 1-2 weeks to recreate templates and reconnect integrations. Run both platforms for at least one full reporting cycle. Start by testing with new clients before migrating existing ones. Build core templates first, then connect all integrations. Document your new workflows so you’re not rebuilding institutional knowledge later.
AgencyAnalytics allows exporting reports as PDFs and some data as CSV, but you cannot export historical data in a format easily imported elsewhere. Your “same period last year” comparisons may require maintaining AgencyAnalytics access during transition. Consider keeping read-only access for 6-12 months while your new platform builds data history.
Yes. Most offer 14-day free trials: AgencyAnalytics, Whatagraph, Swydo, DashThis, Databox, and Raven Tools. Use trials with real client data—connect your most problematic integrations, build actual reports, test automated scheduling, and contact support with real questions. Demo accounts won’t reveal real-world issues.
Common reasons agencies switch: integration connections that frequently break, rigid report layouts with no bulk editing, essential features locked behind expensive tiers, per-client pricing that punishes growth, no data warehouse exports, and limited data blending. Identify which problems matter most to you, then choose an alternative that specifically addresses those issues.
Stay if you manage 5-15 clients, need built-in SEO tools without separate subscriptions, value fast setup and responsive support, and standard reporting meets your needs. AgencyAnalytics works well for its intended use case. Switch only if you’re experiencing specific pain points—scaling costs, customization limits, integration reliability, or missing features—that alternatives genuinely solve.
Scale your agency reporting without per-client fees eating into your margins.
Start Your Free Trial Today