
A data-driven marketing agency makes its campaign and budget calls from measured performance data instead of habit, then proves the impact to clients with numbers. Every recommendation traces back to a metric. Every report ends in a decision.
Most agencies say they work this way. Far fewer can show it when a client asks what the numbers actually mean.
Traditional agency
Data-driven agency
Reports last month’s numbers
Reports what the numbers mean and what to do next
Decisions come from experience and gut
Decisions come from tested evidence
Success measured in activity, like posts and clicks
Success measured in outcomes, like leads and revenue
Data lives in separate platform tabs
Data is unified into one view per client
Reacts when a client asks why results dropped
Spots the drop first and makes the call
One measurement method, usually last-click
Layered measurement across attribution and modeling
Why Being Data-Driven Matters Now
The reporting burden has quietly taken over the job. Research from PHD and WARC, based on a survey of more than 1,700 senior marketers, found that the time marketers spend on reporting has climbed 57% over the past decade, and that most now spend the bulk of their week on reporting rather than on the thinking clients pay them for.
That’s the trade you’re making every month. Hours go into assembling numbers instead of interpreting them.
Assembly isn’t the only tax. Before a report goes out, and again before the day starts, someone has to open each client’s dashboard, scan the numbers, and confirm nothing’s disconnected. At 5 clients that’s a slow coffee. At 50 it’s your whole morning, every morning, and the one broken feed still slips through around client 30 when your attention fades. The work doesn’t scale. It just gets heavier with every client you win.
There’s a commercial edge to fixing it, too. An agency that can tie its work to a client’s revenue gets to argue about value. An agency that can’t gets to argue about price. Only one of those conversations ends well, and it’s the reason client retention tracks so closely with reporting quality.
When was the last time one of your client reports ended with a decision instead of a chart?
How to Tell If Your Agency Is Actually Data-Driven
Run this list. If you can’t tick most of it yet, you’re in good company. Most agencies sit somewhere in the middle.
- Every client report ends with a recommendation, not just a chart
- You can pull cross-channel performance for any client in minutes
- You test changes before you roll them out, and you keep the results
- You know about a broken data connection before your client does
- You measure business outcomes, not platform vanity metrics
- You track AI search visibility alongside classic rankings
- Your first-party data collection works even when cookies don’t
- Your team spends more time reading data than assembling it
How a Data-Driven Agency Works
Five layers turn raw signals into decisions. We call it the Decision Stack. Skip a layer and everything above it wobbles.
The Decision Stack
5
Measurement that survives signal loss
Attribution, incrementality, and aggregate modeling together
4
Testing you actually log
Change things on purpose, then record what happened
3
Insight, not counts
Every number followed by the decision it drives
2
A reporting stack with three jobs
Reports for clients, boards for your team, alerts for surprises
1
A clean data foundation
Correct tracking, consistent naming, connections that hold
Raw signals at the bottom. Decisions at the top.
1. A Clean Data Foundation
Everything rests on data you can trust. Correct tracking. Consistent naming. Connections that don’t quietly break.
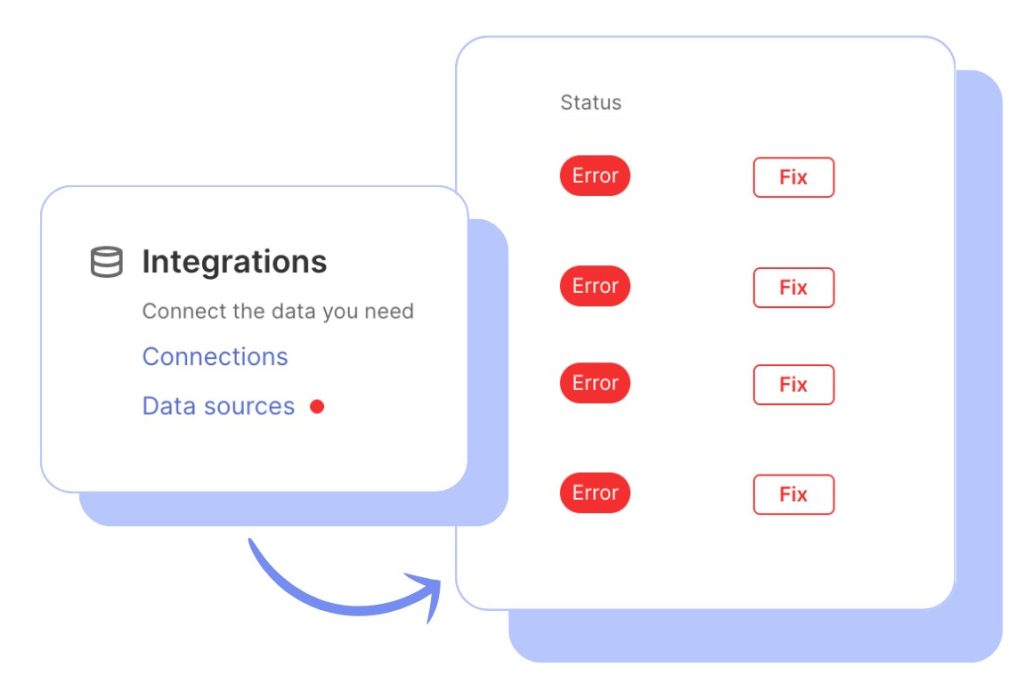
Call it the Connection-Health-First principle: a report built on a dead connection is worse than no report at all, because it looks fine while it lies to your client. Swydo’s Data Health Check Alerts watch your connections daily and flag an expired token by email and a red dot in-app, so you find out on the 2nd instead of on the 30th.
Universal Analytics stopped collecting data on July 1, 2023. If any part of your reporting still leans on old exports, that’s your first repair job.
2. A Reporting Stack With Three Jobs
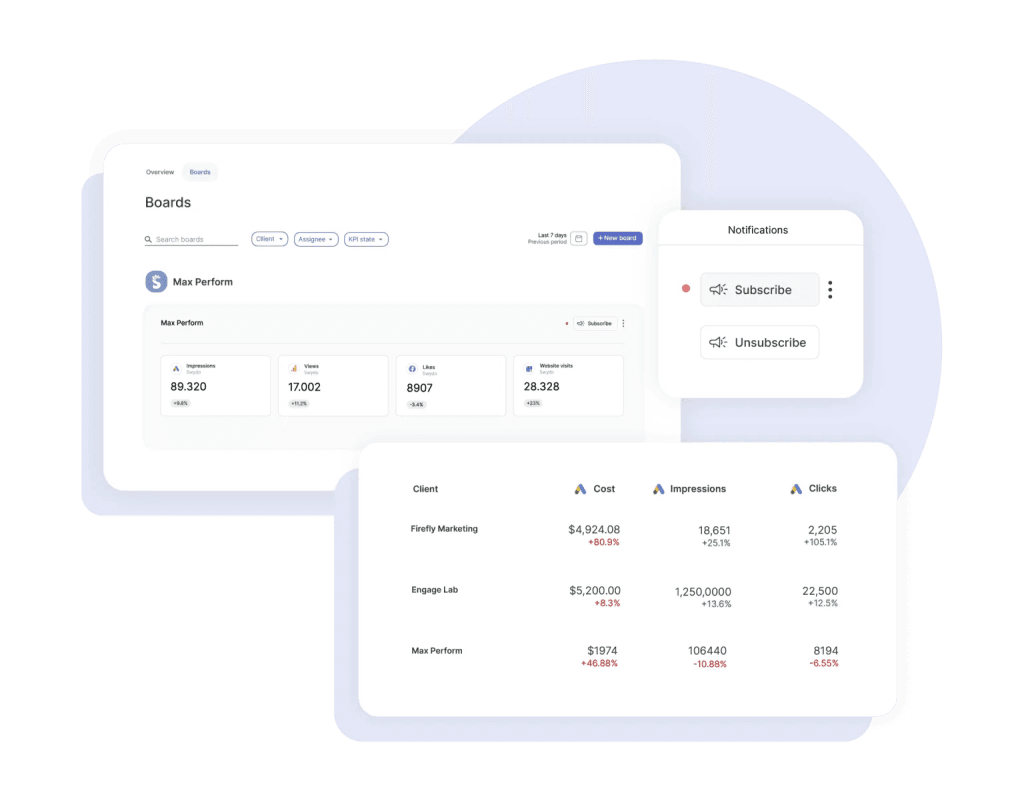
Your reporting layer does three separate things, so build it in three parts. Reports go to clients on a schedule. Boards give your own team a live view. Alerts catch what nobody scheduled.
That’s the Three-Layer Reporting Stack. Most agencies build only the first layer, then wonder why they’re always reacting. If you want the deeper version of this, our guide to marketing reporting walks through each layer.
The stack only pays off if you can see every client at once. That’s the part scattered dashboards can’t do, and it’s why the morning sweep exists in the first place. Swydo’s Metrics Overview replaces it with one screen that lines up the metrics you care about across every client, side by side, so you read the whole roster in a glance instead of opening 30 tabs.
Goals sit underneath, showing you which clients are On Track, Off Track, or Achieved on their pacing, so “is everyone fine?” is answered before you click anything. And because your connections are already monitored, a broken feed has flagged itself before you go looking. The sweep drops from an hour to a glance, and it stays a glance whether you run 5 clients or 50.
3. Insight, Not Counts
A count isn’t an insight. “Clicks up 12%” is a count.
“Clicks up 12% because the new ad group is outperforming, so we’re moving budget into it” is an insight. The whole difference between data-aware and data-driven lives in the sentence after the number. Most of what separates a good report from a forgettable one comes down to client reporting best practices at exactly this point.
4. Testing You Actually Log
Data-driven agencies change things on purpose, then measure what happened. Pick one testing tool and stay with it. VWO, Optimizely, AB Tasty, and Convert all work, and GA4 handles lighter experiments natively. For paid social, use Meta’s Experiments tool in Ads Manager.
Then write down what you tested and what it did. An untested opinion is still an opinion, no matter how confidently you present it.
5. Measurement That Survives Signal Loss
Last-click attribution isn’t defensible on its own anymore. It flatters the channels that sit closest to the sale and starves the ones that create demand. Layer it with incrementality testing and aggregate modeling, and read up on which Google Ads attribution model fits the account before you accept the platform default.
Tools by Job
| Job | Tools |
|---|---|
| Data foundation | GA4, Google Search Console, server-side tagging, a consent platform |
| Reporting and visualization | Swydo, Looker Studio |
| Testing | VWO, Optimizely, AB Tasty, Convert, GA4 experiments, Meta Experiments |
| Measurement | Google Meridian, Meta Robyn, incrementality tests |
What Your Reports Need to Cover Now
The measurement ground moved. Your client reports have to reflect the ground they’re actually standing on.
AI Writes the First Draft, You Sign It
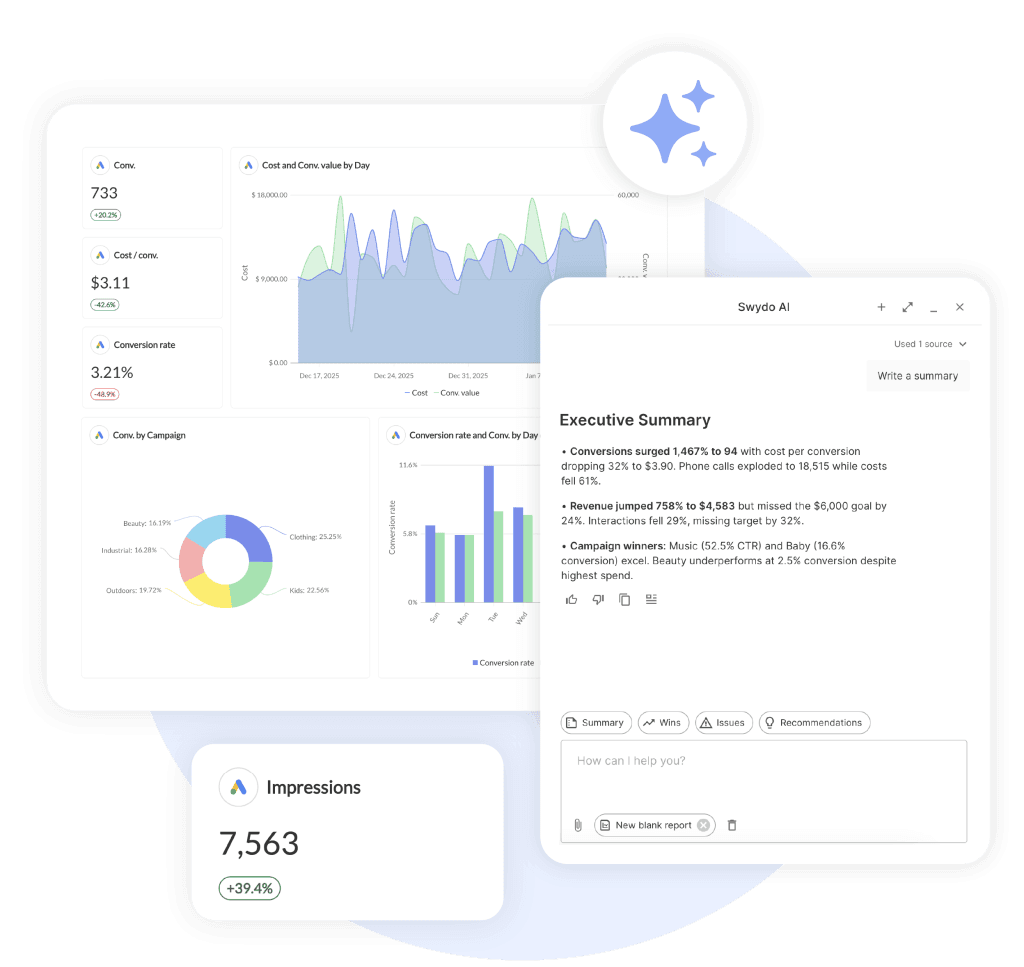
AI turns a pile of metrics into plain language in seconds. Used well, that hands your team back the hours they were spending on assembly. Used badly, it invents numbers and you send them to a client.
So the rule is simple. AI drafts, a human signs.
Swydo AI does this inside the report itself, and it writes in Dutch, French, German, Spanish, and more. Your plan includes 4,000 credits a month, an average summary runs about 95 credits, so that’s roughly 40 summaries. Credits don’t roll over, which sounds stingy until you treat them as a monthly allowance rather than a savings account. You can set a spend cap if you want a hard ceiling.
AI Search Visibility Is Now a Report Line
Search changed shape. AI Overviews sit above the blue links on a growing share of queries, and where they appear, clicks to the classic results fall. Meanwhile a new and much smaller stream of visitors arrives from ChatGPT, Perplexity, and Gemini. Fewer of them, but they show up with far more intent.
Your clients want to know whether they show up in AI answers. Right now most agencies can’t tell them.
Our Semrush integration surfaces AI Overview ranking fields directly in client reports, so AI search visibility sits next to organic position instead of living in a separate tab. As far as we know, we were the first reporting platform to expose those metrics. On the traffic side, you can also track AI traffic in GA4 and report the two together.
Signal Loss Didn’t Go Away
The cookie story didn’t end the way the industry rehearsed. Google decided not to phase out third-party cookies in Chrome, and later dropped the planned choice prompt as well.
Don’t read that as a reprieve. Safari and Firefox still block third-party cookies by default, which takes a meaningful slice of your traffic off the board no matter what Chrome does. Chrome users decline consent too. First-party data collection is the durable answer, and it was always going to be.
One hard requirement if you or your clients advertise to people in the EEA or the UK: Google Consent Mode v2 has been mandatory since March 2024. Skip it and you lose remarketing audiences and a chunk of your conversion measurement.
Aggregate Measurement Came Back
Weaker signals brought back methods that never needed cookies in the first place. Marketing mix modeling works on aggregated data. Meta open-sourced Robyn, Google released Meridian, and both are free to start with.
I’ll be honest about the catch. Neither is plug-and-play. Both want clean multi-year data and somebody who can read the output without over-claiming. For a small agency that’s a real cost, so put MMM on the roadmap rather than in this quarter’s plan.
Where Agencies Get Stuck
You report activity instead of outcomes. The deck shows 40,000 impressions and a 3% engagement rate. The client asks whether any of it produced customers, and the room goes quiet. Start every report from the client’s business goal and work backward to the marketing KPIs clients care about.
Your dashboard has a broken feed. A GA4 connection expires on the 2nd. Nobody notices. The monthly report shows a 90% traffic collapse that never happened, and now you’re explaining your own tooling instead of their results.
You measure once, one way. Last-click ROAS is the only number in the report, so the awareness campaign that actually drove lift looks like dead weight and gets cut.
You collect data you never read. Twelve connected platforms feels productive. If nobody opens the outputs, it’s just noise with a login.
How to Make the Leap
Take these in order. Don’t try all five at once.
Stage 1
Aware
You report the data. Clients see charts and ask what they mean.
→
Stage 2
Aspiring
You unify and automate. The assembly work shrinks, the thinking time grows.
→
Stage 3
Data-driven
You test, measure, and advise. Every report ends in a decision.
- Fix the foundation. Confirm GA4 tracks what you think it tracks, standardize your naming, and turn on connection alerts.
- Unify the reporting. Pull every client’s channels into one view. Our Combined Data Sources widget blends up to five ad platforms into a single cross-channel number, which is the step that kills most of the manual assembly. Report automation for marketing agencies covers the rest of that build.
- Turn counts into insight. Rewrite one client report so every metric is followed by a “so what.” Use it as the template for the others.
- Add testing discipline. One experiment per client per month. Log it.
- Add measurement that holds up. Put AI search visibility in the report first, since it’s cheap and your clients are already asking. Explore incrementality and MMM as accounts grow.
Two honest limits before you plan around us. We don’t have a permanent free tier, though the trial doesn’t ask for a credit card and includes 10 data sources, which covers your first few clients. And we don’t expose a public REST API yet, so genuinely custom data flows go through Google Sheets with Zapier or Make. That handles almost everything agencies actually ask for, without an engineer.
Data-Driven Marketing Agency FAQ
Straight answers on becoming a data-driven agency, from the fundamentals to AI search and reporting at scale
A data-driven marketing agency makes its campaign and budget decisions from measured performance data instead of habit or opinion, and proves the impact of its work to clients with numbers. Every recommendation traces back to a metric, and every report ends in a decision.
The label is common, but the practice is rare. The real test is what happens after the chart. A traditional agency reports what the numbers were. A data-driven one reports what they mean and what to do next.
It collects performance data across every channel into one place, turns that data into decisions rather than raw counts, tests changes before rolling them out, and reports outcomes to clients with a clear recommendation attached. It runs on evidence at every step.
The day-to-day looks like this. Pull the numbers, spot what’s working, shift budget or creative toward it, confirm the change with a test, and tell the client the result in terms of their business rather than platform metrics.
An agency notices in its dashboard that one ad group produces leads at half the cost of the rest. It moves budget there, runs an experiment to confirm the lift is real, then reports the drop in cost per lead with a recommendation to scale. That full loop is data-driven marketing.
The shape matters more than the specifics. A number surfaces, a decision follows, a test confirms it, and the client hears the outcome in their own terms. Repeat that across accounts and you have a data-driven practice.
Traditional marketing leans on experience and gut, measures success by activity like posts and clicks, and reacts when a client asks why results dropped. Data-driven marketing leans on tested evidence, measures success by outcomes like leads and revenue, and spots the drop first.
The gap shows up most in the client meeting. Traditional agencies explain what happened. Data-driven agencies explain what to do about it, which is the difference between competing on price and competing on value.
Data-driven marketing lets the data lead the decision. Data-informed marketing treats data as one input among several, alongside experience, brand judgment, and context. Data-driven is stricter, and data-informed leaves more room for human interpretation.
Neither is automatically better. Pure data-driven decisions can miss what the numbers don’t capture, like brand strength and long-term demand. The strongest agencies stay data-driven on tactics they can test and data-informed on the bets they can’t.
The main benefits are better decisions, provable results for clients, and fewer hours lost to manual reporting. The commercial payoff is the biggest one. When you can tie your work to a client’s revenue, you compete on outcomes instead of price, which is what keeps clients.
There is good evidence it pays off. Personalization and measurement done well can cut acquisition costs and lift revenue, and agencies that prove ROI hold onto clients longer. An agency that can’t connect its work to results is stuck arguing about cost.
The manual way is a daily sweep. Before a report goes out, and again at the start of the day, someone opens each client’s dashboard, scans the numbers, and checks nothing is disconnected. The scalable way is one view that shows every client’s key metrics at once.
The manual approach doesn’t scale, it just gets heavier with every client won. At 5 clients it’s a slow coffee. At 50 it’s the whole morning, and a broken feed still slips through. A cross-client summary screen, like Swydo’s Metrics Overview, turns that sweep into a glance.
Use a single screen that lines up the metrics you care about across every client, side by side, so you read the whole roster at a glance. Pair it with goal pacing that flags which clients are on or off track, and the question ‘is everyone fine?’ is answered before you click anything.
This is where a monitoring layer earns its place. In Swydo, Metrics Overview gives the cross-client view and Goals show On Track, Off Track, or Achieved status, so you read the exceptions instead of scanning every account one by one.
Monitor connection health automatically instead of eyeballing it. A single expired token can make a report show a traffic collapse that never happened, so you want a system that flags the break by email and in-app the moment it occurs, not when the client asks.
A report built on a dead connection is worse than no report, because it looks fine while it lies. Swydo’s Data Health Check Alerts watch connections daily and flag an expired token with an email and a red dot, so you fix it on the 2nd instead of explaining it on the 30th.
Most marketers spend more than half their working time on reporting, and that share has climbed by more than half over the past decade, according to research from PHD and WARC. Much of it goes into assembling numbers rather than interpreting them.
That is the hidden cost of manual reporting. Every hour spent pulling and formatting data is an hour not spent on the strategy clients actually pay for, which is why automating the assembly is usually the single highest-return fix an agency can make.
AI should write the first draft, and a human should approve it. Used well, AI turns a pile of metrics into plain language in seconds and hands your team back hours of assembly time. Used carelessly, it invents numbers, so the rule is simple. AI drafts, you review, you sign.
The interpretation is the part clients pay for, so that is where human time should go. Let AI handle the summary and the first pass at wins and issues, then edit for judgment, context, and anything the model got wrong.
Show up in AI answers by earning citations from the sources those engines trust, like well-structured pages that directly answer real questions, plus third-party mentions in reviews, roundups, and forums. This practice is called answer engine optimization, or AEO.
Track it, don’t guess at it. Tools that surface AI Overview visibility, like Swydo’s Semrush integration, let you report whether a client appears in AI answers next to their classic rankings. Clients increasingly ask whether they show up in ChatGPT and Google’s AI results, and most agencies can’t yet tell them.
Third-party cookies matter less every year, even though Google chose to keep them in Chrome. Safari and Firefox block them by default, and many users decline consent, so a large share of traffic is already untrackable that way. First-party data is the durable answer.
Collect data you own instead. That means server-side tagging, consented on-site tracking, and tools like Enhanced Conversions and the Conversions API to pass first-party signals back to ad platforms. Build the habit early, because the direction of travel is clear regardless of what any single browser does.
Last-click attribution is not reliable on its own. It credits whatever channel sits closest to the sale and ignores the ones that created demand, so awareness work can look like dead weight and get cut by mistake. Use it as one signal, not the whole picture.
Layer your measurement instead. Pair attribution with incrementality tests and marketing mix modeling, which works on aggregated data and needs no cookies. Meta’s Robyn and Google’s Meridian are free places to start, though both want clean history and someone who can read the output.
Start with clean tracking, unify every client’s channels into one view, then rewrite your reports so each number is followed by a decision. Add a monthly testing habit, and layer in modern measurement like AI search visibility. Take the steps in that order rather than all at once.
Each layer rests on the one below it. A shaky data foundation makes everything above it wobble, so fixing tracking and connections first saves you from building insight on top of numbers you can’t trust.
The first step is fixing your data foundation. Confirm your analytics tracks what you think it tracks, standardize your campaign naming, and turn on alerts for broken connections. Everything else depends on data you can trust.
It is the least glamorous step and the most important. Clean tracking and consistent naming are what make every report above them accurate, and they prevent the silent errors that erode client confidence.
The metrics that matter are the ones tied to the client’s business, like leads, pipeline, revenue, cost per acquisition, and return on ad spend, not vanity metrics like impressions and raw follower counts. Start from the client’s goal and work backward to the numbers that prove it.
A useful filter is to ask whether a metric would change a decision. Impressions rarely do. Cost per lead by channel almost always does. Report fewer numbers that map to action, and your reports get shorter and more valuable at the same time.
A data-driven team needs analytics fluency to read the numbers, testing discipline to change things on purpose, and the communication skill to turn data into a decision a client understands. The rarest and most valuable skill is interpretation, not data collection.
Tools don’t make an agency data-driven, habits do. You need people who question the numbers, a culture that treats a failed test as information, and someone who owns measurement so it doesn’t fall through the cracks between accounts.
A typical stack covers four jobs. Analytics for the data foundation, a reporting platform to unify and present it, testing tools to run experiments, and measurement tools to see past signal loss. Fewer tools used well beats a long list.
| Job | Common tools |
|---|---|
| Data foundation | GA4, Google Search Console, server-side tagging |
| Reporting and visualization | Swydo, Looker Studio |
| Testing | Optimizely, VWO, AB Tasty, Convert |
| Measurement | Google Meridian, Meta Robyn, incrementality tests |
The reporting layer is where multi-client agencies feel the difference most, because it either automates the assembly or leaves it manual. To test that on your own accounts, Swydo’s trial runs without a credit card and includes ten data sources.
Next Steps
Becoming data-driven has less to do with buying more tools than with closing the gap between the data you already have and the decisions you actually make.
Fix your foundation. Unify your reporting. Put AI search visibility into the standard client deliverable before your competitors think to.
Do that, and reporting stops eating your week and starts winning your next client. If you want to see it on your own numbers, the 14-day trial doesn’t ask for a card, and 10 data sources are included from the first day.
Turn your agency’s data into client wins with clear, actionable insights.
Get Started with Swydo Free