
Data blending in Looker Studio pulls separate metrics into one clear snapshot. Agencies juggle stuff like Google Analytics 4 (GA4), Google Search Console (GSC), ad tools, and client CRMs to show ROI or fix campaign hiccups. Tie these together—say, GA4’s user stats with GSC’s search numbers—and you ditch the hassle of manual data patching.
This guide walks through blending data in Looker Studio, spotlighting GA4 and GSC as a hands-on case, while tossing in tips for agencies to tweak it for any client or tool, sorting out messes like jumbled data, rushed deadlines, and client demands for solid reports.
What Makes Data Blending in Looker Studio Worth It for Agencies
Picture juggling a dozen clients, each with their own setups and goals. Link GA4’s bounce rates to GSC’s click counts, or match ad spend with conversions, and you cut through the chaos of flipping between tools. Nail down answers fast: “Does SEO bring in decent traffic?” or “Which campaigns actually pay off?” Blending data in Looker Studio hands agencies a single spot for insights that shape choices on the fly.
Got worries about slow Looker Studio reports with tons of client data? Lean on early filters and tight blends to keep things snappy, so you’re not stuck waiting during a client huddle.
1. Get Your Data Sources Ready for Blending in Looker Studio
First, verify that you have GA4 and GSC accounts associated with the Google account you are logging into Looker Studio with.
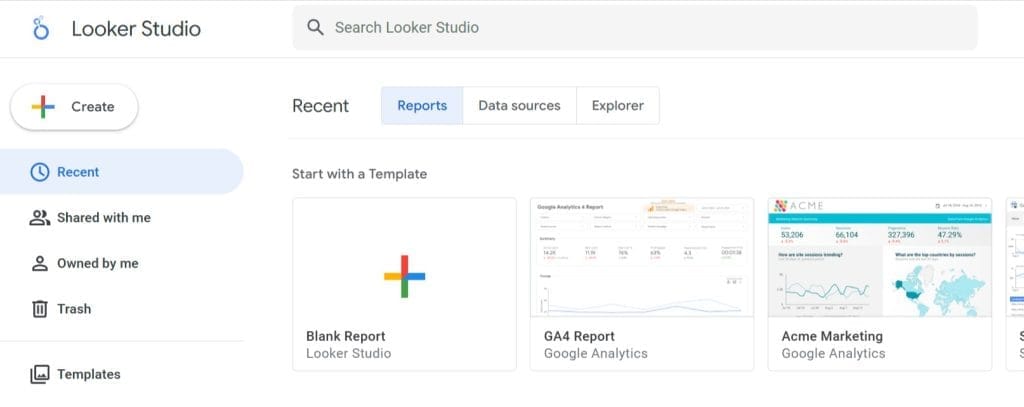
Then click on blank report—open Looker Studio
Set up your sources, start with Google Analytics:
Hook Up GA4
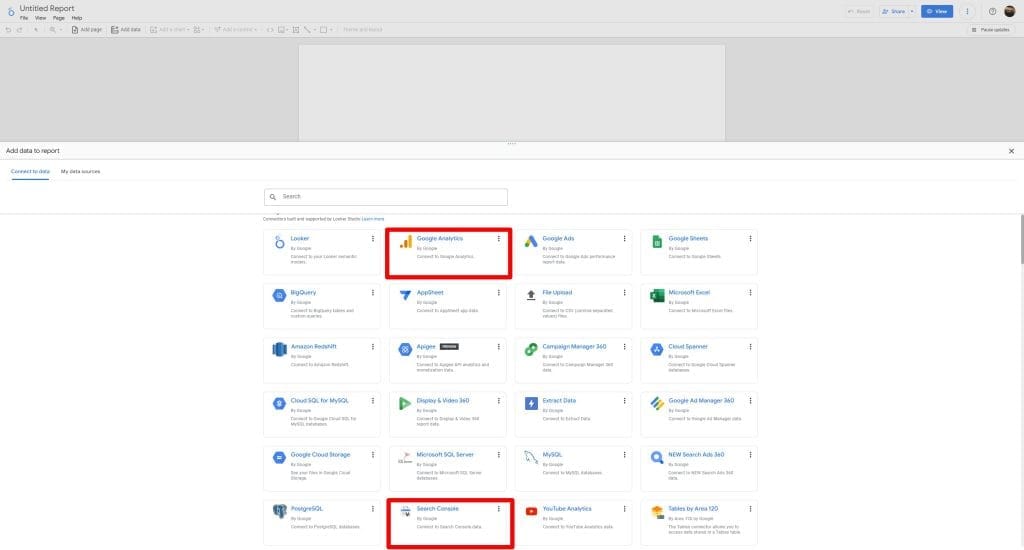
- Click “Google Analytics” in the connector list (It should be the first row)
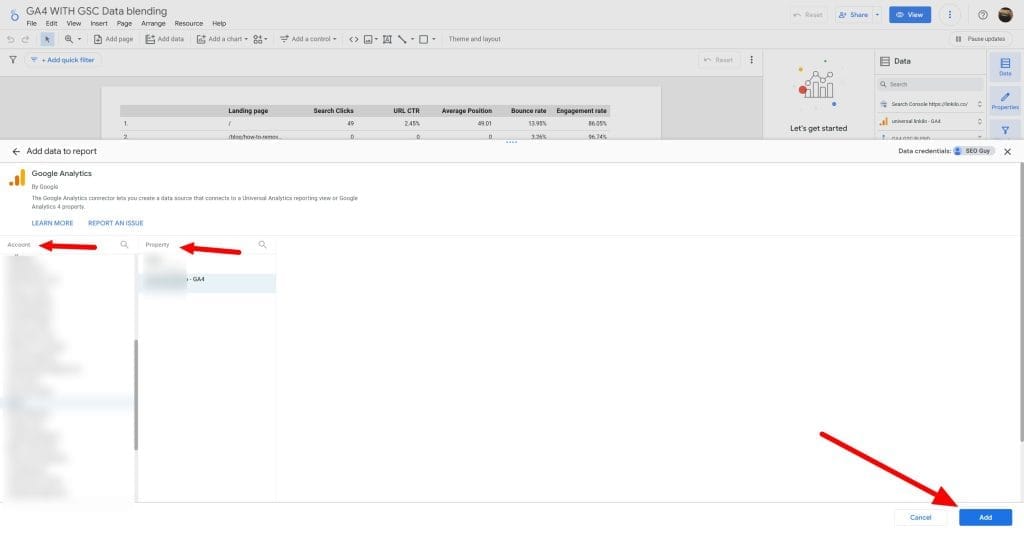
- Click it, then pick your client’s GA4 property from the dropdown.
- Hit “Add” in the bottom right.
Click on Add Data and select Google Search Console
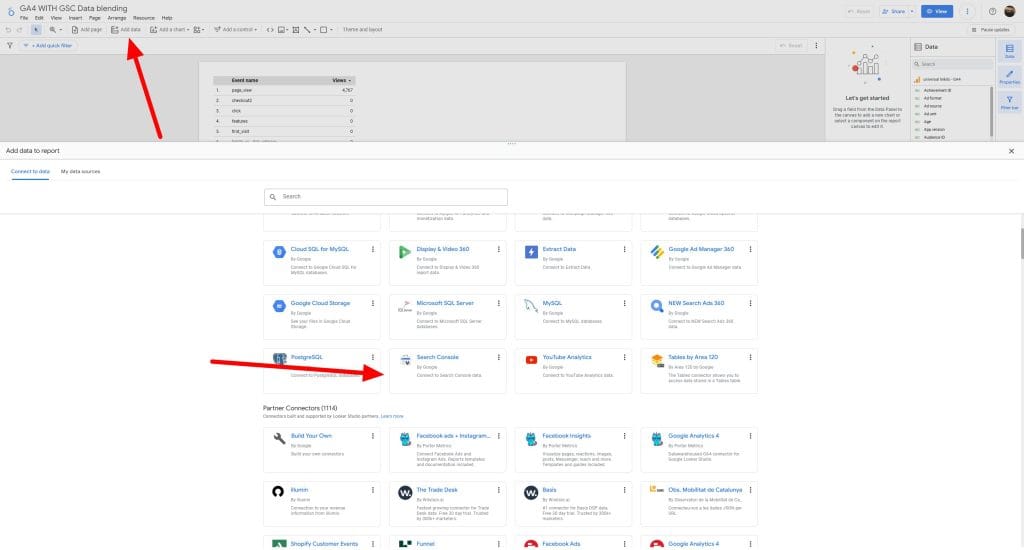
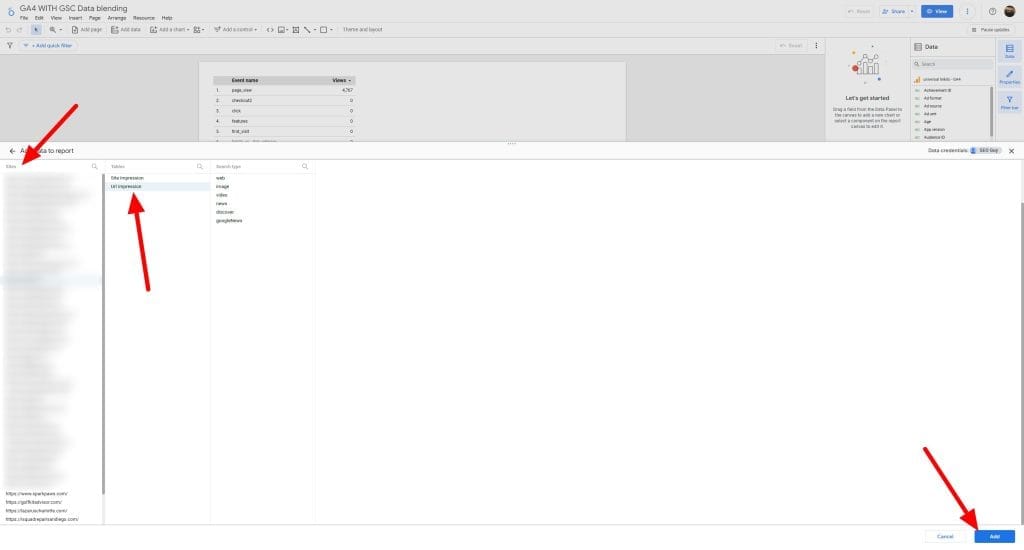
Select the managed GSC account/site, select Url Impression and click “Add“
2. Pull Off Data Blending in Looker Studio Step by Step
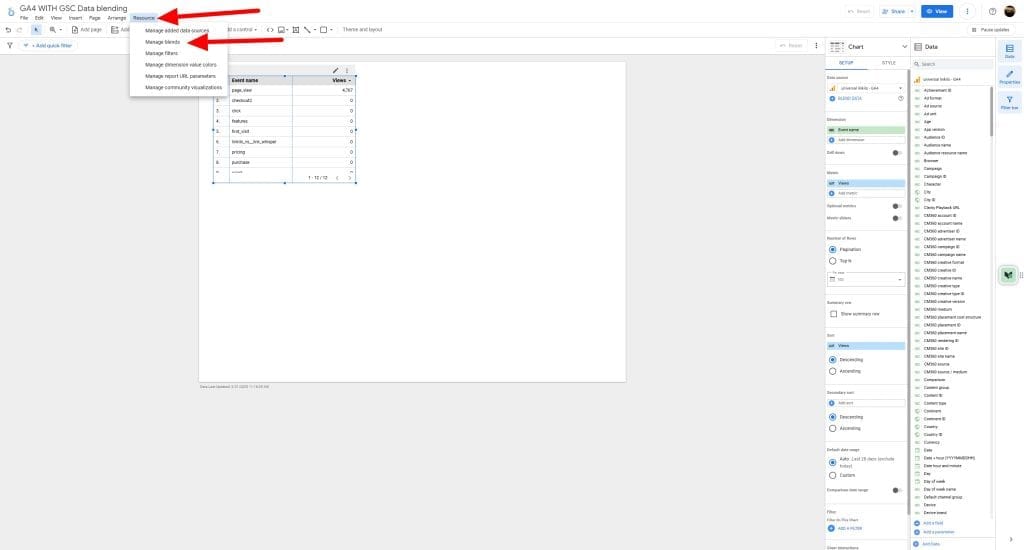
Start blending these by clicking on Resource>>Manage Blends
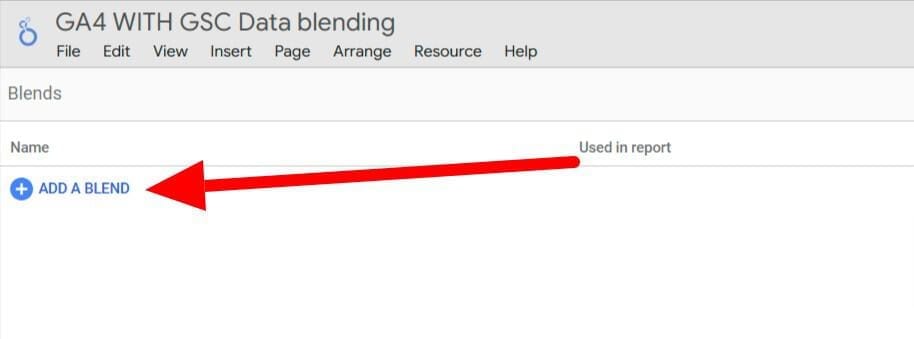
Click “ADD A BLEND“
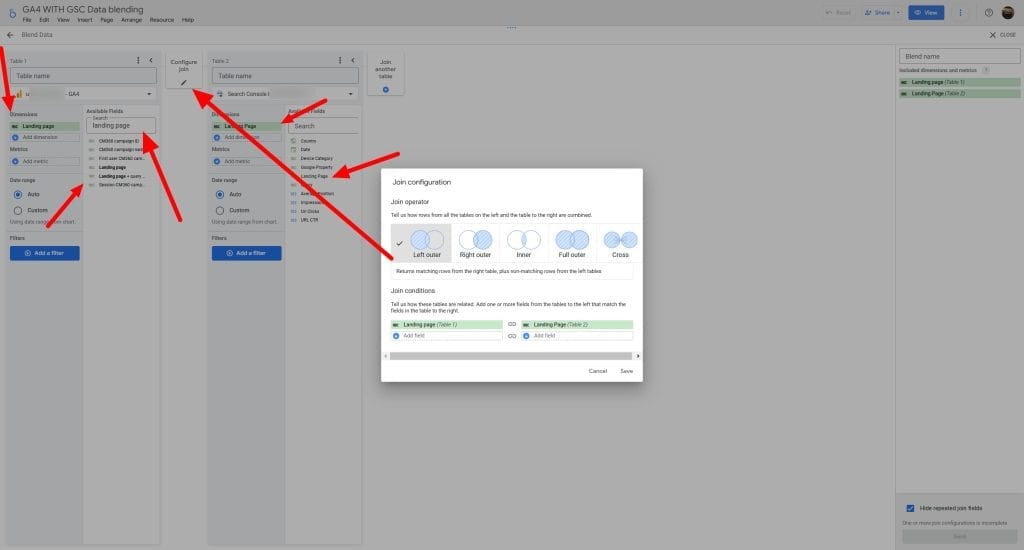
Configure the Blend:
- Data Source 1: Choose your GA4 data source.
- Join Key 1: This is how you’ll connect GA4 data. The best option is usually
Landing Page. (Make sure your GA4 reports are set up to capture landing page information correctly.)
- Join Key 1: This is how you’ll connect GA4 data. The best option is usually
- Data Source 2: Choose your GSC data source.
- Join Key 2: This needs to match the GA4 join key. Use
Landing Pagehere as well. Important Note: GSC’sLanding Pagedimension might include query parameters. If you want to blend based on the base URL, you might need to create a calculated field in GSC to extract the base URL - Join Type:
Left outer joinis generally recommended. This will include all landing pages from GA4 and match them with GSC data. If a landing page exists in GA4 but not GSC, the GSC metrics will show as null/zero. Other join types might exclude data you want to see.
- Join Key 2: This needs to match the GA4 join key. Use
When choosing a dimension, prefer GA4. Google Search Console (GSC) only shows indexed URLs, whereas GA4 collects all URLs, even those with UTM parameters or null/zero values. It’s better to capture everything, not just the URLs that are ranking
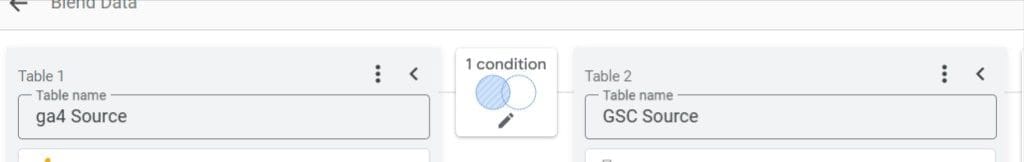
Name them—click each source’s title in the left panel, type “GA4 Source” and “GSC Source” to track them easy.
This setup works for GA4 and GSC, but it bends to anything. Hook Google Ads to GA4 with Campaign ID, or tie a CRM to User ID. Expect mismatched keys? Sort that out next. Want more than two sources? Stack another—click “Add a table,” pick Google Ads, set a join—but don’t overdo it, or things slow down. Test a pair first, check the results, then pile on.
3. Fix Join Key Problems for Smooth Data Blending in Looker Studio
First, we are going to add Landing Page dimensions for both GA4 and GSC sources. Then add all of the metrics you want to see on the table.
Google Analytics 4 landing page URLs do not include the domain (https://example.com/path), and Google Search Console does, so simply joining these two won’t work. We’ll need to use Regex to make them match.
We will clean up the GSC by removing the domain and only using the landing page path.
GSC Join Key Cleanup
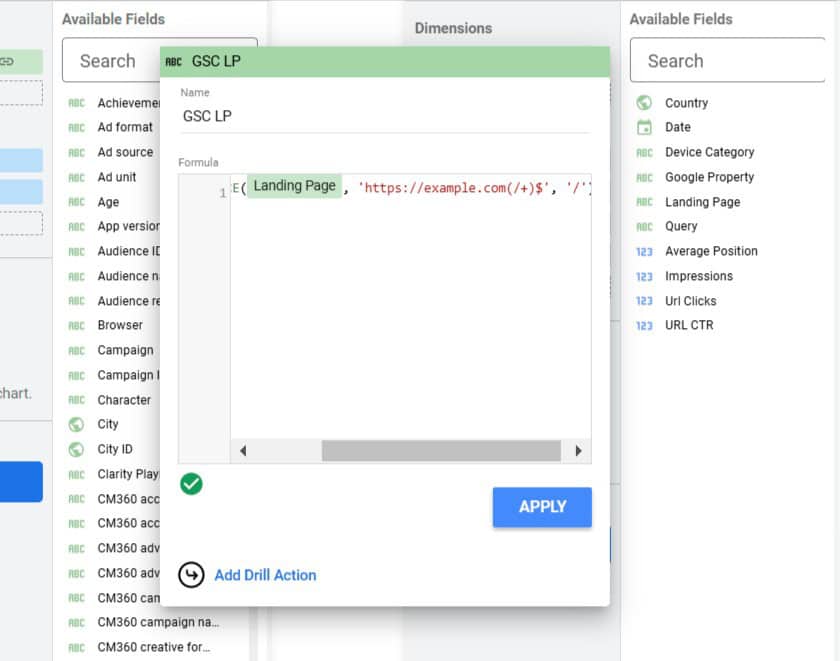
- Click “GSC Source” Landing Page
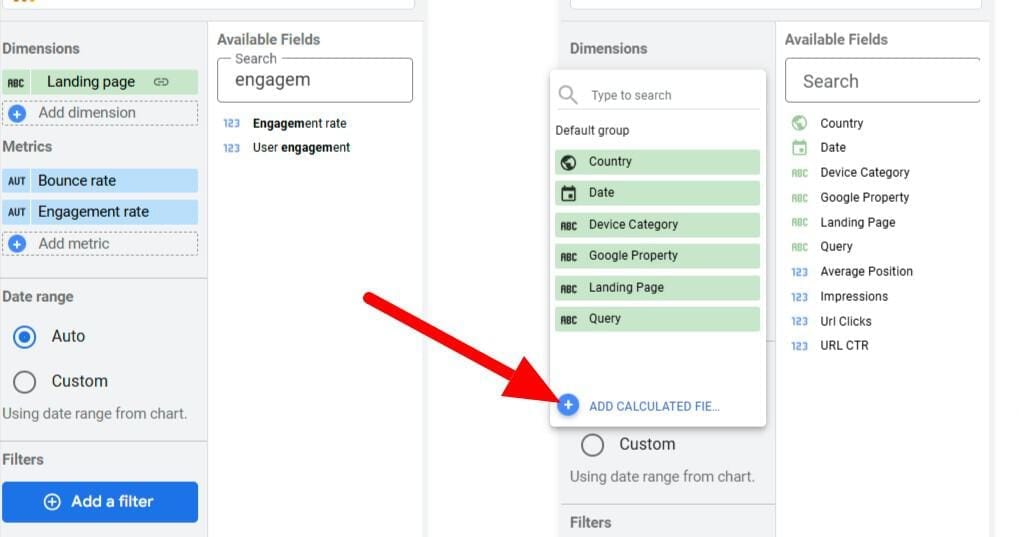
- Hit “Add Calculated Field” at the top.
- Name it—type
GSC LPin the top box. - Enter this formula:
REGEXP_REPLACE(Landing Page, 'https://example.com(/+)$', '/') - Click “Save.”
For those who don’t have trailing slash use this: REGEXP_REPLACE(Landing Page, 'https://example.com(/+)$', '')
After that, you ca click on 1 condition, and you will notice that the right side is “Missing”:
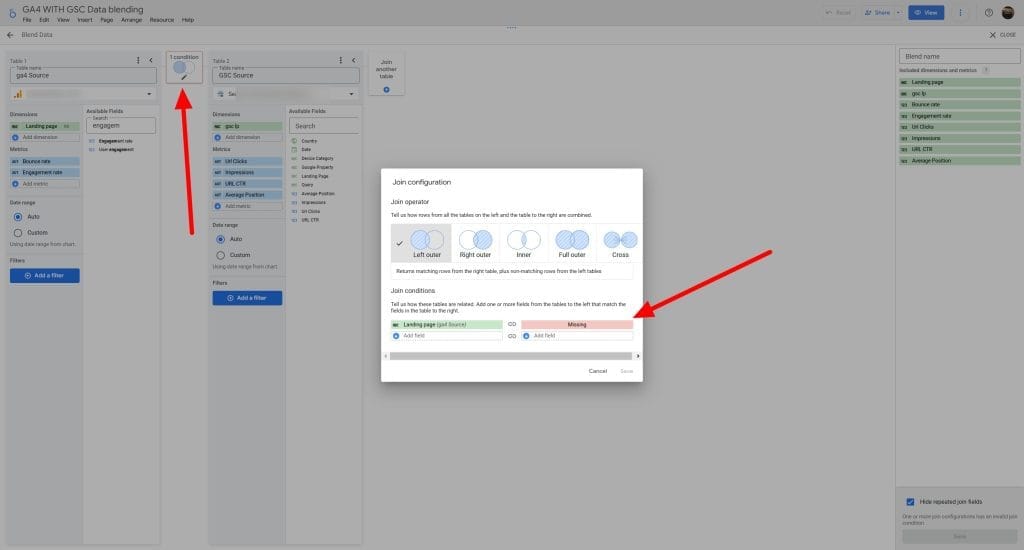
Since the Dimensions name has changed, you will need to click on the “Missing” section and select GSC LP:
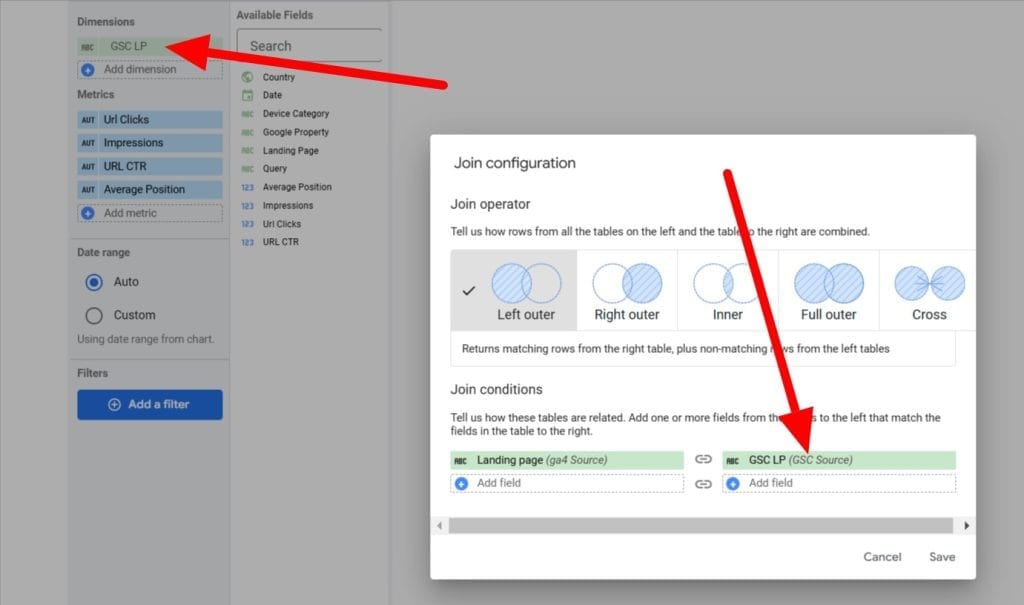
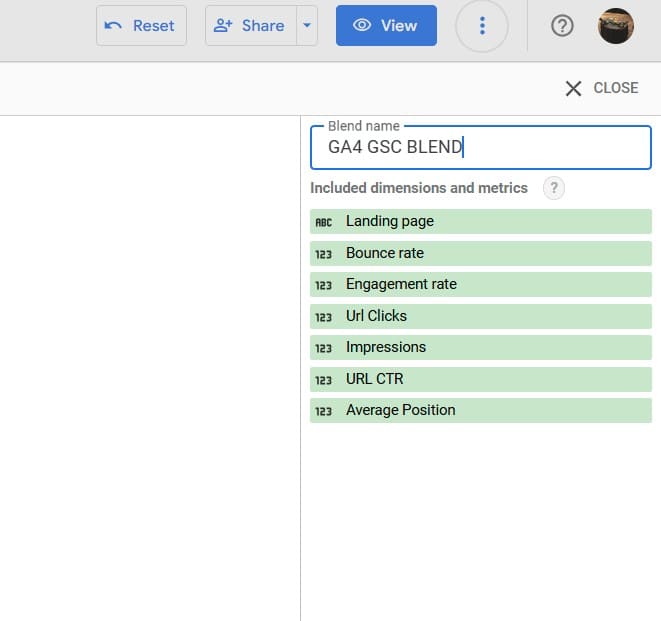
Name your Blend Name and click Save (located at the bottom right) then click X Close
Check it—fixes slashes, adds the domain if missing, syncs with GSC.
4. Pick Metrics and Dimensions for Your Blended Data
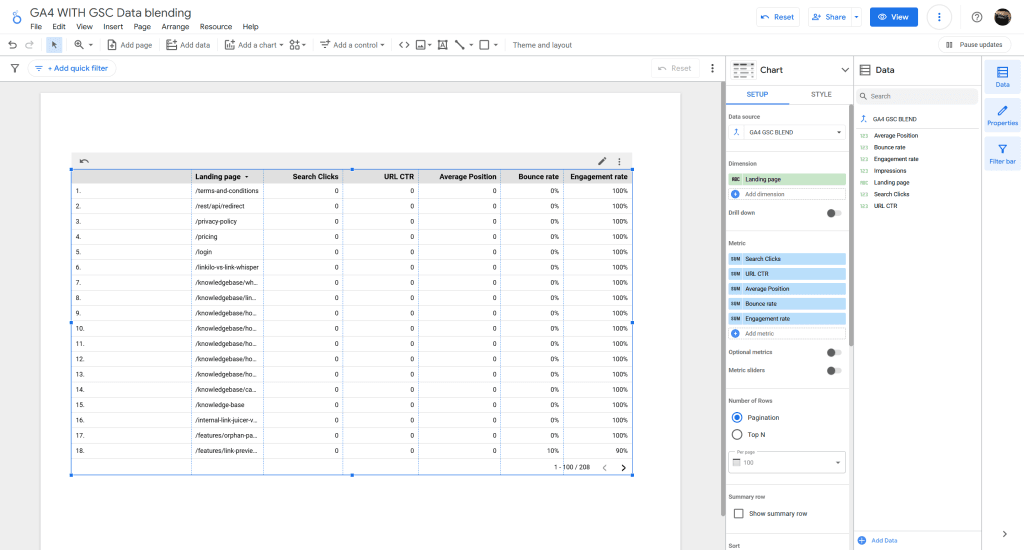
Click on the table and select the data source to GA4 GSC BLEND
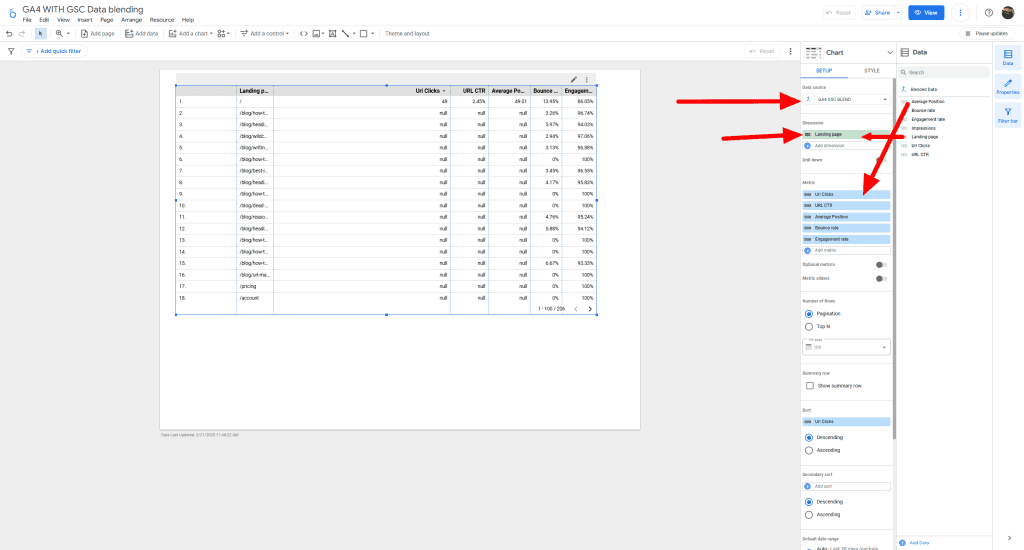
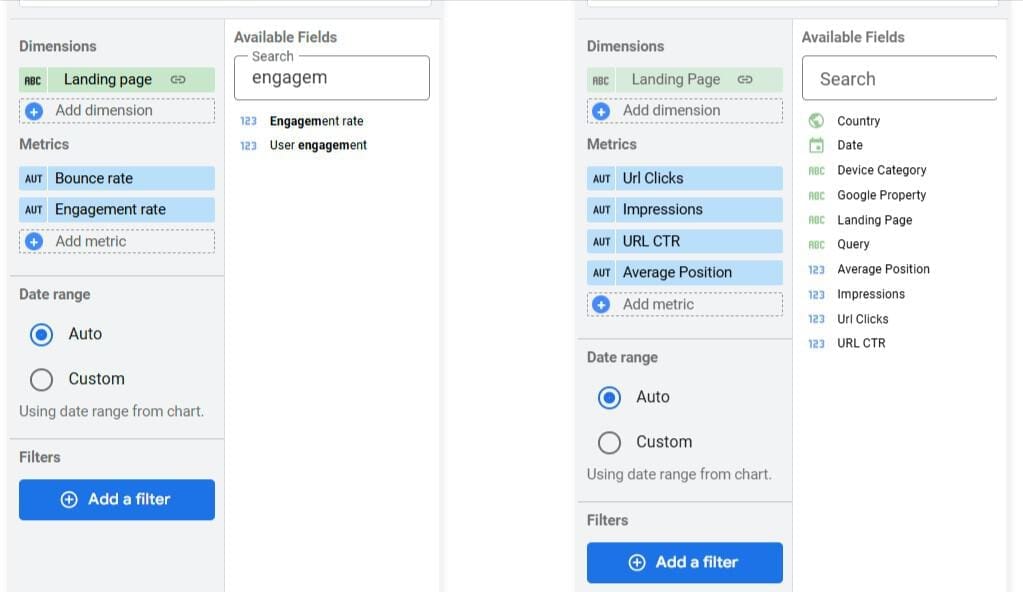
Scroll to “Metrics” under each source table.
- Pick GA4 metrics—click “Add a metric,” scroll to
Engagement Rate, click it, then addBounce Rate. - Pick GSC metrics—click “Add a metric,” scroll to
Clicks, click it, then addAverage Position. - Hit “Save.”
Stick with GA4 and GSC for now—Engagement Rateand Bounce Rate from GA4, Clicks, Impression, CTR, and Average Position from GSC. Switch it up for agency jobs—pair Google Ads Cost with GA4 Conversions, or CRM Revenue with Sessions.
Not sure what to grab? Zero in on what clients care about—traffic worth having, cash coming in, or how folks stick around. Pin dimensions like Landing Page or Campaign as the backbone, and keep metrics to 4-6 so it doesn’t turn into a jumble.
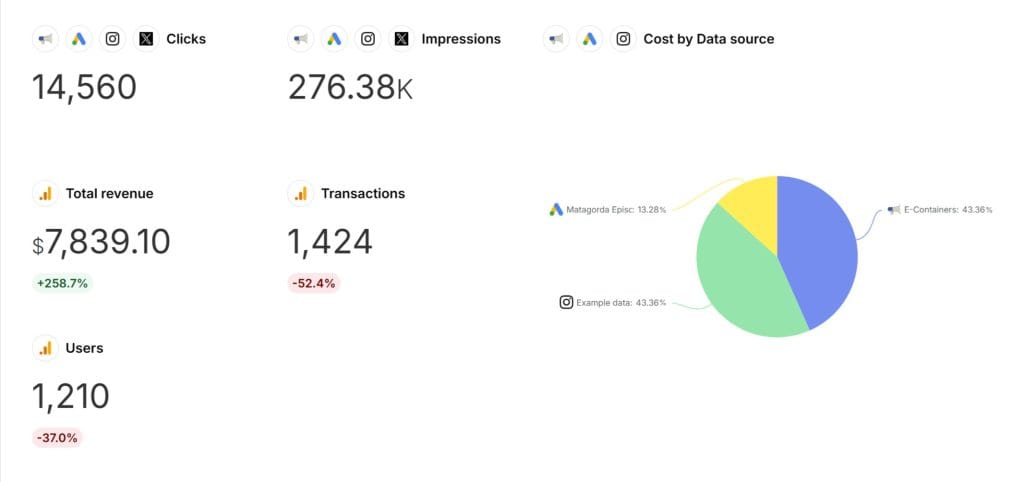
5. Show Off Blended Data in Looker Studio with Tables and Charts
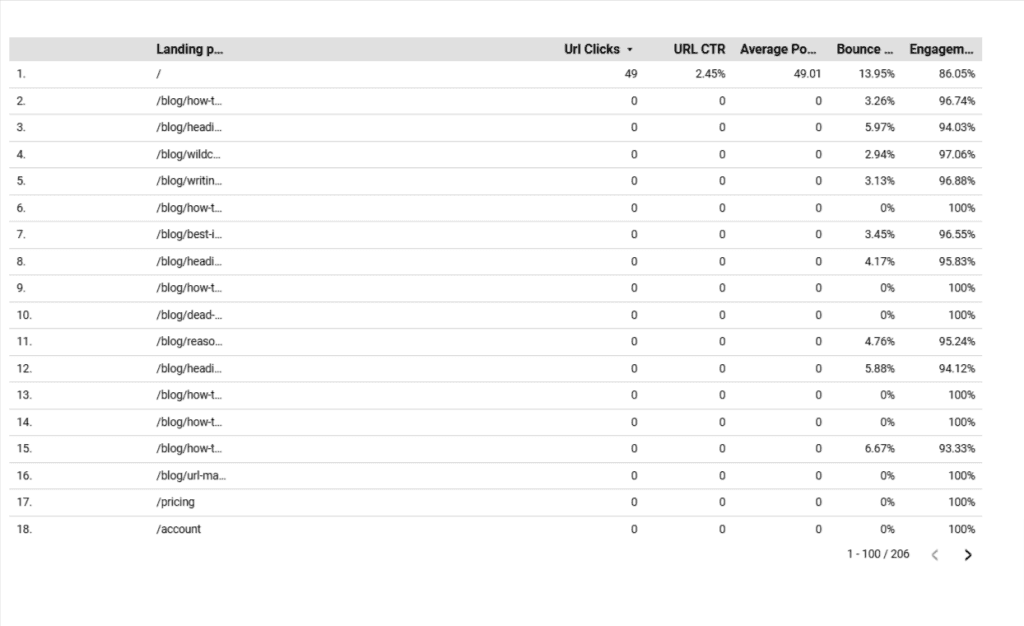
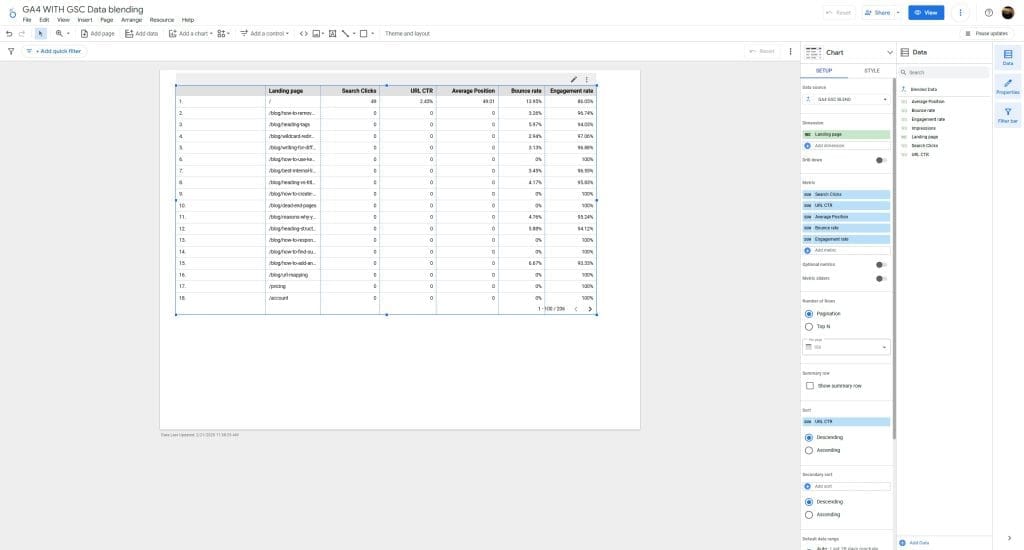
You now have a table with both GA4 and GSC, but you ight notice the null if you do not have data for that landing page.
To change or remove null, you can click on the table, go to Style and scroll down until you see Missing Data. You can select – or 0 or show blank
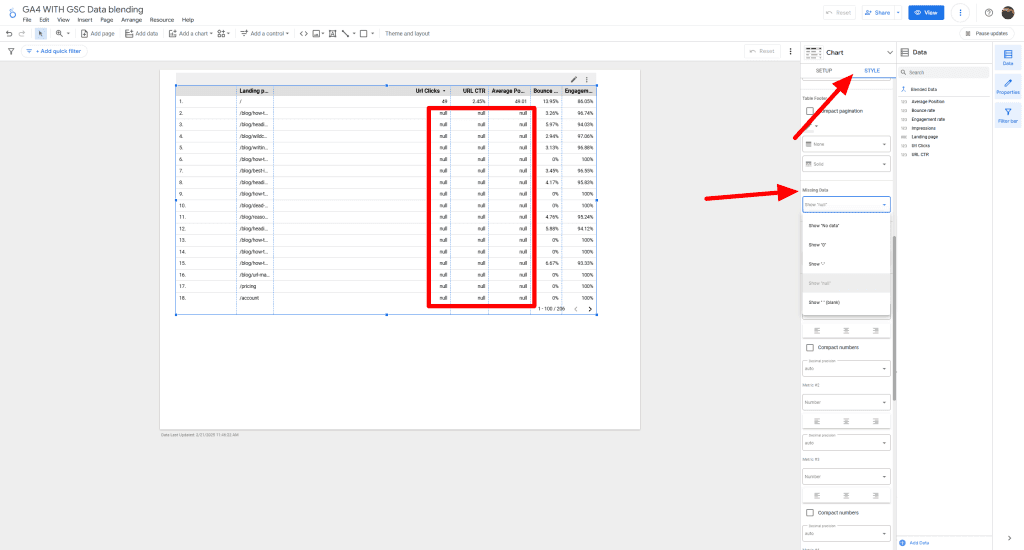
I’ve chosen to show 0:
Want clients to get it? Click Clicks in the metrics list, rename it “Search Clicks” in the “ADD Calculated” field. Maybe add a chart—click “Add a chart,” pick “Line Chart,” set it with the same source and metrics for trends.
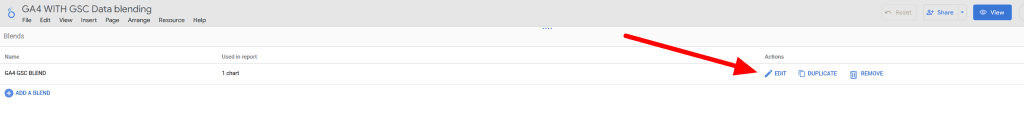
Go to Resource > Manage blend, click Edit:
Select Url Clicks, click on “Add Calculated Field”, Name it and in the Formula section, start typing Url and you can select the actual metrics and click save.
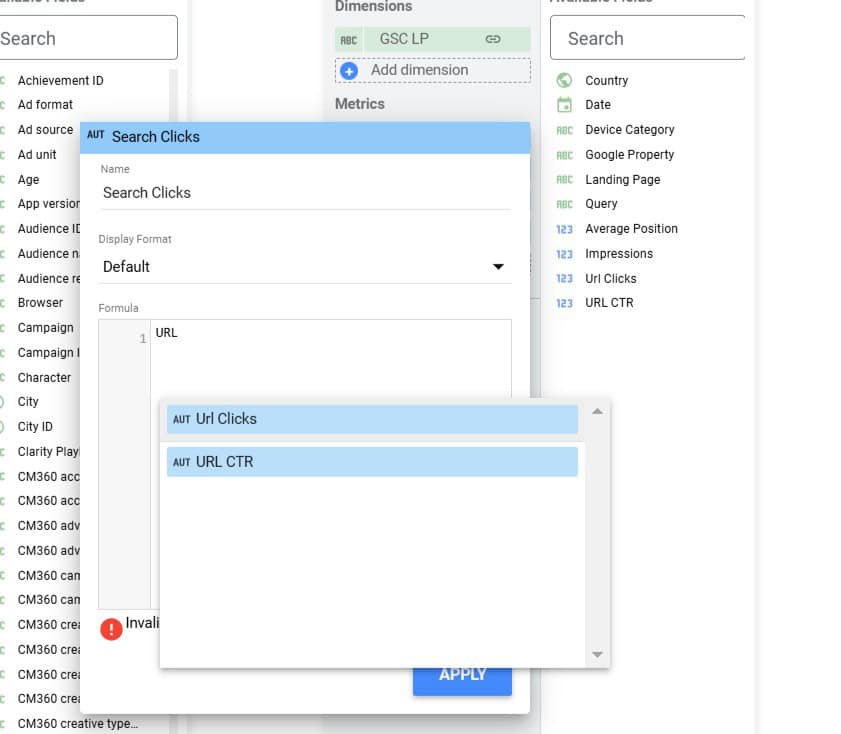
Now you can select Search Clicks as the metrics and you can rename all of the tables:
7. Tighten Up Blended Data with Filters and Sorting
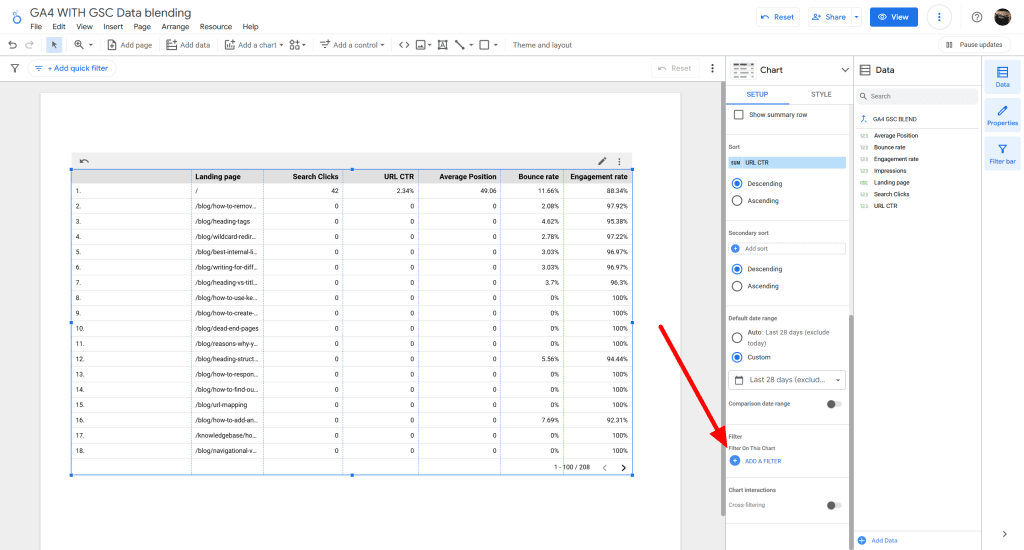
Select the Table: Make sure your table displaying the blended GA4 and GSC data is selected. You can see it’s selected in the screenshot below because the table has the blue outline and the right-hand properties panel is showing settings for “Chart” and “Data”.
Locate the “Default date range” Section:
- In the right-hand properties panel, look for the “Data” tab. It’s already selected in your screenshot.
- Scroll down within the “Data” tab until you find the section labeled “Default date range”. It’s located just above the “Filter” section.
Set the Date Range:
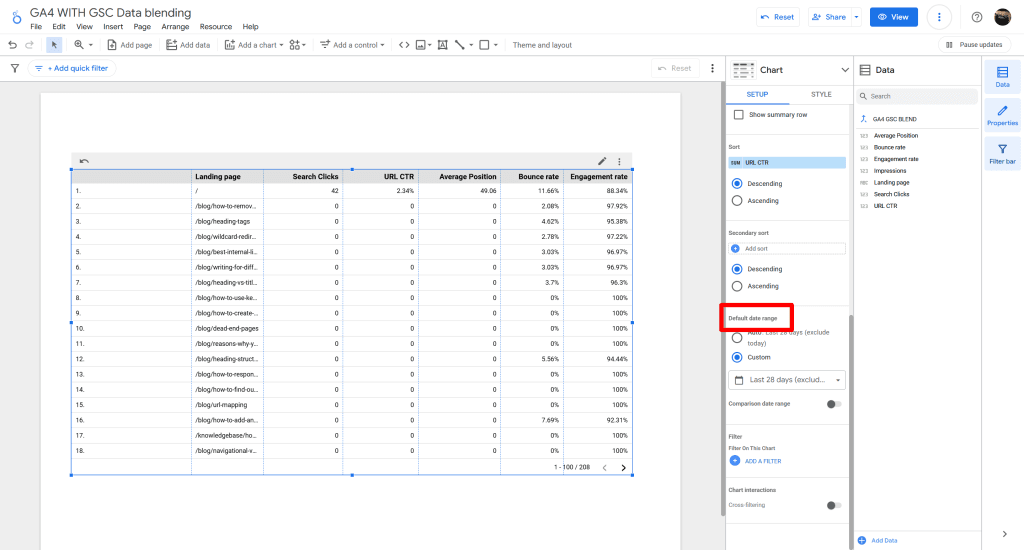
- Click on the date range selection. In your screenshot, it probably says “Auto date range”.
- A date range picker will appear.
- To use a quick date range: Click on “Custom” in the top right of the date range picker. Then you’ll see quick date range options like “Last 7 days,” “Last 30 days,” “This month,” etc. Select “Last 30 days” (or any other desired range).
- To set a custom date range: Click on the start and end dates in the calendar to select a specific date range.
- Click “Apply” in the bottom right corner of the date range picker.
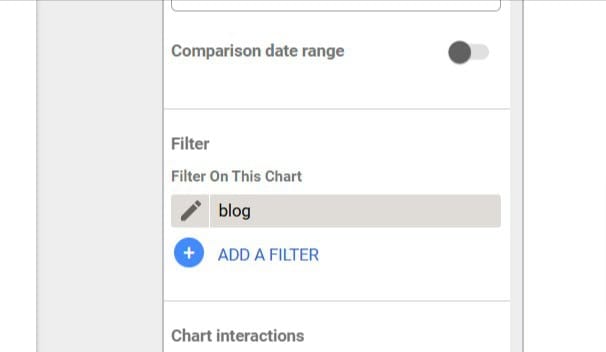
Locate the “Filter” Section:
- In the right-hand properties panel, under the “Data” tab (which is already selected in your screenshot), scroll down until you find the “Filter” section. It’s located directly below the “Default date range” section.
Click “Add a filter”:
- In the “Filter” section, click the blue button that says “Add a filter”.
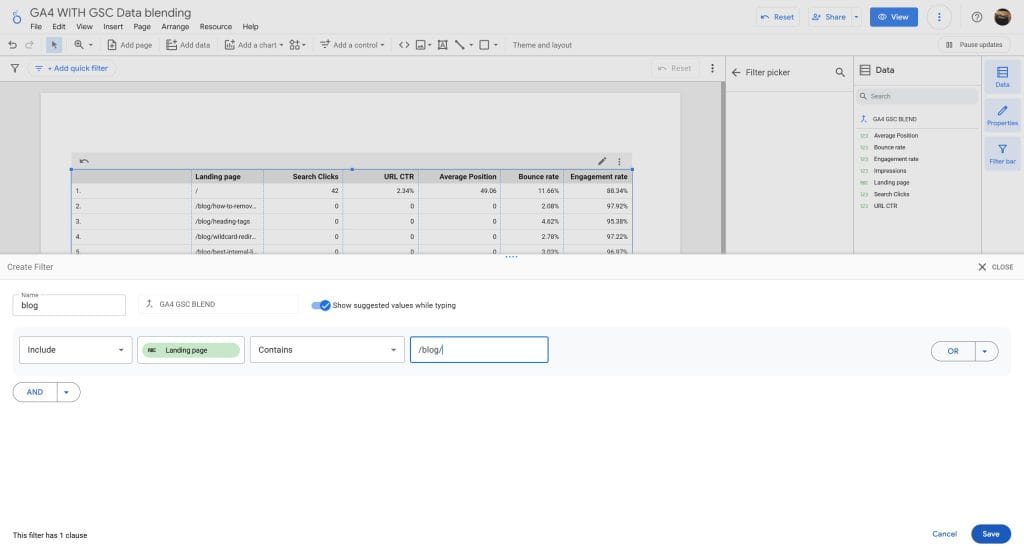
Create the Filter:
- A new filter creation panel will appear.
- Name your filter: In the top field, give your filter a descriptive name (e.g., “Product Pages,” “Specific Campaign,” etc.).
- Select the dimension: Click the “Select a field” dropdown and choose the dimension you want to filter by. In your case, you’ll likely want to use the cleaned landing page dimension you created (“GSC LP” or a similar name).
- Choose a condition: Select the condition you want to use (e.g., “Contains,” “Equals,” “Starts with,” etc.). For example, if you want to filter for product pages, you might use “Contains.”
- Enter the value: In the input field next to the condition, enter the value you want to filter by. For example, if you want to filter for product pages, you might enter
/product/. - Click “Save”: Click the blue “Save” button to save your filter.
Example Scenario (Blog or Product Pages):
Let’s say you want to filter your table to only show data for landing pages that contain “/product/”.
- You would click “Add a filter”.
- Name the filter “Product Pages”.
- Select the dimension “GSC LP” (or whatever you named your cleaned landing page field).
- Choose the condition “Contains”.
- Enter the value
/product/or /blog/ - Click “Save”.
8. Toss Interactivity into Looker Studio Reports
You can also add Advanced filter option to search for specific pages.
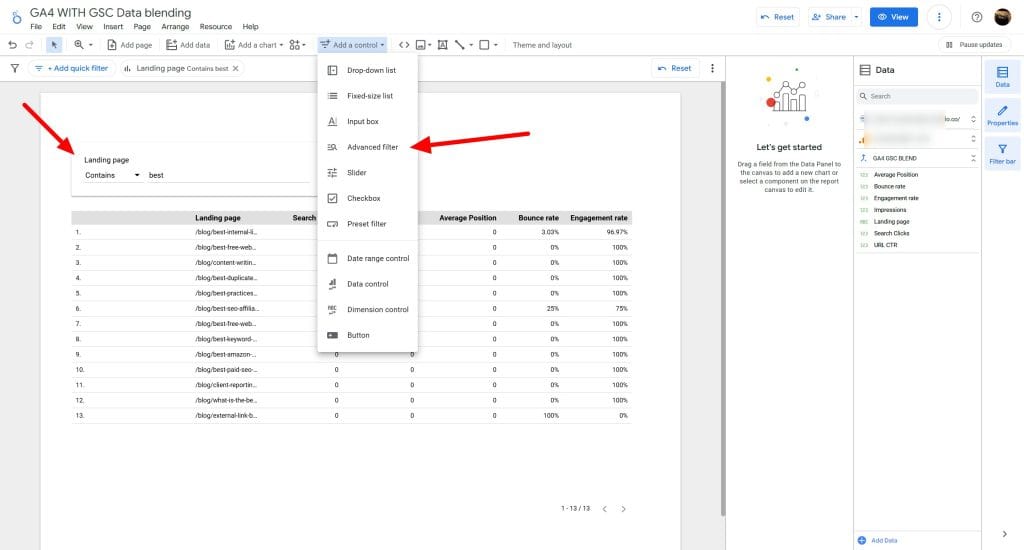
1. Add Control:
- Click “Advanced filter” in the toolbar.
- Place the input box on your report canvas where you want the search bar to appear.
Slow loading and other limitations of Looker Studio might restrict you from scaling.
You might have some of your clients Google Analytics and Google Search Console. In some cases, you might have multiple Google account for access. Or some are using trailing slash or not. Whether you are managing 5 clients to 20+ clients, it gets harder when you’re trying to scale your agency’s business. Think about how a client reporting platform can help. Read our article on Swydo vs Looker Studio for comparison or check out our other article on Looker Studio alternatives for more options.
Conclusion
You’ve got the whole rundown now—connect GA4 and GSC, sort out those join keys, add filters, and hand clients numbers that click. Agencies need this: one report to axe the mess and show your work pays off. Give it a spin, bend it for your trickiest clients, and see it pull through on crazy deadlines. Kick off with GA4 and GSC, then toss in whatever data they dump on you. Go build it.
How to Blend Data in Looker Studio
Expert answers to common questions about creating powerful multi-source reports
Data blending in Looker Studio is a feature that lets you combine metrics from multiple data sources (like GA4, GSC, Google Ads) into a single visualization. It works by joining data sources on a common dimension (like Landing Page or Date), allowing you to see related metrics side-by-side without switching between reports.
Agencies should use data blending because it saves significant time by eliminating manual data combination, creates more comprehensive client reports, shows the relationship between different marketing channels, and helps demonstrate ROI by connecting marketing activities to business outcomes. For example, blending GA4 with GSC shows how organic search visibility impacts actual website engagement and conversions.
Looker Studio can blend virtually any connected data sources. The most common blends for agencies include: GA4 + Google Search Console, Google Ads + GA4, multiple ad platforms (Google, Meta, LinkedIn), CRM data + website analytics, email platforms + GA4, and social media metrics + website performance data. Any sources that share a common dimension (dates, URLs, campaign IDs, etc.) can be blended.
Data sources are individual connections to platforms like GA4 or Google Ads, each showing metrics from just that platform. Data blending creates a new virtual data source that combines metrics from multiple sources using a common join key (like Landing Page). While a regular data source can only show metrics from one platform, a blended data source lets you see GA4 engagement metrics and GSC search metrics together in a single table or chart.
To blend GA4 and GSC data in Looker Studio:
- Add both data sources to your report
- Go to Resource > Manage Blends
- Click “ADD A BLEND”
- Select GA4 as Data Source 1 and “Landing Page” as Join Key 1
- Select GSC as Data Source 2 and “Landing Page” as Join Key 2
- Choose “Left outer join” as the Join Type
- Click “Save”
- Create a new table using your blend as the data source
Note: You’ll need to create a calculated field to fix URL formatting differences between GA4 and GSC (see the URL mismatch question in the Common Fixes tab).
The most useful metrics to blend from GA4 and GSC are:
From GA4: Users, Sessions, Engagement Rate, Conversion Rate, Average Session Duration
From GSC: Clicks, Impressions, CTR, Average Position
This combination reveals how organic search visibility (GSC metrics) translates to actual user behavior and conversions (GA4 metrics). For agency reports, focus on 4-6 key metrics that directly answer client questions rather than overwhelming with all available data.
A join key is the common dimension that connects your data sources. For GA4 and GSC, Landing Page is typically used. To set up a join key:
- In the blend configuration, select a dimension from your first source (e.g., Landing Page from GA4)
- Select a matching dimension from your second source (e.g., Landing Page from GSC)
- If the formats don’t match exactly (like URLs with vs. without domains), create a calculated field to standardize them
Other common join keys include Date (for time-based analysis), Campaign ID (for ad performance), or Source/Medium (for channel comparisons). The join key must exist in both data sources and have matching values.
For most GA4 and GSC blends, use a “Left outer join” with GA4 as the primary (left) source. This includes all pages from GA4 even if they don’t have matching GSC data, which is ideal because:
- GA4 tracks all site activity including pages not indexed in GSC
- You’ll see metrics for all pages users visit, not just those with search data
- It prevents data loss when GSC doesn’t have data for pages with UTM parameters
Use “Inner join” only when you specifically want to see just the intersection of data from both sources (e.g., only pages that both receive organic traffic and have conversions).
GA4 stores URLs without domains (e.g., /blog/post/) while GSC includes full URLs (e.g., https://example.com/blog/post/). Fix this mismatch with these steps:
- In your blend settings, select the GSC data source
- Click “Add Calculated Field”
- Name it “GSC Landing Path”
- Enter this formula (replace with your domain):
REGEXP_REPLACE(Landing Page, 'https://example.com(/+)$', '/')
For sites without trailing slashes:
REGEXP_REPLACE(Landing Page, 'https://example.com(/+)$', '')
Use this new calculated field as your GSC join key instead of the original Landing Page dimension.
Null values appear when there’s no matching data in one of your sources. For example, pages in GA4 that aren’t indexed in GSC will show null values for GSC metrics. To handle nulls:
- Select your table
- Go to Style tab
- Scroll to “Missing Data”
- Choose to display nulls as “0” (if the metric should be zero), “-” (for cleaner appearance), or leave blank
If you’re seeing unexpected nulls for pages that should have data in both sources, check your join key configuration for URL format mismatches or create a calculated field that uses IFNULL() to substitute zeros for nulls.
Blended reports often load slowly due to processing large datasets. Speed them up with these fixes:
- Apply data source filters before blending (filter out irrelevant data)
- Use shorter date ranges (last 30 days instead of all time)
- Reduce the number of metrics in your blend
- Add a landing page filter to show only top pages
- Create separate reports for detailed analysis vs. client meetings
For agency client presentations, create a streamlined dashboard with pre-filtered data showing only key metrics and top-performing pages to ensure quick loading during live meetings.
To rename metrics in blended data for clearer client reports:
- Select your blended data source
- Click on a metric you want to rename
- Select “Add Calculated Field”
- Name it something clear (e.g., “Organic Search Clicks” instead of “Clicks”)
- In the formula field, simply enter the original metric name
- Click “Save”
Use descriptive names that clarify the source and meaning of each metric. For example, rename “Clicks” to “GSC Clicks” or “Organic Search Clicks” to distinguish them from other click metrics in your report.
Creating calculated metrics with blended data lets you derive new insights. For example, to calculate “Conversion Rate per Impression” using GA4 and GSC data:
- Select your blended data source
- Click “Add Calculated Field”
- Name it “Conversion Rate per 1000 Impressions”
- Enter formula:
(Conversions / Impressions) * 1000 - Format as a number with appropriate decimals
Other useful calculated metrics include “Revenue per Click” (E-commerce Revenue / GSC Clicks) or “Engagement-to-Position Ratio” (Engagement Rate / Average Position) to identify high-performing content relative to its search visibility.
To blend Google Ads with GA4 data in Looker Studio:
- Add both GA4 and Google Ads data sources to your report
- Go to Resource > Manage Blends
- Create a new blend with GA4 as Data Source 1
- For Join Key 1, use Campaign (from GA4)
- Add Google Ads as Data Source 2
- For Join Key 2, use Campaign (from Google Ads)
- Select “Left outer join”
This allows you to see ad costs alongside conversion metrics. Ensure proper campaign tagging with consistent naming conventions across platforms. For more accurate attribution, you can also link your Google Ads and GA4 accounts directly through their respective settings.
Create advanced filters for blended data with these steps:
- Add a filter control: Click “Add control” > “Filter”
- Set it to use your blended data source
- Choose the dimension to filter on (e.g., Landing Page)
- Set the filter type (text, regex, numeric range, etc.)
For powerful agency reports, create these essential filters:
- Page type filter to focus on specific sections (/blog/, /product/, etc.)
- Performance threshold filter to show only high-impact pages (e.g., pages with >100 clicks)
- Search box for finding specific URLs quickly
- Date range selector with preset periods (last 30 days, last quarter)
Pre-configure dashboard pages with filters already applied for specific analysis views (e.g., “Top Converting Pages”, “SEO Opportunities”).
When Looker Studio data blending becomes too limited for agency needs, consider these alternatives:
- Dedicated reporting platforms: Tools like Swydo offer purpose-built agency reporting with better performance for multi-client management and simpler data connections
- Google BigQuery: Create a data warehouse that centralizes all client data, then connect Looker Studio to this single source
- API-based solutions: Use Python or R to extract, transform and load data into a consolidated database
Consider upgrading your solution when reports consistently take over 30 seconds to load, you need to manage similar reports across many clients, or you require complex data transformations that become unwieldy in Looker Studio.
To blend more than two data sources in Looker Studio:
- Start with your primary source (typically GA4)
- Add your first secondary source (e.g., GSC)
- Set up the join keys and join type
- Click “Add a table” in the blend settings
- Select your third data source (e.g., Google Ads)
- Configure the join key that matches your primary source
- Repeat for additional sources as needed
Keep in mind that each additional source increases processing time. For complex multi-source blends, consider creating a connection hierarchy where your most important relations are established first. Test your blend with small date ranges before expanding to full reporting periods.
Blend your data easily with Swydo’s seamless integration.
Start Free Trial