
You work in marketing, so you already know the pressure is on to get results. Clients want more than just creative ideas; they want to see a real return on their investment. In a world overflowing with data, relying on gut feelings and creative sparks won’t get you very far. To truly succeed, understand data—and that means knowing the difference between parameters and statistics.
The Marketing Challenge
A new client walks in the door. It’s a cool new footwear company that wants to reach young professionals. They have awesome products, but their past marketing hasn’t worked. You need a strategy that wins, and you need it now.
First, understand your target audience—what they like, how they act, what motivates them, and their problems. How can you get this valuable information without spending a fortune or wasting time on a wild goose chase for data?
Trying to get a survey to every single young professional who might like your client’s shoes is like trying to herd cats. It takes forever, costs a ton, and honestly, it’s impossible. Your clients wouldn’t be happy with that approach, and your budget would definitely take a hit.
Statistics become your best friend. They offer a practical way to gather important information without emptying your wallet or overworking your team. When you understand how statistics connect to the bigger idea of parameters, you can use data to make smart marketing choices that actually work.
Now that you understand the challenge, let’s look at what makes up marketing data.
What Are Parameters?
Think of a parameter as the ultimate truth in marketing data. It’s the definitive answer to your marketing questions and the key to really understanding your target audience. A parameter represents a characteristic of an entire population—the exact value you would find if you could measure every single person in the group you’re interested in.
Here are some important parameters for marketers:
- Average customer lifetime value: This is the gold mine. Understand how much money a customer will bring in over their lifetime to justify your marketing spend to clients and demonstrate long-term value. Confidently tell your client, “Our data shows that each new customer we get from this campaign will probably spend about $500 with us over the next three years.” That’s the power of understanding customer lifetime value.
- Overall brand awareness: In a market with lots of competition, brand awareness is key. Know how many people recognize your client’s brand to see how well your campaigns are doing and where you can improve. Want to get your client’s brand noticed by more young professionals? Track a parameter like “the percentage of young professionals who can name your client’s brand when given a list of competitors.” This becomes a critical number for your strategy.
- Conversion rate across all channels: This is what it all comes down to. Drive sales, generate leads, or increase website traffic—conversion rates show how successful you are. If you’re running a campaign across different channels, find out the actual conversion rate for each one—email, social media, paid ads, and so on. This helps you spend your money wisely and focus on the channels that give you the best return.
Finding these exact parameters is often like finding a needle in a haystack. You’re dealing with a huge group of people, and it’s just not possible to get data from every single one of them.
What is Statistics in Marketing?
Getting complete data sounds perfect, but there’s a more practical approach.
While parameters might seem ideal, statistics are the practical solution—and that’s a good thing! Statistics are your secret weapon, the tool that helps you tackle the challenges of marketing. They help you make smart choices based on real data, not just your instincts.
Analyze data from a small but representative group of your target audience to calculate statistics. This gives you a surprisingly accurate estimate of those hard-to-find parameters.
Collect Sample Data (e.g., Survey 500 customers)
Analyze & Find Patterns (e.g., 80% prefer mobile shopping)
Test Findings (e.g., Optimize mobile experience)
Scale Success (e.g., Roll out to all customers)
For example, determine how many likes, comments, and shares the average Instagram post about healthy food gets. Instead of looking at every single post about healthy food on Instagram (which would be impossible!), select a representative sample of, say, 1,000 posts from different accounts and calculate their average engagement. This statistic from your sample would give you a good idea of the engagement for all healthy food posts on Instagram.
Here’s how statistics can help you solve some common marketing problems:
| Marketing Goal | Sample Statistic | Insights Gained | How to Collect |
|---|---|---|---|
| Increase how many people open your emails | Look at the open rate of a small test email campaign | This helps you guess how many people will open your emails when you send them out to everyone | Test different subject lines on a small part of your email list |
| Get more people to click on your ads | Check the click-through rate of a test Facebook ad campaign | This helps you predict how many people will click your ads if you spend more money on them | Run a small test campaign with different ad designs and ways of targeting people |
| Get more people to take action on your website | See how many people take action on a new version of your landing page | This helps you guess how much your website actions will increase if you change your whole website | Test different versions of a landing page to see which one works best |
Use these sample statistics to make decisions based on data to improve your marketing and get the most out of your money—no magic needed!
Here’s a practical guide to when and how to use each type of data in your marketing:
Marketing Data Guide: When to Use What
Statistics (Sample Data)
Campaign Testing
• A/B test email subjects (1,000 subscribers)
• Social media ad variations (5% of budget)
• Landing page variants (split traffic)
Market Research
• Customer satisfaction surveys
• Product feedback interviews
• Competitor analysis
Best for: Quick insights & testing
Watch out for: Sampling bias
Parameters (Complete Data)
Financial Metrics
• Total revenue
• Customer lifetime value
• Campaign ROI
Platform Analytics
• Email list size
• Website conversion rates
• Social media follower count
Best for: Critical business decisions
Watch out for: Time & cost constraints
What’s the Difference Between a Parameter and a Statistic?
We’ve talked about what parameters and statistics are, but let’s make sure we’re clear on the differences between these two important ideas:
| Parameter | Statistic |
|---|---|
| Describes something about an entire population | Describes something about a sample |
| Uses Greek letters (like μ for the population mean) | Uses regular letters (like x̄ for the sample mean) |
| Has one fixed value (there’s only one true value for the population) | Can have different values depending on the sample |
| Usually hard to measure directly because you need data from everyone | Calculate it from the data you collect from your sample |
| The real value you’re trying to figure out | An educated guess of the real value based on your sample data |
These differences stem from a fundamental concept in data: populations versus samples
What’ the Difference Between Population vs. Sample?
To really get parameters and statistics, understand the difference between a population and a sample:
- Population: This is the whole group you want to learn about. It could be all your current customers, all the potential customers in a certain industry, or everyone in a specific group of people (like young professionals). It’s the big picture, the whole universe of people you want to understand.
- Sample: This is just a part of the population. It’s a smaller group you carefully choose to represent the larger population. Think of it as a mini version of your target audience, a group you can actually manage to collect data from and learn about the bigger group.
A sample should accurately represent the population. This means thinking about things like age, gender, location, interests, and anything else that matters. If your sample is biased, your statistics won’t give you a good estimate of what’s happening in the whole population, and your marketing choices could miss the mark.
And once you’ve got your sample or population, you’ll need to make sense of the numbers.
Key Number Types: Mean, Median, and Standard Deviation
You’ll come across some important types of numbers that help you summarize and understand your data:
- Mean (Average): Add up all the values and then divide by the total number of values to find the mean. For example, if you’re tracking how many times per month people in your target audience visit your website, the mean would tell you the average number of visits for everyone in your sample.
- Median: Arrange all the values in order from smallest to largest to find the median, which is the middle value. The median is helpful when you have data that might be affected by extreme values. For example, if you’re looking at how much money customers spend, the median purchase amount might be better than the mean if a few big spenders are throwing off the average.
- Standard Deviation: This tells you how spread out the data is from the mean. A small standard deviation means the values are clustered close to the mean, while a large standard deviation means they are more spread out. For example, if you’re looking at how satisfied customers are, a small standard deviation means most customers feel about the same, while a large standard deviation means there’s a wider range of opinions.
How to Use Statistics to Estimate Parameters
Let’s see how these concepts work in practice.
Since it’s not always possible to measure something about an entire population, use statistics from a sample to estimate the parameters. This is where statistics really shine!
Your client, an online clothing store, wants to launch a new email campaign to promote their latest collection. Instead of sending it to everyone on their email list, test it on a smaller group of, say, 1,000 subscribers. Analyze the open rates, click-through rates, and how many people actually buy something from that smaller group to get a good idea of how the campaign might do when you send it to everyone on the list.
Different statistical methods exist to estimate parameters from statistics, but the main idea is to use the information from your sample to make a good guess about what’s happening in the larger population. This helps you make smart choices about your marketing without having to collect data from every single person in your target audience.
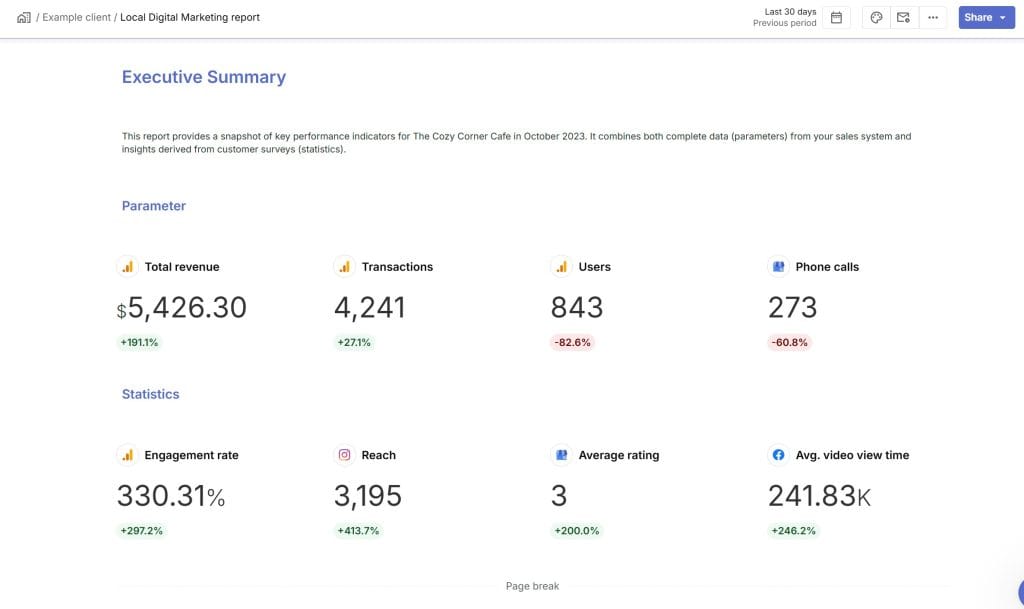
How to Tell if You’re Looking at Sample or Complete Data
As a marketer, you’re constantly bombarded with numbers. Revenue reports, social media metrics, customer feedback – all these contain either complete data (parameters) or sample data (statistics). Knowing which you’re looking at helps you make better decisions.
The Language Test
Pay attention to how the data is described. Absolute terms typically signal complete data, while less certain language suggests you’re looking at a sample.
Clear Signals in Your Reports:
| Parameter | Statistic |
|---|---|
| “Total revenue: $1.2M” | “Average order value: ~$85” |
| “All 12,543 subscribers” | “Based on 500 responses” |
| “Every transaction in 2023” | “Estimated market share” |
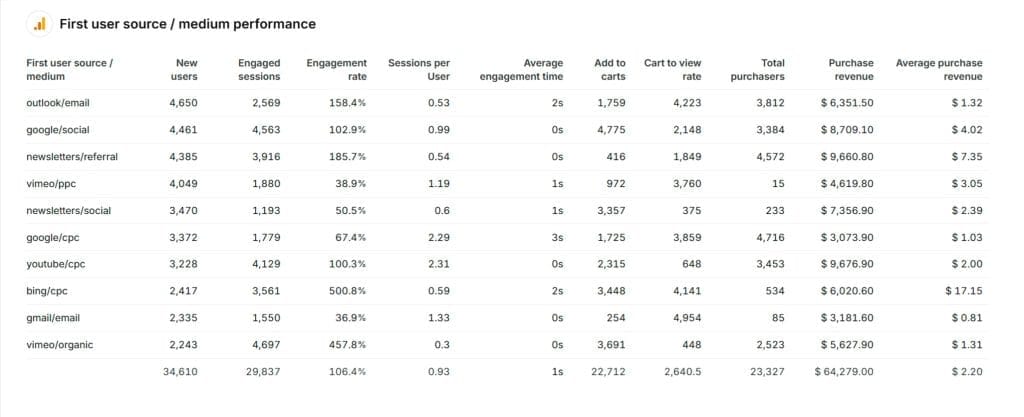
Where Your Data Comes From
Your data source often reveals whether you’re looking at a sample or complete picture. Consider a standard marketing analytics setup:
Internal systems like your CRM or payment processor give you parameters:
- Exact number of customers
- Precise revenue figures
- Complete email subscriber count
Third-party tools usually work with statistics:
- Google Analytics samples large traffic volumes
- Social media reach estimates
- Market research percentages
The Certainty Check
Look at how confident the claims are in your reports. When Netflix says “63% of members watched Wednesday in its first 28 days,” that’s a parameter – they know exactly who watched. But when they say “viewers might enjoy similar shows,” that’s based on statistical analysis of viewing patterns.
This distinction becomes crucial when:
- Planning marketing budgets
- Setting campaign goals
- Reporting to stakeholders
- Making product decisions
Understanding what you’re looking at helps you know how much confidence to place in the numbers and what kinds of decisions you can reliably make with them.
The Pros and Cons of Statistics and Parameters in Marketing
Now that you can identify your data type, let’s examine when to use each. Let’s break down what works and what doesn’t with each approach.
Working With Sample Data
Think of statistics like a taste test. Instead of eating the whole pot of soup, you try a spoonful to know if it’s good. In marketing, this means testing your ideas with smaller groups before going all-in with your budget.
What’s Good About It
When Netflix wants to test a new feature, they don’t roll it out to all 230 million subscribers at once. They test it with a smaller group first. That’s statistics in action, and here’s why it works:
- It’s practical and won’t break your budget: Instead of surveying every coffee drinker in America about your new brew, you can learn a lot from talking to just a few hundred. Your insights come faster and cheaper.
- You can predict what will work: If 30% of your test group loves your new ad, chances are good it’ll perform similarly with everyone else. This helps you make smarter decisions about where to spend your marketing budget.
- You spot patterns more easily: You might notice that customers aged 25-34 are twice as likely to buy after seeing Instagram ads versus emails. These insights help you adjust your marketing to match what works.
The Downsides
But statistics aren’t perfect. Here’s where things can go wrong:
- Your sample might be skewed: Say you run a customer satisfaction survey and get glowing reviews. Great news? Maybe not – if only your happiest customers bothered to respond, you’re missing the full picture.
- There’s always some uncertainty: When your test email gets a 25% open rate, the actual rate with your full list might be anywhere from 20-30%. You need to plan for this variation.
- Reading the data wrong is easy: High website traffic sounds great, but if those visitors aren’t buying anything, you might be misinterpreting what the numbers really mean.
Working With Complete Data
Unlike sampling, parameters mean studying your entire audience. It’s like counting every single person at a stadium instead of estimating based on the sections you can see clearly.
What’s Good About It
Getting data from everyone sounds ideal. Here’s why:
- You get exact numbers: You’d know precisely how many customers you have and what they want – no guessing required.
- Your decisions are rock-solid: With complete data, you can move forward confidently, knowing exactly what works and what doesn’t.
The Downsides
But there’s a reason most marketers don’t chase complete data:
- It’s usually impossible: Try getting data from every single customer or potential customer who might want your product. Even Amazon can’t do that.
- It costs too much and takes too long: By the time you finish gathering all that data, the market has probably changed anyway. Plus, the cost would blow most marketing budgets.
Understanding these trade-offs leads us to proven strategies for using both types of data.
How to Use Parameters and Statistics in Your Marketing and Best Practices
Just understanding statistics and complete data isn’t enough – you need to know how to use them effectively. Here’s your practical guide to getting reliable insights without wasting time and money.
Smart Sampling Strategies
- Mix Your Sources: A footwear brand learned this the hard way – their Instagram data showed one story (young, urban customers), while sales data told another (35-50 year old professionals were the big spenders). Now they combine social, email, in-store, and sales data.
- Use Statistical Power: A retail chain’s 100-person survey seemed fine but couldn’t detect important differences between customer groups. Using power analysis, they found they needed 385 responses for reliable insights.
- Target Specific Segments: When analyzing different age groups or customer types, maintain enough samples in each segment. Target aims for 400 responses per segment to keep their confidence levels high.
Smart Measurement
- Focus on Leading Indicators: Track metrics that predict sales, not just describe them. A software company found pricing page engagement predicted purchases better than general page views.
- Use Comparative Metrics: Raw numbers can mislead. Look at ratios like:
- Engagement rate vs total followers
- Customer acquisition cost vs lifetime value
- Conversion rate vs traffic quality
Quality Control
- Pilot Test Everything: Sephora avoided disaster by testing their survey questions with a small group first – terms like “skincare routine” meant wildly different things to different customers.
- Control for Time Bias: A restaurant chain discovered their satisfaction data skewed negative because happy customers were too busy to respond on weekends. They now weight responses by time and day.
Decision Making
- Set Clear Thresholds: Netflix uses specific viewing targets within 28 days to make show renewal decisions. Having preset triggers prevents analysis paralysis.
- Consider Full Costs: Amazon tracks not just conversion rates but total acquisition costs. Some “high-performing” channels weren’t worth their price when all costs were counted.
- Know When to Stop: Tesla launches with 80% confidence in their data rather than waiting for perfect information. They’d rather improve with real feedback than lose market advantage waiting for complete data.
This approach helps you balance the need for good data with the reality of marketing budgets and timelines.
Questions You Might Have About Statistics and Parameters
As you start applying these practices, you might have some questions.
1. How can I make sure the group I’m sampling accurately represents my target audience?
Use random sampling techniques to give everyone in the population an equal chance of being selected. You can also use stratified sampling to make sure your sample includes the important characteristics of your target audience.
2. What are some mistakes to avoid when working with parameters and statistics?
- Mixing up the two ideas: Always remember that parameters describe populations, while statistics describe samples.
- Thinking a small or biased sample represents everyone: Make sure your sample is big enough and represents your target audience well.
- Misunderstanding what statistical significance means: Just because something is statistically significant doesn’t always mean it’s important in the real world.
- Forgetting about the margin of error: When you make estimates or predictions, remember that there’s always some margin of error.
3. What tools can help me with statistical analysis?
Of course! Here are some popular ones:
- Microsoft Excel: Use this for basic data analysis and creating visuals.
- Google Analytics: Use this for website and marketing data.
- R or Python: Use these for more advanced statistical work.
- SPSS or SAS: Use these for specialized statistical analysis.
You can also find tons of online resources, courses, and tutorials to help you learn more about statistics and data analysis.
4. What is statistical significance, and why is it important in marketing?
Statistical significance helps you figure out if the results you see in your sample are probably true for the whole population or if they might just be due to random chance. It’s usually measured using p-values and confidence intervals.
For example, if you’re testing two versions of an ad and one has a higher click-through rate, statistical significance tells you how sure you can be that this version is actually better and not just doing better by chance.
Understand statistical significance to make good marketing decisions. This helps you avoid wrong conclusions from your data and makes sure your campaigns are based on real insights, not just random luck.
Next Steps
Start with these three actions this week:
- Audit Your Data Sources: Look at your last marketing report. Label each metric as sample or complete data. Are you making decisions based on the right numbers?
- Test Smart, Not Big: Before your next campaign launch, test with 5% of your audience. Use what you learn to improve your message before going all-in.
- Check Your Confidence: For your key metrics (conversion rate, engagement, sales), know your margin of error. If you’re not confident in the numbers, increase your sample size.
Better data leads to better decisions. The rest is up to you.
Parameter vs Statistics FAQ
Essential answers to understand the key differences and applications in marketing data
A parameter is a numerical value that describes an entire population (complete data set), while a statistic is a numerical value that describes a sample (subset of the population). Parameters are fixed values that represent the “truth” about a population, whereas statistics are estimates of parameters based on sample data and can vary from sample to sample.
For example, if you measure the average purchase value of every customer who bought from your store last year (parameter), you’ll get one fixed value. But if you measure the average purchase value from a random sample of 500 customers (statistic), that value is an estimate that would likely change if you selected a different sample of 500 customers.
Parameters are typically represented by Greek letters, while statistics are represented by Latin (Roman) letters:
- Population mean (parameter): μ (mu)
- Sample mean (statistic): x̄ (x-bar)
- Population standard deviation (parameter): σ (sigma)
- Sample standard deviation (statistic): s
- Population proportion (parameter): P
- Sample proportion (statistic): p
These distinct notations help statisticians and data analysts clearly communicate whether they’re referring to a complete population value or an estimate based on a sample.
While parameters provide exact values about a population, they’re often impossible to obtain for three key reasons:
1. Size constraints: Many populations are too large to measure completely. For example, measuring every consumer’s opinion about a product would be impractical.
2. Resource limitations: Collecting data from an entire population is expensive and time-consuming. By the time you gather complete data, market conditions may have already changed.
3. Accessibility issues: Some population members may be unreachable or unwilling to provide data, making complete measurement impossible.
Statistics from well-designed samples offer a practical alternative, providing reliable estimates without these limitations.
Statistics serve as estimators of parameters. The fundamental relationship is that statistics (calculated from samples) are used to make inferences about parameters (the true values in the population). This relationship forms the basis of inferential statistics.
For example, when a polling organization surveys 1,500 voters to predict an election outcome, they use the sample’s voting preferences (statistic) to estimate how the entire voting population will vote (parameter). The quality of this estimation depends on:
1. Sample size: Larger samples generally provide more accurate estimates.
2. Sampling method: How representative the sample is of the population.
3. Variability: How much natural variation exists in the population being measured.
Use parameters when:
- You have access to complete data (e.g., all transactions in your database)
- Making critical financial or strategic decisions where precision is essential
- Working with smaller, fully accessible populations (e.g., all employees in your company)
- Reporting official figures (e.g., total revenue, customer count)
Use statistics when:
- Dealing with large populations where complete measurement is impractical
- Testing marketing campaigns before full deployment
- Needing quick insights without the time/cost of comprehensive data collection
- Conducting market research about competitors or industry trends
In practice, effective analysis often combines both: using parameters for internal data you fully control and statistics for broader market insights.
To determine whether you’re working with a parameter or a statistic, ask yourself:
Are you examining every member of the population? If yes, you’re working with parameters. If you’re only looking at a subset, you’re working with statistics.
Look for these clues in reports and analytics:
- Parameter indicators: “Total,” “All,” “Complete,” “Every,” exact counts (12,543 subscribers)
- Statistic indicators: “Sample,” “Estimated,” “Projected,” “Based on,” “Approximately,” margins of error
Also consider the data source. Internal systems (CRM, payment processors) typically provide parameters about your own customers, while third-party tools (Google Analytics, market research) usually provide statistics based on samples.
The accuracy of statistics in estimating parameters depends on three key factors:
1. Sample size: Larger samples generally produce more accurate estimates with smaller margins of error. For instance, a survey of 1,000 customers typically provides a more reliable estimate than a survey of 100 customers.
2. Sampling method: Random sampling, where every member of the population has an equal chance of selection, produces more accurate estimates than convenience sampling or voluntary response methods. Stratified random sampling, which ensures representation across important subgroups, can further improve accuracy.
3. Population variability: More diverse populations require larger samples to achieve the same level of accuracy. If your customers have widely varying behaviors or preferences, you’ll need larger samples to accurately capture that diversity.
When properly designed, statistical samples can provide remarkably accurate estimates, often within 3-5% of the true parameter value, while costing a fraction of what complete data collection would require.
Margin of error represents the amount of random sampling error in a survey’s results. It indicates the range within which the true parameter likely falls. For example, if 60% of your sample prefers your product with a ±3% margin of error, the actual population percentage probably falls between 57% and 63%.
Why it matters:
1. Decision confidence: It helps you understand how much uncertainty exists in your data. Smaller margins of error give you more confidence in your decisions.
2. Resource allocation: If the margin of error is too large for comfort, you might need to invest in larger samples before making important decisions.
3. Comparing results: When comparing two statistics (e.g., performance metrics from different campaigns), the margin of error helps determine if differences are statistically significant or might be due to random variation.
Generally, larger sample sizes reduce margin of error, following a “square root rule” – to cut your margin of error in half, you need to quadruple your sample size.
A/B testing is a perfect example of using statistics to make marketing decisions:
The statistic: The conversion rate observed in your test groups (e.g., 5.2% for version A, 6.8% for version B)
The parameter: The true conversion rate you would get if all your customers saw each version
When running A/B tests, marketers use sample statistics to estimate how the entire customer base would respond. This process involves:
1. Statistical significance: Determining whether the observed difference between versions is likely real or just random chance. This typically requires a p-value less than 0.05 (95% confidence).
2. Sample size calculation: Ensuring enough visitors are included in each test group to detect meaningful differences. Too small a sample leads to inconclusive results.
3. Extrapolation: Using the winning version’s performance in the test to project overall business impact (e.g., “This change should increase overall conversions by approximately 30%”).
These essential marketing parameters provide complete data that forms the foundation of your marketing strategy:
1. Customer Lifetime Value (CLV): The total revenue a customer generates throughout their relationship with your business. This parameter helps determine how much you can afford to spend on customer acquisition.
2. Customer Acquisition Cost (CAC): The total cost of acquiring a new customer, including all marketing and sales expenses. The CAC:CLV ratio should typically be 1:3 or better for sustainable growth.
3. Conversion Rate: The percentage of visitors or leads who complete a desired action. Track this across all channels to identify your most effective marketing pathways.
4. Churn Rate: The percentage of customers who stop using your product or service within a given time period. This parameter directly impacts your growth potential and revenue stability.
5. Net Promoter Score (NPS): A measure of customer loyalty and satisfaction, calculated from responses to the question: “How likely are you to recommend our company to a friend or colleague?”
Effective sampling helps marketers gain reliable insights without surveying every customer. Follow these best practices:
1. Use stratified random sampling: Ensure your sample includes proportional representation from key customer segments (age groups, purchase frequency, product categories). This prevents missing insights from smaller but important customer groups.
2. Determine appropriate sample size: For most marketing surveys, aim for:
- ±3% margin of error: 1,000+ respondents
- ±5% margin of error: 400+ respondents
- ±10% margin of error: 100 respondents
3. Control for response bias: Consider when and how you collect feedback. Customers with extreme opinions (very satisfied or very dissatisfied) are more likely to respond, potentially skewing results. Offer incentives to encourage broader participation.
4. Test for statistical significance: When comparing groups or time periods, use statistical tests to determine if differences are meaningful or just random variation.
5. Combine quantitative and qualitative data: Supplement statistical analysis with in-depth interviews from a smaller sample to understand the “why” behind the numbers.
When presenting statistical findings, follow these practices to ensure clarity and build confidence:
1. Be transparent about methodology: Briefly explain your data source, sample size, and collection method. This builds trust in your findings and allows listeners to judge the reliability of your data.
2. Clearly distinguish between parameters and statistics: Use precise language that indicates when you’re presenting complete data versus estimates:
- Parameter: “Our total revenue increased by 12% last quarter.”
- Statistic: “Based on our survey of 500 customers, approximately 67% prefer the new design.”
3. Include confidence intervals for key statistics: Instead of just saying “42% of customers prefer option A,” say “42% prefer option A, with a margin of error of ±4%.” This acknowledges the uncertainty inherent in statistical estimates.
4. Connect data to business outcomes: Go beyond reporting numbers by explaining what they mean for business decisions: “This 20% increase in click-through rate should translate to approximately 1,200 additional qualified leads per month.”
5. Use visual comparisons: Show how your statistics compare to industry benchmarks, past performance, or competitors to provide context and meaning.
Even experienced marketers make these common statistical mistakes:
1. Confusing correlation with causation: Just because two metrics move together doesn’t mean one causes the other. For example, ice cream sales and drowning rates both increase in summer, but ice cream doesn’t cause drowning – both increase due to warmer weather.
2. Selection bias: Drawing conclusions from non-representative samples. For instance, surveying only your email subscribers might miss insights from customers who prefer social media.
3. Ignoring confidence intervals: Treating point estimates (like “18% conversion rate”) as exact rather than acknowledging the statistical uncertainty. This leads to overconfidence in small differences.
4. Data dredging: Analyzing data in multiple ways until finding a “significant” result, which often happens by chance. This is why pre-defining success metrics is important.
5. Misinterpreting significance: Statistical significance doesn’t always equal practical importance. A 0.1% improvement in conversion rate might be statistically significant with a large sample but have minimal business impact.
Evaluate marketing reports and research using these critical questions:
1. Is the sample size reported? Quality reports always disclose how many people or events were measured. Be skeptical of findings without sample sizes.
2. Is the sampling method explained? Reports should describe how participants were selected. Random sampling produces more reliable results than convenience sampling.
3. Are margins of error included? Properly conducted research acknowledges uncertainty. Look for confidence intervals (e.g., 35% ± 3%) or p-values for comparative claims.
4. Is the full methodology transparent? Quality research describes data collection methods, question wording, and analysis techniques. Vague descriptions may hide methodological flaws.
5. Are limitations acknowledged? Honest research discusses potential weaknesses or biases. Reports claiming perfect certainty should raise red flags.
6. Do the conclusions match the data scope? Watch for overgeneralizations, like claiming “all customers want X” based on limited data from a specific customer segment.
Sampling bias occurs when your sample doesn’t accurately represent your target population, leading to misleading insights. Here’s how to minimize it:
1. Use random selection methods: Rather than choosing participants based on convenience, use randomization techniques that give everyone in your population an equal chance of selection.
2. Implement stratified sampling: Ensure key demographic segments appear in your sample in the same proportions as in your target population. For example, if 60% of your customers are female, aim for 60% female respondents.
3. Consider timing effects: Collecting all your data on weekdays might miss weekend shoppers. Schedule data collection across different times and days to capture various customer types.
4. Use multiple channels: If you only survey customers through email, you’ll miss insights from those who don’t read emails. Combine data from different channels (email, in-app, phone, in-store) for a more complete picture.
5. Incentivize appropriately: Offering too large an incentive can attract professional survey-takers rather than typical customers. Small, relevant incentives tend to produce more representative samples.
6. Check sample demographics: Compare the characteristics of your sample against what you know about your overall customer base to identify and potentially correct for discrepancies.
These statistical concepts frequently cause confusion in marketing contexts:
1. Statistical significance vs. practical significance: Many marketers celebrate “statistically significant” results without considering their actual business impact. A 0.5% improvement in click rates might be statistically significant but practically meaningless.
2. Sample size requirements: There’s a common misconception that any sample over 30 is sufficient. In reality, required sample size depends on population variability, desired confidence level, and the size of the effect you need to detect.
3. Representativeness vs. size: Many focus exclusively on getting a large sample while ignoring whether it represents their target audience. A smaller but truly representative sample often provides more accurate insights than a larger biased one.
4. Mean vs. median: The arithmetic mean (average) is frequently used when the median would be more appropriate, especially with skewed data like spending amounts, where a few high spenders can dramatically inflate the average.
5. Confidence intervals: These are often misinterpreted as “the range where 95% of values fall” rather than “the range that has a 95% chance of containing the true parameter.” This subtle difference affects how findings should be applied.
Make smarter decisions with the right marketing data today.
Start Your Free Trial Today