
You know something’s broken with how your agency handles data. Your team burns entire days on reports that clients barely glance at. Or worse, you get that dreaded question after every presentation: “Okay, but what does this actually mean for my business?”
The real problem isn’t your data or your clients. Most agencies fundamentally misunderstand the difference between reporting and analytics—and this confusion costs you growth, profits, and clients.
The Hidden Cost of Getting This Wrong
When you confuse reporting with analytics, three things happen to your agency, and they compound over time.
First, you create a time trap. Your team ends up spending 15-20 hours per client every month just organizing data into pretty charts. That’s not an exaggeration—98% of agencies are stuck in this exact cycle. Do the math on your hourly rate. You’re literally burning money.
Second, you become replaceable. When all you do is show clients their Facebook spend and Google Analytics traffic, you’re not providing insights—you’re just reformatting information they could get themselves. Any freelancer with basic Excel skills can do that. And increasingly, AI tools can do it for free.
But the third impact is the killer: you’re training clients to see you as an expense, not an investment. Because when you only report on what happened without explaining why it matters or what to do next, clients naturally start questioning your value. They start shopping around. They push back on your rates. Eventually, they leave.
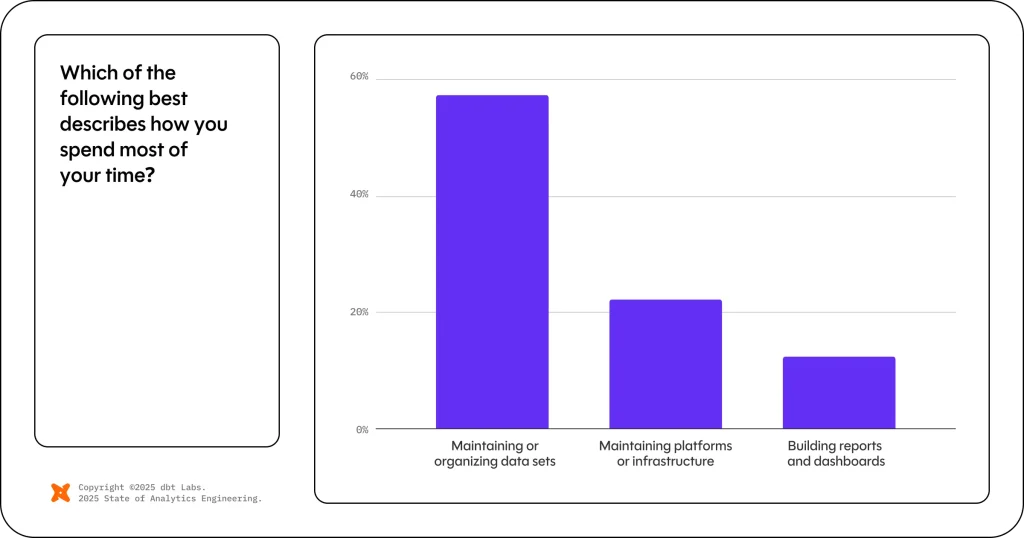
The 2025 State of Analytics Engineering Report from dbt Labs found that 57% of data professionals spend most of their time just organizing data. Think about that. More than half of your data work is just moving numbers around, not generating insights that drive growth.
What Reporting Really Means for Your Agency
Let’s clear up the confusion. Reporting is the systematic collection and presentation of data to show what happened during a specific time period. It’s descriptive by nature. When you pull last month’s ad spend, calculate cost per lead, or show traffic trends, that’s reporting.
Think of reporting as your business’s scorecard—it presents data in structured formats like tables, charts, and dashboards to communicate performance to stakeholders. Common agency reports include campaign performance summaries, budget tracking sheets, and channel comparison tables. The focus stays on predefined metrics and KPIs that everyone agrees matter.
Reporting serves a critical purpose—it creates a shared understanding of reality. Without it, you make decisions based on assumptions and feelings rather than facts. Your client needs to know their cost per acquisition increased from $45 to $67 last month. That’s important information.
But here’s where agencies get stuck. They think prettier or more detailed reports equal better service. So they add more charts, more metrics, more pages. They invest in expensive visualization tools. They create 50-page monthly documents that take days to produce.
This is backwards. The value of reporting isn’t in its complexity—it’s in its clarity and consistency. Standardized, automated reporting reduces analysis time by 40%. That means instead of 20 hours on reports, you could spend 12. The other 8 hours? That’s where analytics comes in.
The Reporting Framework That Actually Works
After we analyzed hundreds of agency workflows, the most efficient agencies follow this reporting structure:
Automated Data Collection: Every data source connects to a central system. No manual CSV downloads. No copy-pasting between platforms. Tools like Supermetrics or Improvado handle this for under $1,000/month. Automation alone cuts reporting time by 65%.
Standardized Templates: Create three core report types that cover 90% of client needs:
- Weekly pulse reports (5 key metrics, automated delivery)
- Monthly performance reports (channel breakdowns, trend analysis)
- Quarterly business reviews (strategic insights, competitive analysis)
Role-Based Access: Stop sending everyone everything. CMOs need different information than channel managers. Build separate views, role-specific reporting increases client engagement by 40%.
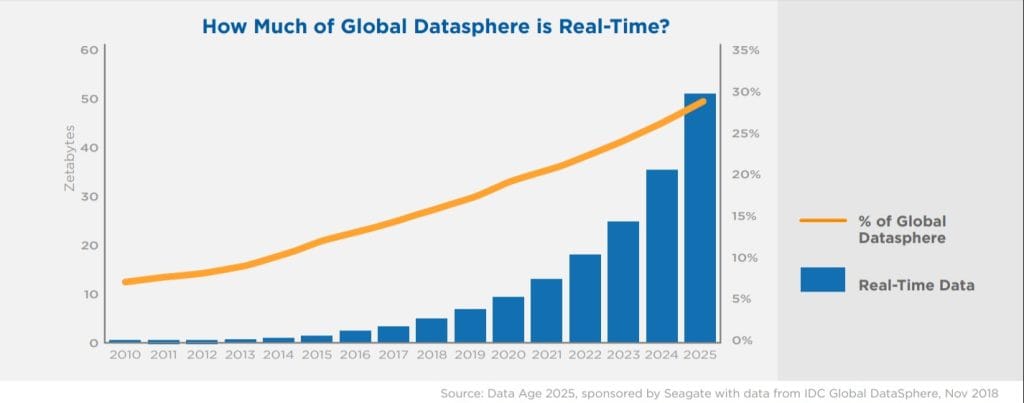
Real-Time Dashboards: Static PDFs are dead. IDC research confirms that 30% of data will be real-time. Your clients check their sales data on phones. They expect marketing data to work the same way.
Analytics Separates Average from Exceptional
Now we get to what separates average agencies from exceptional ones. Analytics takes your reporting data and answers three critical questions:
- Why did this happen?
- What will happen next?
- What should we do about it?
Analytics digs beneath the surface, using statistical methods and models to identify patterns, trends, and correlations that aren’t visible in basic reports. While reporting shows you the score, analytics explains the game strategy and predicts the final outcome.
This is where you stop being a vendor and become a strategic partner.
Consider this scenario. Your reporting shows that a client’s Google Ads CPA jumped from $15 to $37.39 over the past week. That’s a staggering 274.9% increase—your costs nearly tripled. But reporting stops there. Analytics digs deeper.
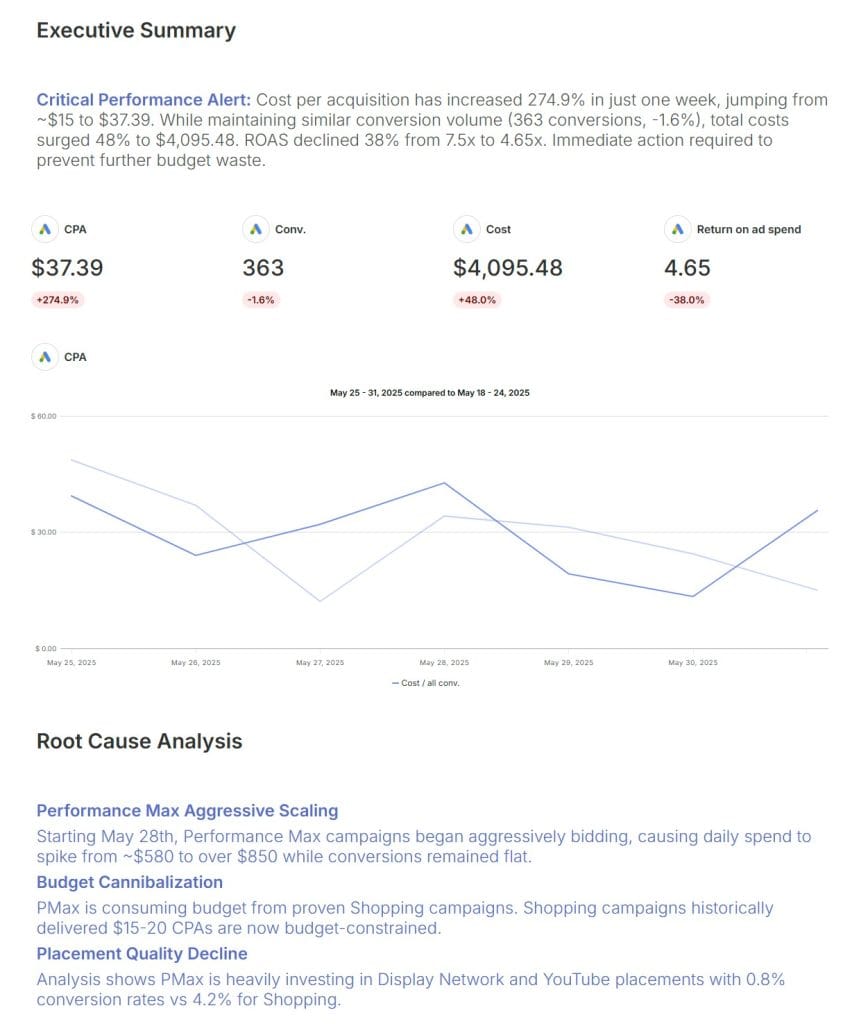
Through analysis, you discover the spike started May 28th when Google’s Performance Max campaigns began aggressively scaling. Despite conversions dropping slightly (-1.6%), your costs surged 48%. You segment by campaign type and find that PMax is burning through budget on broad match keywords and display placements while your proven Shopping campaigns got throttled. The kicker? Your ROAS plummeted from 7.5x to 4.65x—a 38% decline in profitability.
You calculate that capping PMax spend at $500/day while reallocating the remaining budget to Shopping campaigns will bring CPA back to $20-25 within 10 days, while actually increasing conversion volume.
See the difference? Reporting told you costs exploded. Analytics revealed the exact campaign causing the bleed and how to stop it.
Analytics maturity breaks down into four levels. Where you are—and where you need to be—determines your growth potential.
Level 1 Descriptive Analytics (40% of agencies)
You can explain what happened through historical data. Basic segmentation, period-over-period comparisons, channel performance breakdowns. This is barely beyond reporting. Client retention averages 14 months because you’re not bringing unique value.
Level 2 Diagnostic Analytics (35% of agencies)
You identify root causes and correlations. You can explain why conversion rates vary by device, how seasonality impacts performance, which creative elements drive results. Client retention jumps to 24 months because you solve problems, not just identify them.
Level 3 Predictive Analytics (20% of agencies)
You forecast future performance through statistical models. You predict when campaigns will fatigue, estimate next quarter’s CAC, identify opportunities before competitors. Clients stay 36+ months because you help them see around corners.
Level 4 Prescriptive Analytics (5% of agencies)
You don’t just predict—you prescribe specific actions. AI helps optimize in real-time. You proactively adjust strategies based on predictive models. These agencies keep clients 48+ months and charge 50-100% premiums.
The key to advancement isn’t buying better tools. You develop analytical thinking throughout your organization.
Build Analytical Capabilities Without Breaking the Bank
The biggest misconception about analytics is that it requires massive investment in tools and data scientists. That’s what software vendors want you to believe. The reality is different.
You can build serious analytical capabilities with smart processes and basic tools. Here’s how.
Start With the Right Questions
Before you analyze anything, you need clear questions to answer. Not “how are our campaigns doing?” but specific, actionable questions like these:
- Which audience segments have the highest lifetime value?
- What’s causing our CAC to increase on Google Ads?
- How does creative fatigue impact our Facebook ROAS?
- Which attribution model most accurately reflects our customer journey?
These questions drive focused analysis that produces actionable insights. Without them, you just explore data and hope to stumble onto something interesting.
Build Your Tech Stack Strategically
PwC research shows that AI adoption is progressing rapidly across all sectors, with productivity gains of 20-30% in marketing alone. But according to AIIM research, only 3% of teams have achieved full workflow automation with AI/ML technologies. Don’t chase shiny objects. Build systematically.
For agencies under $1M revenue:
- Google Analytics 4 for web analytics (free) – Track website performance
- Swydo Starter for reporting and data aggregation ($49-89/month) – Pull data from all marketing platforms, create white-labeled reports
- ChatGPT Plus for insight generation ($20/month) – Help interpret data anomalies and generate recommendations
This stack costs $59-109/month and immediately positions you as professional. You get automated data collection, white-labeled reports, and AI-powered insights from day one.
For agencies $1M-5M revenue:
- Swydo Professional for advanced reporting ($89-289/month) – Unlimited users, dashboards and reports
- Power BI Desktop for deep analysis (free) or Tableau Creator ($75/user/month) – Complex visualizations, statistical analysis, predictive modeling
- ChatGPT Team for collaborative insights ($30/user/month) – Team-wide AI assistance
- Part-time data analyst or trained team member
Investment: $400-600/month. Why this combination works: Swydo handles all your client reporting and data aggregation needs, while Power BI/Tableau gives you advanced analytical capabilities for internal strategy work. You get professional client deliverables AND deep analytical power.
For agencies above $5M:
- Swydo for scaled reporting (custom pricing)
- Data warehouse (BigQuery/Snowflake) for $1,000-3,000/month – Historical data storage, custom data models
- Looker or Tableau Server for team-wide analytics – Collaborative analysis
- Full-time data analyst or data scientist
- Custom ML models through Vertex AI or AWS SageMaker
Total investment: $5,000-10,000/month. At this scale, you need Swydo for efficient client reporting across hundreds of accounts, plus a data warehouse for deep historical analysis and predictive modeling that goes beyond what any reporting tool can provide.
Develop Analytical Frameworks
The secret to scalable analytics is repeatability. Think of these as recipes—once perfected, anyone on your team can follow them.
Attribution Analysis Framework
Most agencies guess at attribution. You need a systematic approach. Start with your client’s sales cycle. B2B SaaS with 6-month sales cycles needs different attribution than e-commerce with instant purchases.
For short cycles (under 30 days), last-click attribution often works. But as cycles extend, you need multi-touch models. Google’s data-driven attribution provides a good starting point, but you’ll want to customize based on your client’s specific journey.
Create templates that automatically pull data from all touchpoints, apply your chosen attribution model, and visualize the customer journey. This transforms a complex analysis into a repeatable process.
Customer Lifetime Value Analysis
CLV analysis reveals which channels and campaigns drive long-term value, not just initial conversions. But most agencies stop at the first purchase.
Build a framework that tracks cohorts over time. Connect your ad platforms to your client’s CRM or e-commerce platform. Calculate not just initial CAC but payback periods and total LTV by channel.
According to Gartner research, only 20% of analytics insights drive business outcomes. Why? Because most analyses answer interesting questions rather than important ones. Your frameworks should focus on decisions that impact revenue, costs, or customer experience.
The Psychology of Data Presentation
Here’s something crucial most agencies miss. How you present data matters as much as the data itself. Clients don’t just want information—they want confidence that you understand their business and can drive results.
The difference between reports that get ignored and analytics that drive action comes down to presentation and context.
The Trust Equation
Every data presentation either builds or erodes trust. Build trust with this hierarchy:
Start with business impact: Don’t lead with vanity metrics. Connect every insight to revenue, costs, or strategic goals. “Your Facebook CAC increased 23%” means nothing. “Your Facebook CAC increased 23%, which added $47,000 to acquisition costs this month” drives action.
Provide context obsessively: Numbers without context are meaningless. Always show current performance, historical trends, competitive benchmarks, and progress toward goals. A 2.5% conversion rate might be terrible for e-commerce but excellent for B2B SaaS.
Acknowledge uncertainty: Analytics involves prediction and interpretation. Be transparent about confidence levels. “Based on current trends, we project Q4 revenue of $2.3M ± 15%” builds more trust than false precision.
Make recommendations specific: Vague suggestions kill credibility. Instead of “we should optimize Facebook ads,” say “shift 30% of Facebook budget from broad audiences to lookalike audiences based on high-LTV customers, implement Monday, expect 20% CAC reduction within 14 days.”
Handle Performance Drops Like a Pro
When performance declines, most agencies panic. They either hide bad news or overwhelm clients with excuses. Both approaches destroy trust.
Instead, use the ALERT framework:
- Acknowledge the issue immediately and clearly
- Lead with root cause analysis, not excuses
- Explain your action plan with specific timelines
- Review early indicators of recovery
- Track progress transparently
For example: “Conversion rates dropped 18% this week. Our analysis identifies three causes: iOS tracking loss (60% of impact), creative fatigue (30%), and increased competition (10%). We’re setting up server-side tracking (live tomorrow), refreshing creative (tests start Monday), and adjusting bid strategies (complete today). Early indicators show recovery—Facebook CTR improved 12% yesterday.”
This approach turns potential crisis into demonstrated expertise.
Common Pitfalls That Destroy Analytics Programs
Learn from others’ failures to accelerate your success. Here are the most common ways agencies sabotage their analytics efforts, based on hundreds of implementations we’ve analyzed.
The Perfect Data Trap
Many agencies wait for perfect data before they start analytics. They spend months on data cleanup, standardized tracking, and elaborate systems. Meanwhile, competitors who use “good enough” data are stealing their clients.
The dbt Labs report found that 56% of teams cite data quality as their biggest challenge. But perfect data doesn’t exist. Start with 80% accuracy and improve over time.
Focus on decision impact. If your attribution model is 80% accurate but drives 50% better budget allocation, that’s massive value. The cost of waiting for 95% accuracy while you make decisions blindly far exceeds minor data imperfections.
Analysis Without Action
Some agencies produce brilliant analyses that never drive change. They identify opportunities, predict trends, and prescribe actions—then nothing happens. MIT’s research confirms only 20% of insights generate outcomes.
Why? Because they focus on what’s intellectually interesting rather than what’s practically actionable. They analyze aggregate data when clients need channel-specific recommendations. They provide annual predictions when clients make monthly decisions.
Align your analysis cadence with client decision cycles. If they adjust budgets weekly, provide weekly optimization recommendations. If they plan campaigns quarterly, deliver quarterly strategic analyses. Match your insights to their ability to act.
Tool Obsession Syndrome
“If only we had [insert expensive tool], we could do real analytics.” This thinking kills more analytics programs than any technical challenge.
Tools amplify capabilities—they don’t create them. An analyst who understands statistics and business can generate powerful insights with Excel. Someone who doesn’t understand either will just create prettier meaningless charts with Tableau.
Invest in people and processes first. Train your team on statistical thinking, business analysis, and data storytelling. Once they’re proficient with basic tools, then consider upgrades. Most agencies never need enterprise-level solutions.
The Complexity Trap
As agencies develop analytical capabilities, they often make things unnecessarily complex. They build elaborate attribution models that require PhD-level statistics to understand. They create 47-variable predictive models that no one trusts.
The goal isn’t analytical sophistication—it’s business impact. A simple analysis that drives million-dollar decisions beats a complex model that sits unused. Start simple, prove value, then gradually increase sophistication as clients develop analytical maturity.
The Bottom Line
Here’s what this all means for your agency.
The fundamental difference is simple: Reporting shows the data, analytics understands the data. You need both, but most agencies stop at showing what happened instead of explaining why it happened and what to do next.
Right now, you’re probably wasting 15-20 hours per client on manual reporting. Swydo automates this for under $100/month, freeing up those hours for actual analysis that clients will pay premiums for.
The agencies charging 50% more aren’t smarter—they just answer different questions. While you show what happened, they explain why and prescribe solutions.
Start with one client tomorrow. Pick their biggest problem. Spend 4 hours analyzing the data behind it. Present three specific actions with expected outcomes. Watch their reaction when you solve their problem instead of just confirming it exists.
Your transformation starts with automating reports through Swydo, then building analytical frameworks, then raising prices 30%. Agencies following this path see 40-50% time savings and double their client retention.
Pick one client. Solve one problem. Charge accordingly.
Analytics vs Reporting FAQ
Everything agencies need to know about transforming data into strategic insights
Reporting shows what happened – last month’s ad spend, conversion rates, traffic numbers. Analytics explains why it happened, predicts what will happen next, and recommends specific actions to improve performance.
Most agencies confuse prettier reports with better service. They spend 15-20 hours per client monthly organizing data into charts instead of analyzing what the data means. This creates a time trap that burns money without adding client value.
Analytics answers three critical questions: Why did this happen? What will happen next? What should we do about it? For example, why did Google Ads CPA increase, which campaigns will fatigue next month, and what budget changes will optimize performance.
If you’re showing clients their platform data in prettier formats, that’s reporting. If you’re explaining root causes of performance changes and providing specific optimization recommendations with expected outcomes, that’s analytics.
Level 1: Descriptive (what happened) – 14-month client retention. Level 2: Diagnostic (why it happened) – 24-month retention. Level 3: Predictive (what will happen) – 36+ month retention. Level 4: Prescriptive (what to do) – 48+ months, premium pricing.
Start with clear questions, not data exploration. Ask “which audience segments have highest lifetime value?” instead of “what does this data show?” Use basic tools properly before buying expensive software. Most insights come from asking the right questions, not advanced statistics.
Waiting for perfect data. Start with 80% accuracy and improve over time. The cost of making decisions with imperfect data is far less than making blind decisions while waiting for perfect data that doesn’t exist.
90 days for basic transformation: Week 1-4 automate reporting, Week 5-8 build analysis templates, Week 9-12 implement insights and raise prices. Most agencies see immediate time savings and can charge premiums within 3 months.
Connect all data sources to a central platform like Swydo. Eliminate manual CSV downloads and copy-pasting. Automation cuts reporting time by 65%, freeing 10-15 hours monthly per client for actual analysis and strategic work.
Start with attribution analysis (understanding customer journey touchpoints), customer lifetime value tracking (identifying high-value segments), and performance anomaly detection (catching issues early). These three frameworks solve 80% of client optimization needs.
Under $1M revenue: Swydo + Google Analytics + ChatGPT ($69-109/month). $1M-5M: Add Power BI and part-time analyst ($400-600/month). Above $5M: Data warehouse and full-time analyst ($5,000-10,000/month). Start simple, scale systematically.
No. Tools amplify capabilities but don’t create them. An analyst who understands business can generate powerful insights with basic tools. Most agencies generate 80% of enterprise-level insights with properly implemented basic tools.
Swydo is built specifically for agencies, combining automated data collection, white-labeled reports, and real-time dashboards. It cuts reporting time by 65% and works immediately without technical setup, freeing your team for analytical work.
Initial investment of $69-109/month pays for itself within 30 days through time savings alone. The ability to charge 30-50% premiums for analytics services delivers 10x+ ROI on technology investment within 90 days.
Use a data aggregation platform like Swydo that connects to all major marketing platforms automatically. Focus on the 80/20 rule: Google Ads, Facebook Ads, Google Analytics, and your client’s CRM typically provide 80% of decision-making data.
Agencies providing analytics charge 50-100% premiums over reporting-focused competitors. Start with 30% price increases for existing clients, then 50%+ premiums for new clients because you’re solving business problems, not just organizing data.
Focus on business outcomes, not hours or deliverables. Instead of “we analyze more data,” say “we identify why your CAC increased and provide a specific plan to reduce it 20% within 14 days.” Lead with financial impact, not process improvements.
Analytics positions you as a strategic partner, not a vendor. Clients who understand why their marketing performs the way it does, and receive specific optimization recommendations, stay 2-3x longer than those who just get performance reports.
Analytics identifies why costs are increasing, which campaigns will fatigue before they do, which audience segments drive highest lifetime value, and which attribution model most accurately reflects customer behavior. These insights drive budget allocation and strategic decisions.
Start with business impact, provide context, acknowledge uncertainty, and make specific recommendations. Instead of “Facebook performance dropped,” say “Facebook CAC increased 23%, adding $47,000 to acquisition costs. Shift 30% budget to lookalike audiences, expect 20% CAC reduction within 14 days.”
Attribution analysis tracks which marketing touchpoints actually drive conversions throughout the customer journey. This matters because last-click attribution often misallocates budget away from awareness channels that initiate conversions but don’t get credit for final clicks.
Track cohorts over time by connecting ad platforms to your client’s CRM or e-commerce platform. Calculate not just initial conversion value but payback periods and total LTV by channel. This reveals which channels drive long-term value versus quick conversions.
Use the ALERT framework: Acknowledge immediately, Lead with root cause analysis, Explain action plan with timelines, Review early recovery indicators, Track progress transparently. This turns potential crises into demonstrations of analytical expertise.
Predictive analytics forecasts future performance using statistical models. Examples include predicting when campaigns will fatigue, estimating next quarter’s customer acquisition costs, and identifying optimization opportunities before competitors notice them.
Focus on actionable insights over intellectual curiosity. Align analysis cadence with client decision cycles – if they adjust budgets weekly, provide weekly recommendations. If they plan quarterly, deliver quarterly strategic analysis. Match insights to their ability to act.
Expect iOS tracking limitations, cross-platform attribution gaps, delayed conversion reporting, and platform data discrepancies. Build analytical frameworks that account for these limitations rather than waiting for perfect data that doesn’t exist.
Stop burning 15+ hours monthly on manual reports. Turn your agency into an analytics powerhouse.
Start Your Free Trial Today