Skip to

LinkedIn Page Analytics Report

Optimize Your Content Strategy with Our LinkedIn Page Analytics Report Template

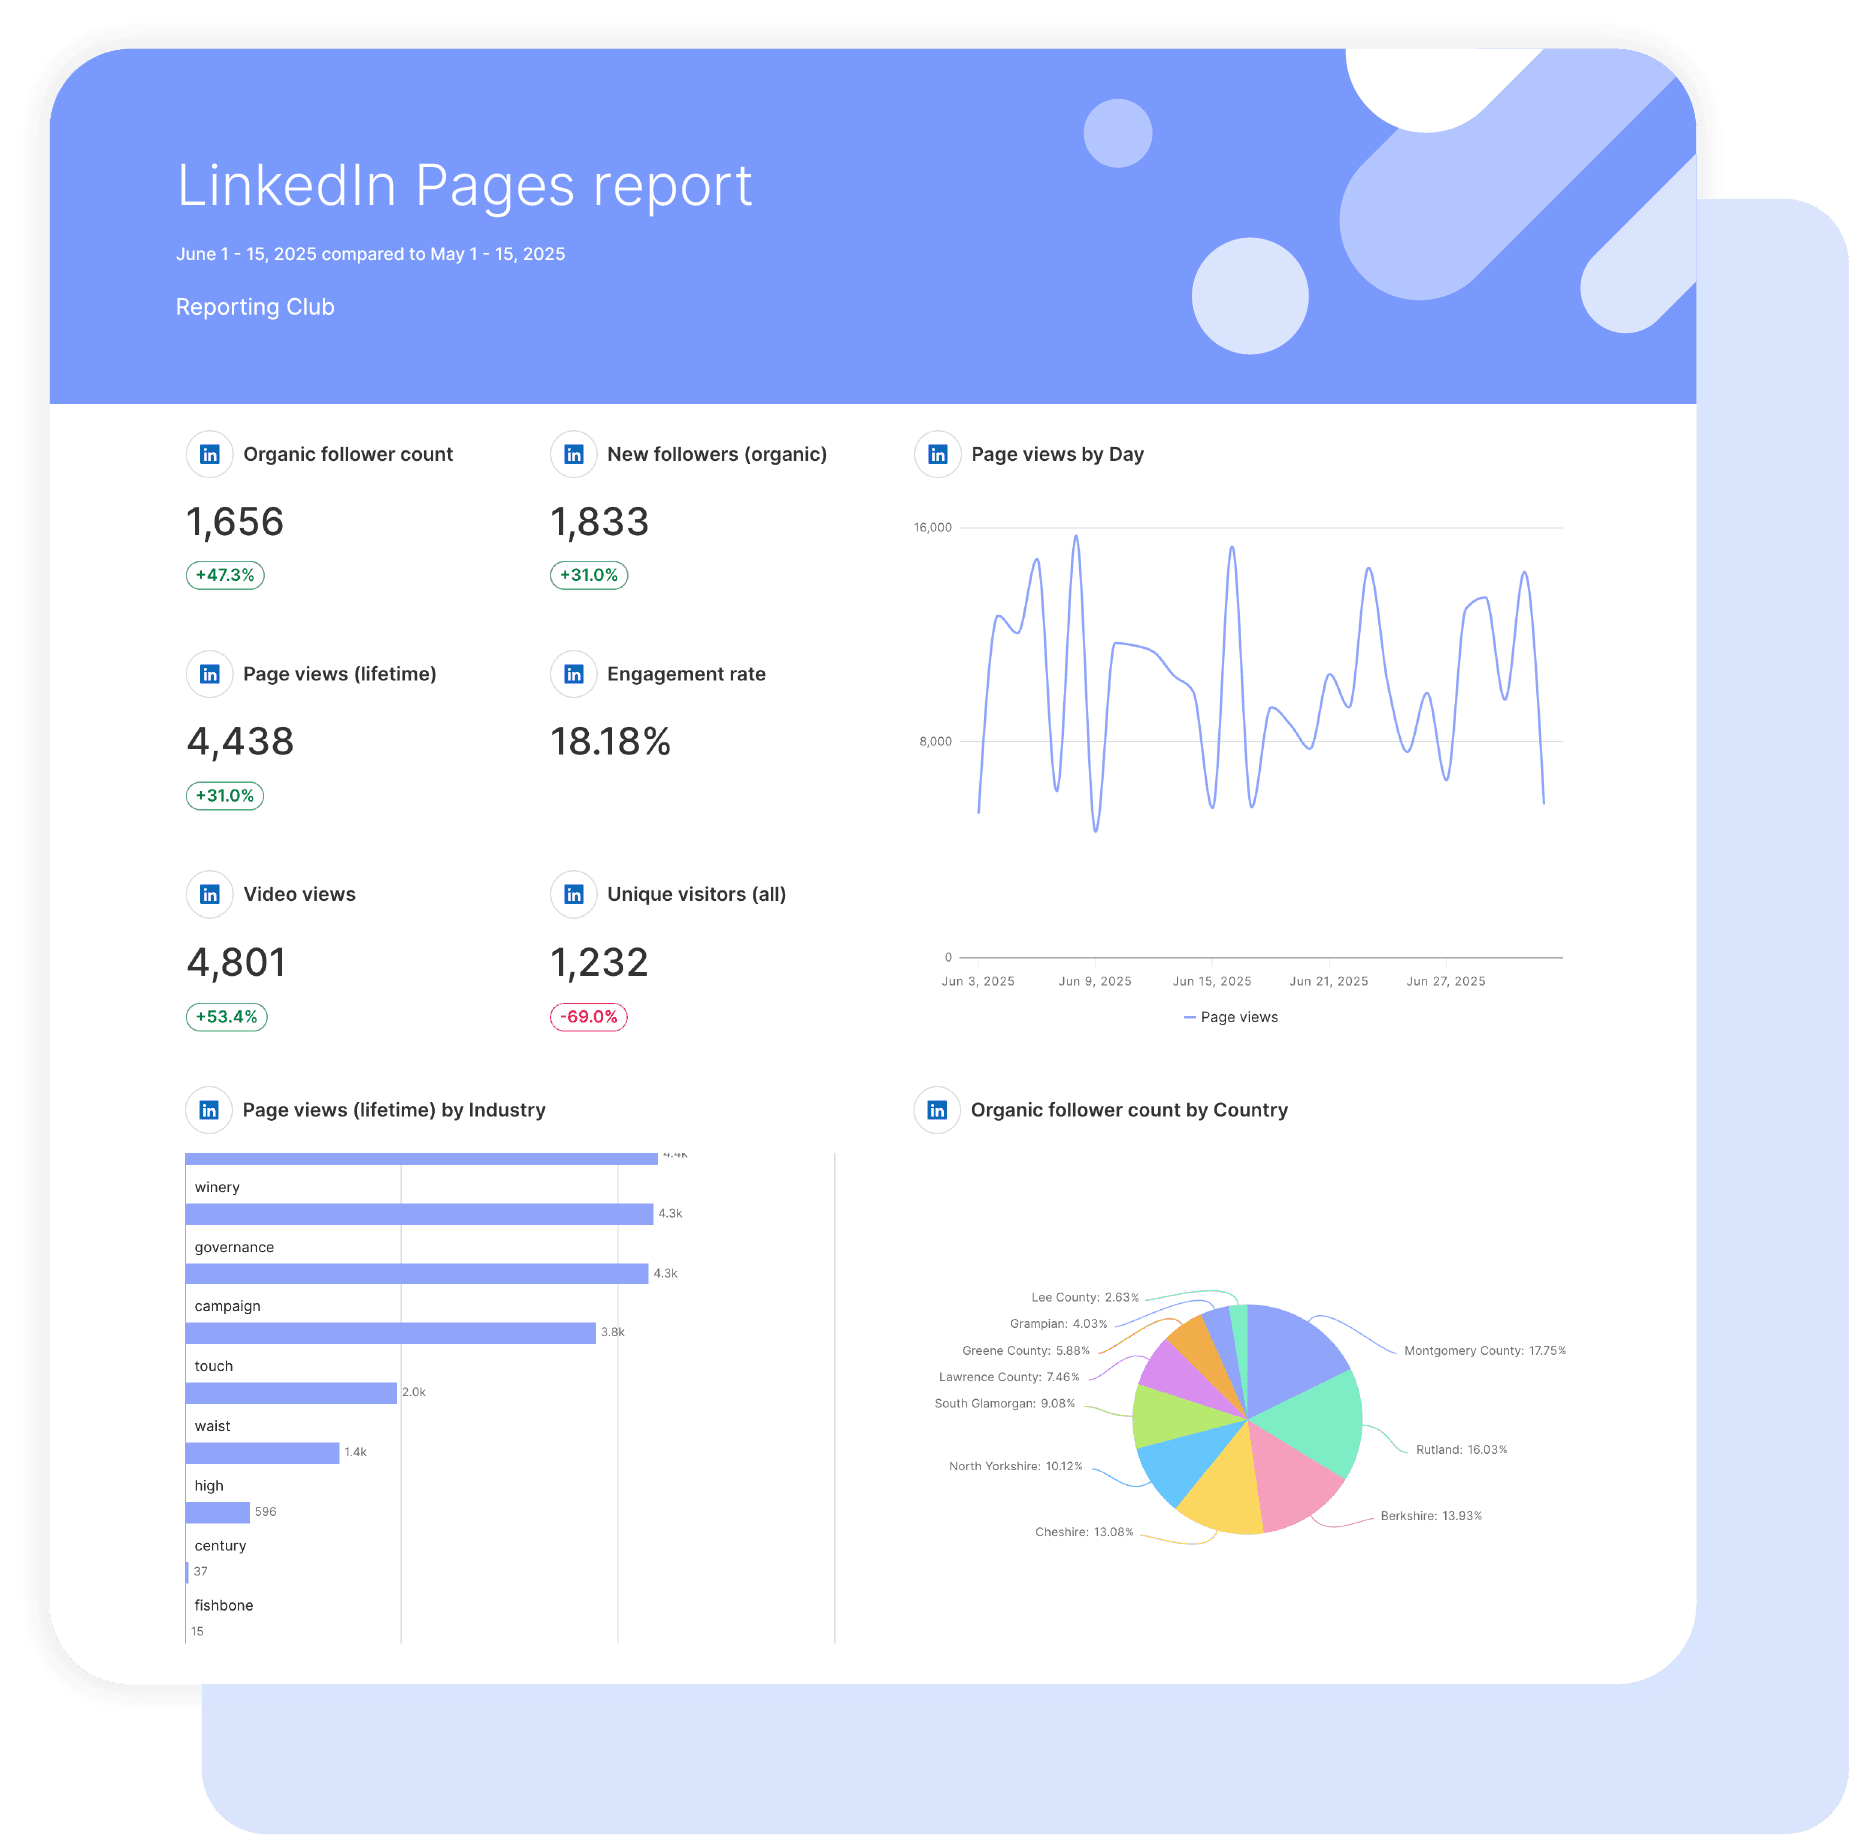
Get the actionable insights you need to optimize your LinkedIn content strategy effectively with Swydo’s customizable LinkedIn Account report template. 

Understand and evaluate the performance and engagement of your LinkedIn page. Maximize engagement and growth by refining content types and engagement techniques. 

Data sources LinkedIn
Get started

Free for 14 days, no credit card required, cancel at any time

LinkedIn Page Analytics Report
How it works
1. Select template

Choose one of our predefined templates or create your own

2. Connect

Connect your data sources

3. Customize

Customize your data to meet your client's needs

4. Share

Schedule and share a dashboard or PDF report with your team or clients

LINKEDIN PAGE ANALYTICS TEMPLATE INSIGHTS

Boost Performance and Engagement

Post Performance
Evaluate engagement metrics for individual posts on your LinkedIn page to get a clear picture of how your content resonates with your audience.

Video View and Time Watched by Video
Track performance metrics specific to video content which is critical for gauging the effectiveness of your videos in engaging viewers.

LINKEDIN PAGE ANALYTICS REPORT KPIS AND METRICS

KPIs Included in Our LinkedIn Template

New Followers
Assess the appeal of your content by monitoring the growth in users who have started following your LinkedIn page.

Click Count
Examine the audience engagement and interest in your posts on your LinkedIn page.

Like Count
Measure how well your content is received by your audience by tracking the number of likes each post receives.

Video View
Determine how effectively your videos capture attention on LinkedIn by the total number of views they receive.

Unique Visitors
Gain insight into the reach of your page across the LinkedIn platform by monitoring the number of unique users who visit your page.

CUSTOMIZATION

Customize Your LinkedIn Page Analytics Report

Filters
Leverage a variety of filters to show more specific data points to quickly identify issues and take swift action.

Scheduling
Automate and share your dashboards and reports on a schedule that best meets your needs.

White label
Reflect your brand by incorporating your logo and brand colors into your reports. You can also use your domain to share and send your reports.

Goals
Set and track goals to gain insight into performance, trends and progress toward your goals.

Custom Metric
Combine two metrics from the same data source to calculate an entirely new custom metric.

Multi-language reports
Create reports for your clients in 14 available languages through our automatic and editable translation feature.

Report Design
Resizable widgets allow you to adjust the presentation of KPIs, charts, tables, text, and images to focus clients on key data and insights.

Text and Images
Provide context to clients or stakeholders through descriptive text widgets. Incorporate images, such as ad assets, to improve client communication and understanding.

Flexible Date Ranges
Easily compare data across different time periods. Fully control the date range of your overall reports or specific KPIs, charts, and tables to highlight trends.

See all features
CUSTOMERS

From small agencies to big enterprises. Swydo helps over 2,000 customers get the job done.

View all customer stories
Example reports

Create and automate your reports in minutes

analytics reporting

Linkedin Revenue Attribution Report

View details
analytics reporting

Google Ads Report

View details
analytics reporting

Facebook Ads Report

View details

Create your free online marketing report in minutes

Free for 14 days, no credit card required, cancel at any time

Request a demo Get started