
Monday morning hits and you’re copying data from Google Analytics, then Facebook Ads, then Google Ads. Come Wednesday, you’re still not done with last week’s reports.
This is exactly what marketing reporting tools were built to fix. Think of them like your marketing command center. Just like a pilot needs all their instruments in one place, you need all your data flowing into one dashboard to make smart decisions.
Report Garden used to be a solid choice for this. But things have changed pretty dramatically in 2025. Users are jumping ship for better reliability, smarter features, and support that actually responds when you need help.
Whether you’re dealing with wonky data, looking for more advanced analytics, or just want something that works better, this guide walks you through what’s actually worth your time right now.
Why Businesses Are Moving Away from Report Garden
Let’s be honest about what’s happening with Report Garden. The marketing world has gotten more complex, and some tools just haven’t kept up.
Data accuracy issues top most people’s complaint lists. When you’re making budget decisions based on reports, even small errors hurt. The survey from Harvard Business Review revealed that 91% of respondents agree that democratizing access to data and analytics is important to the success of their organizations. Furthermore, 58% of respondents increased their investment in AI initiatives. If your reporting tool can’t spot anomalies or predict trends, you’re basically flying blind.
Scalability hits a wall as you grow. Maybe you started with 5 clients, but now you have 25. Report Garden starts choking on the data volume, and suddenly you’re shopping for a new platform right when you need stability most.
Support quality has gotten worse. Response times stretch longer, and the help you get feels less knowledgeable. When your reports break on a Friday afternoon, you need someone who actually knows what they’re doing.
Essential Features to Look for in Today’s Reporting Tools
The game has changed completely since Report Garden first launched. Here’s what actually matters now.
Advanced Data Integration Capabilities
Today’s businesses use about 91 different marketing tools on average. Crazy, right? Your reporting platform needs to connect with all of them without requiring a computer science degree.
What should you look for?
Pre-built connectors for the platforms you actually use. Google Analytics, Facebook Ads, LinkedIn – the basics should just work out of the box.
API flexibility for those weird tools your team loves but nobody else has heard of.
Data transformation that cleans up messy information automatically. Nobody has time to manually fix data formatting issues.
Real-time sync instead of waiting until tomorrow to see today’s performance.
AI-Powered Insights and Automation
This isn’t just marketing hype anymore. The best tools don’t just show you data – they help you understand what it means.
Essential AI features include automated anomaly detection that alerts you when something weird happens. Maybe your conversion rate dropped 40% overnight. You want to know immediately, not next Monday.
Predictive analytics forecast what’s coming next. If you can see a trend developing, you can do something about it.
Natural language insights translate data into plain English. Instead of staring at charts wondering what they mean, the platform just tells you.
Intelligent recommendations suggest what you should actually do about the trends you’re seeing.
Customization and White-Labeling Options
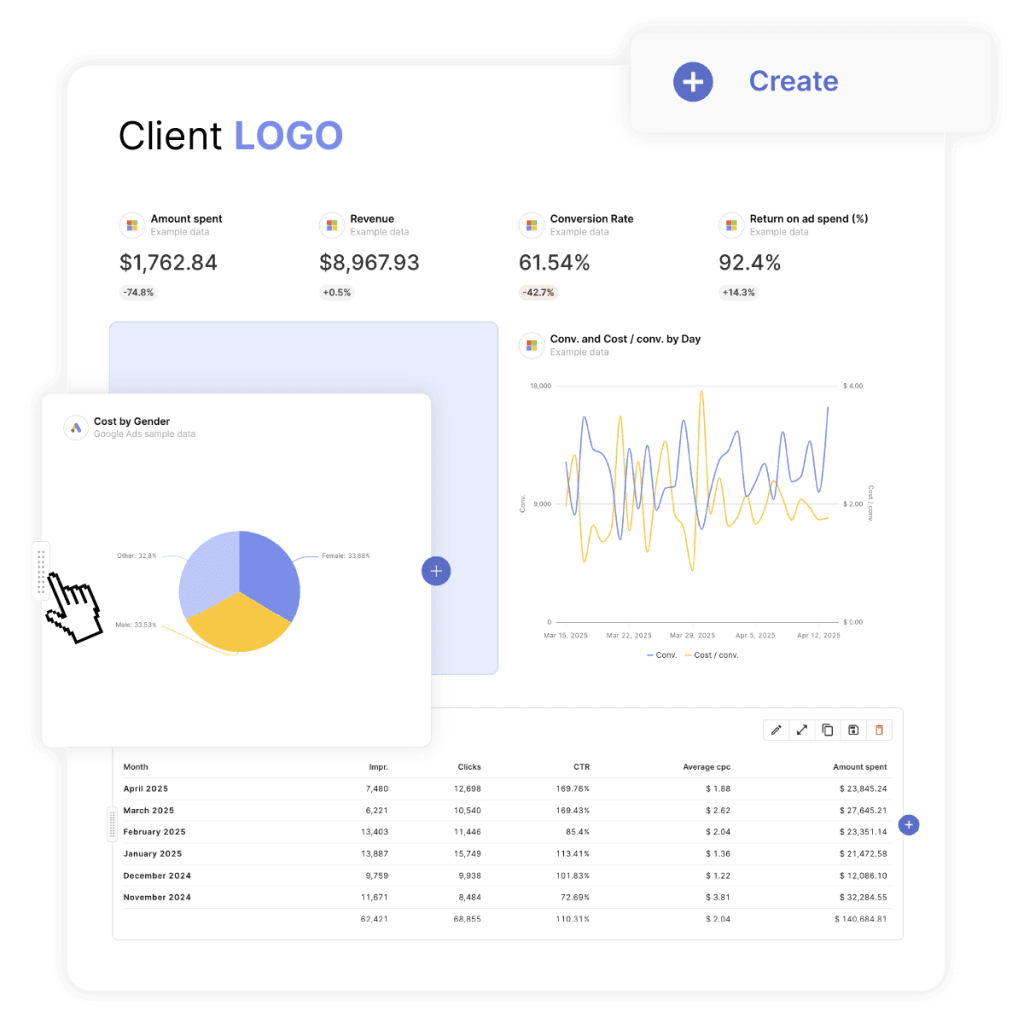
Whether you’re presenting to clients or executives, looking professional matters. But this goes deeper than just slapping your logo on a template.
Complete brand customization means everything matches your brand colors, fonts, and style. Not just the header.
Client portal access lets agencies give clients their own login to explore data independently.
Automated report delivery handles the scheduling so you’re not manually sending PDFs every week.
Interactive dashboards let stakeholders dig into the data themselves instead of bothering you with questions.
Top Report Garden Alternatives – A Detailed Analysis
Let’s get into the actual alternatives. Each has distinct strengths depending on what you need.
Swydo – The Flexible Choice
Swydo is an automated marketing reporting tool that takes a different approach with per-data-source pricing. Starting at $69 monthly for 10 data sources, additional sources cost $4.90-2.00 each. This makes scaling more predictable.
Key Strengths
- Flexible pricing model that scales with actual usage, not arbitrary user limits.
- Swydo AI assistant for generating insights
- Strong automation features for report generation and delivery.
- Comprehensive white label report template library covers most industry needs out of the box.
- Advanced collaboration tools for team-based reporting workflows.
- Combine data sources (blended date)
- Monitor all your clients important KPIs with Monitoring Overview
Best For Growing businesses with changing data needs, teams requiring strong collaboration, and organizations wanting predictable scaling costs.
AgencyAnalytics – The All-in-One Platform
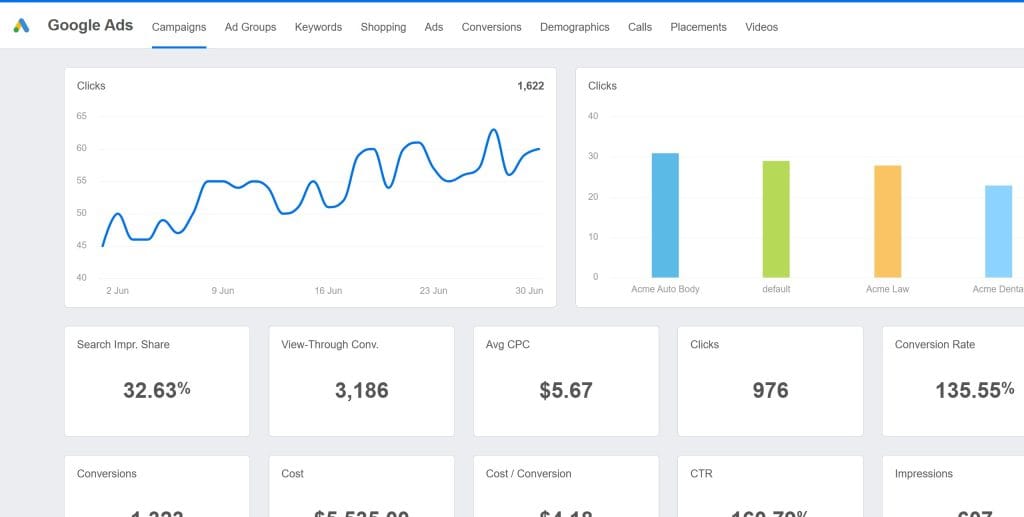
AgencyAnalytics has become the go-to choice for marketing agencies, especially if SEO is a big part of what you do. What makes it different is how it combines comprehensive reporting with actual SEO tools built right in.
Key Strengths
- Built-in SEO tools include rank tracking, site audits, and backlink monitoring. You don’t need separate subscriptions for basic SEO work.
- White-label everything so clients see your brand, not AgencyAnalytics.
- 80+ native integrations cover pretty much every platform you’d want to track.
- Automated client reporting with templates that actually look professional without hours of customization.
Pricing Structure AgencyAnalytics has always updated their pricing structure due to their evolving platform. Their pricing is:
- Freelancer: $59 monthly (billed annually) – includes 5 clients
- Agency: $179 monthly (billed annually) – includes 5 clients
- Agency Pro: $349 monthly (billed annually) – includes 5 clients
- Additional clients: $20 per month each
Best For SEO agencies, small to medium marketing agencies, and businesses wanting comprehensive reporting with built-in optimization tools.
Microsoft Power BI – Enterprise-Grade Analytics
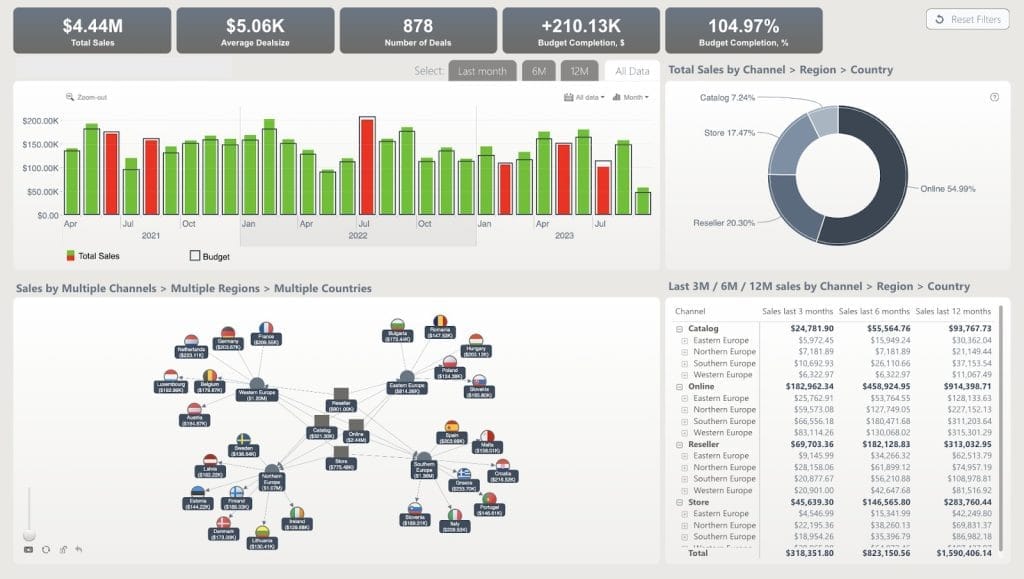
Power BI got serious upgrades in 2025, along with major pricing changes. Pro licenses jumped from $10 to $14 monthly – a 40% increase. Premium Per User plans went from $20 to $24 monthly.
Key Strengths
- Deep Microsoft integration with Office 365, Teams, and Azure. If you’re already in the Microsoft ecosystem, everything just works together.
- Advanced AI capabilities through Microsoft’s Copilot integration. It’s like having a data analyst built into your reporting tool.
- Enterprise security features that meet strict compliance requirements. Your IT department will actually approve this one.
- Massive data handling suitable for Fortune 500 companies with tons of data sources.
Pricing Structure
- Pro: $14 per user per month
- Premium Per User: $24 per user per month
- Premium Per Capacity: Starting at $5,000 monthly for dedicated resources
Best For Large enterprises using Microsoft tools, organizations with complex data needs, and businesses requiring enterprise-grade security.
Tableau – The Visualization Leader
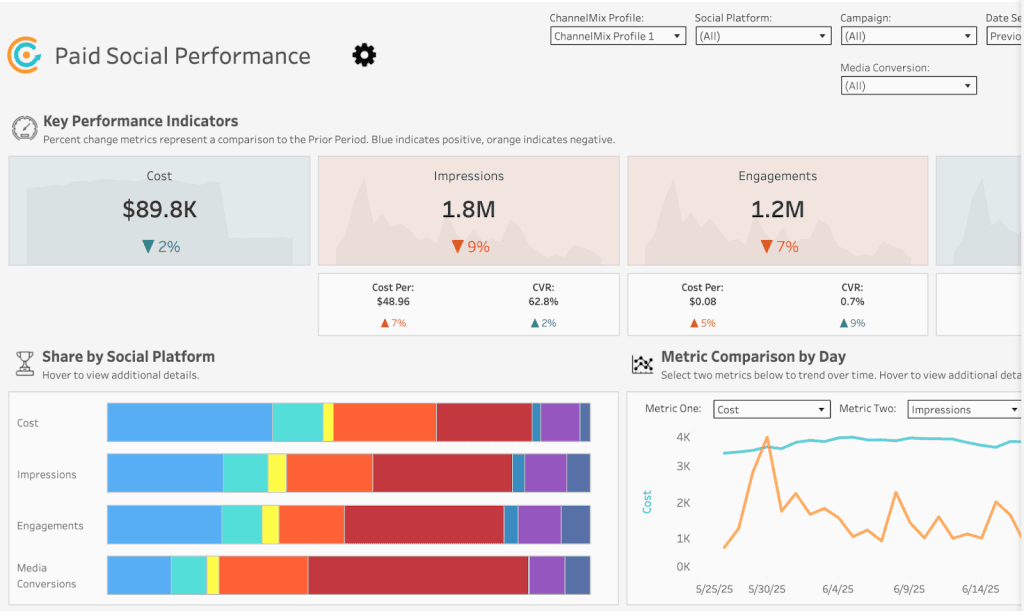
Tableau dominates advanced analytics. Recent pricing updates reflect continued demand and enhanced AI features.
Key Strengths
- Unmatched visualization capabilities with an intuitive drag-and-drop interface. If you need beautiful, complex charts, Tableau is still king.
- Einstein AI integration for predictive analytics and automated insights. The AI actually understands your data context.
- Massive data source support handles virtually any data format you throw at it.
- Advanced statistical analysis tools that data scientists love.
Pricing Structure
- Creator: $75 per user per month (annual billing)
- Explorer: $42 per user per month
- Viewer: $15 per user per month
- Enterprise editions: $105/$59/$35 respectively
Best For Large organizations with dedicated analytics teams, businesses requiring sophisticated analysis, and companies with complex visualization needs.
Google Looker Studio – The Accessible Option
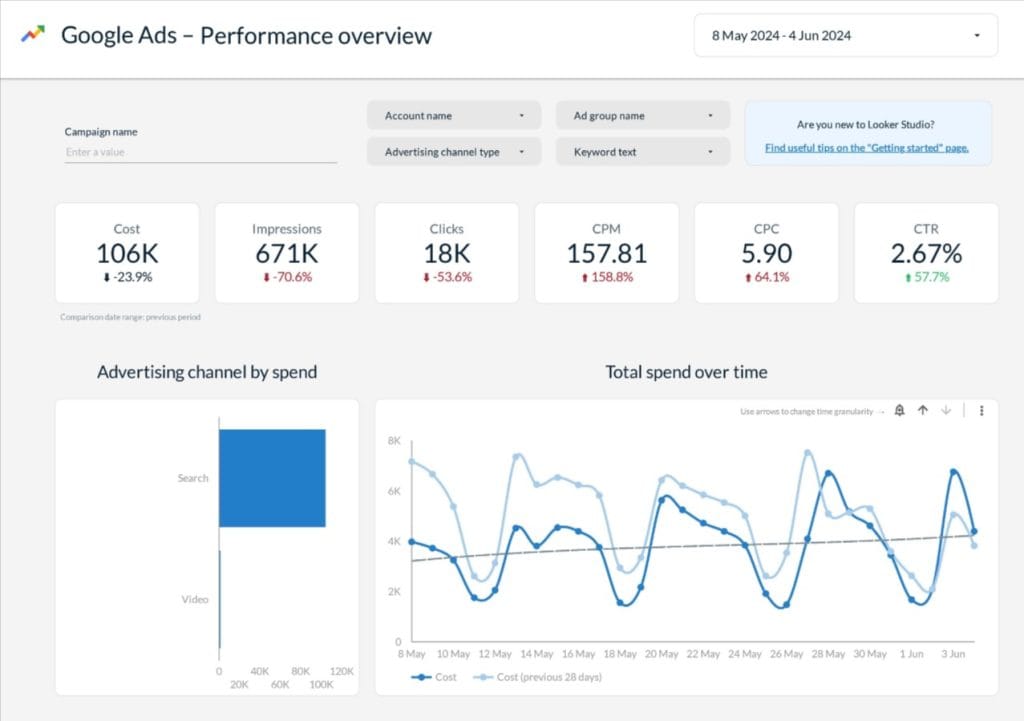
Google Looker Studio remains the most accessible business intelligence platform. Full functionality is completely free for Google data sources, making it incredibly popular with small businesses and startups.
Key Strengths
- Completely free for Google data sources like Analytics, Ads, and Sheets. Hard to beat that price point.
- Intuitive interface that non-technical people can actually use without training.
- Seamless Google integration with automatic data refresh. No setup headaches.
- Collaborative features built into Google Workspace. Your team already knows how to share and collaborate.
Pricing Structure
- Free for Google data sources
- Pro version: $9 per user per month per project
- Third-party connectors: $20-350 monthly per connector
Best For Small businesses, Google Workspace users, budget-conscious organizations, and teams comfortable with Google’s design.
Whatagraph – The Agency Specialist

Whatagraph built its reputation on reliability and client management features. The platform appeals to agencies that need consistent data connections and professional reporting capabilities.
Agencies generally appreciate the platform’s visual appeal and client management features, though some have noted occasional connection reliability issues that are common across reporting platforms in this space.
Key Strengths
- Managed integrations with focus on reliability and data accuracy.
- Advanced data transformation for complex reporting needs without technical expertise.
- Comprehensive client management with portal access and automated delivery.
- Professional design templates that require minimal customization to look great.
Note: While Whatagraph emphasizes reliability in their marketing, user reviews indicate some agencies have experienced occasional data connection issues, similar to other platforms in this space.
Pricing Structure Whatagraph no longer displays pricing publicly on their website, requiring sales conversations for quotes. Based on recently available information from early 2025, their pricing structure was:
- Start Plan: $229/month (billed annually) – includes 20 data sources and 5 users
- Boost: $579/month (billed annually) – includes 60 data sources and 10 users
- Custom: Enterprise pricing for 100+ data sources and unlimited users
Note: Since pricing is no longer public, current rates may differ and require contacting their sales team directly.
Best For Medium to large agencies, businesses requiring consistent uptime, and organizations with complex multi-client reporting needs.
TapClicks – The All-in-One Platform
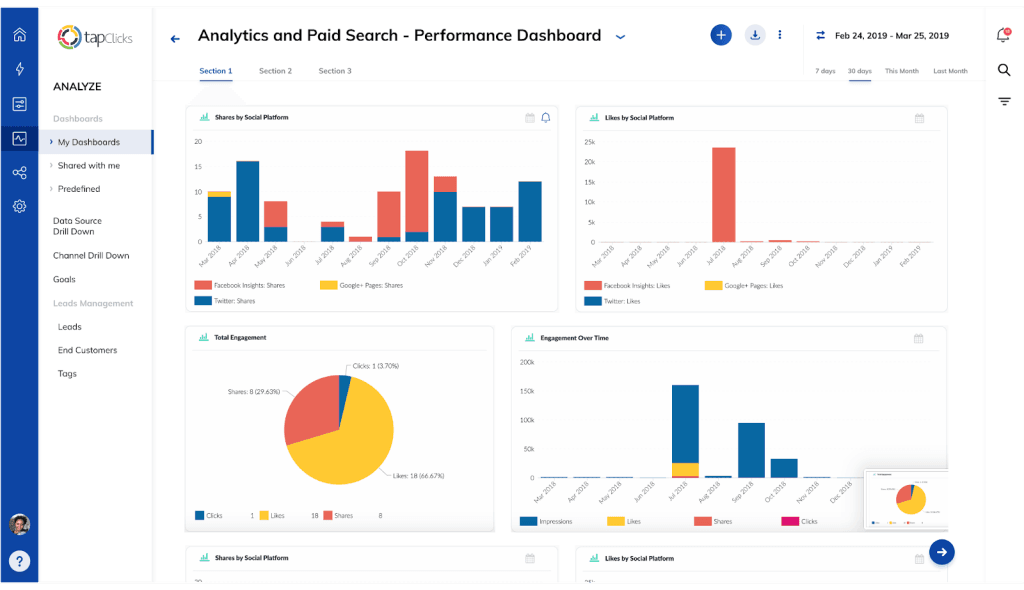
TapClicks positions itself as a comprehensive marketing operations platform, combining reporting with campaign management and business intelligence. However, user reviews show mixed experiences with data accuracy and implementation complexity.
Key Strengths
- 250+ data source integrations cover virtually every marketing platform you’ve heard of and many you haven’t.
- Campaign management tools go beyond just reporting. You can actually optimize campaigns from within the platform.
- AI-powered insights and optimization recommendations.
- Enterprise-scale infrastructure handles large data volumes without choking.
Pricing Structure TapClicks has updated their pricing for 2025 with a two-part structure:
- TapDataLite: Starting at $99/month (includes basic data connectors)
- Standard plan: $499/month for comprehensive features
- Pro plan: $999/month with advanced capabilities
- Elite plan: Custom pricing for enterprise needs
Note that TapClicks requires both a data plan and destination plan, so actual costs typically range from $500-1,400+ monthly depending on requirements.
Best For Large agencies with complex needs, organizations wanting integrated campaign management, and businesses with dedicated technical resources.
Pricing Analysis and Total Cost of Ownership
Monthly subscription fees are just the beginning. Here’s what you’re really paying for.
Subscription Cost Comparison
| Platform | Entry Price | Mid-Tier | Enterprise | Annual Discount |
|---|---|---|---|---|
| AgencyAnalytics | $59/month (5 clients) | $179/month (5 clients) | $349/month (5 clients) | 20% |
| Power BI | $14/user | $24/user | $5,000/month | 16% |
| Tableau | $75/user | $105/user | Custom | 20% |
| Looker Studio | Free | $9/user/project | Custom | N/A |
| Whatagraph | ~$223/month* | ~$335/month* | Custom* | Unknown |
| Swydo | $49/10 sources | Additional sources $1.50-3.50 each | Custom | N/A |
| TapClicks | $499/month | $999/month | Custom | N/A |
Hidden Costs to Consider
Setup and implementation time represents about 25% of your first-year costs. Even “easy” platforms require significant time investment for proper setup and team training.
Third-party connector fees can make “free” platforms expensive fast. Google Looker Studio’s third-party connectors range from $20-350 monthly each. Suddenly that free tool costs more than premium alternatives.
Training and certification costs vary dramatically. Simple tools like DashThis need minimal training. Enterprise platforms like Tableau often benefit from formal certification programs costing $2,000-5,000 per person.
Opportunity costs from delayed implementation or poor adoption often dwarf subscription fees. Factor in the cost of continued manual reporting when evaluating options.
Make Your Final Decision
Selecting the right Report Garden alternative requires matching platform capabilities to your agency size, client needs, and growth trajectory.
For Small Agencies (1-10 employees)
Recommendation: AgencyAnalytics or Swydo
Focus on ease of use and quick implementation. Choose core integrations over comprehensive coverage. Make sure white-labeling capabilities meet your client presentation standards. Budget for 1-2 weeks implementation time.
For Medium Agencies (10-50 employees)
Recommendation: Swydo or AgencyAnalytics Premium
Invest in reliability and uptime guarantees. Advanced client management features become essential. Plan for dedicated platform administration and consider professional services support. Budget 4-6 weeks for full implementation.
For Large Agencies (50+ employees)
Recommendation: Tableau, Power BI, or TapClicks
Focus on scalability and enterprise security. Plan for extended implementation timelines with dedicated technical resources. Invest in formal training and certification programs. Make sure integration with existing agency management systems works properly.
For Budget-Conscious Agencies
Recommendation: Google Looker Studio or Swydo
Leverage free Google ecosystem integrations where possible. Plan for technical setup requirements and potential learning curves. Budget for third-party connector costs as client needs grow. Consider upgrading as agency revenue increases.
Get Started with Your New Platform
Once you’ve picked your Report Garden alternative, follow these steps for successful implementation:
- Conduct a thorough data audit to understand current requirements and identify gaps
- Create a migration timeline with realistic milestones and buffer time for challenges
- Designate platform champions who become expert users and internal training resources
- Start with a pilot implementation using one client or business unit before full rollout
- Establish governance processes for data access, report approval, and platform maintenance
- Plan ongoing optimization with monthly reviews and continuous improvement
The best reporting platform is the one your agency team will actually use consistently. Focus on user experience and training support alongside advanced features, and you’ll be positioned to make data-driven decisions that drive client results and agency growth.
What matters most is finding something that works for your specific agency situation and team. Take the time to test a few options, involve your team in the decision, and don’t be afraid to start small and scale up as you get comfortable with the new platform and add more clients.
Best Report Garden Alternatives FAQ
Quick answers to help you choose the right marketing reporting platform
AgencyAnalytics is the best overall alternative, starting at $59/month with built-in SEO tools, 80+ integrations, and comprehensive white-labeling. For flexible pricing, Swydo offers per-data-source pricing from $69/month. Budget-conscious users should consider Google Looker Studio (free for Google sources) or Swydo’s scalable model.
Google Looker Studio is completely free for Google data sources (Analytics, Ads, Sheets) with unlimited reports and users. However, third-party connectors cost $20-350/month each. It works best for small businesses using primarily Google tools, though it lacks advanced client management and white-labeling features that agencies need.
Most marketing agencies use AgencyAnalytics, Swydo, or Whatagraph because they’re built specifically for agencies with client management features, white-labeling, and automated report delivery. SEO-focused agencies prefer AgencyAnalytics for built-in rank tracking and site audits. Agencies managing many data sources often choose Swydo for flexible per-source pricing.
Swydo offers more reliable data connections, better automation features, and flexible per-data-source pricing ($69 for 10 sources) that scales predictably. It includes an AI assistant for generating insights, blended data capabilities, and comprehensive white-label templates. Users report fewer data accuracy issues compared to Report Garden’s recent reliability problems.
“Better” depends on your needs. Tableau ($75/user/month) offers superior data visualization for complex analysis. Power BI provides better Microsoft integration for enterprises. Swydo works better if you need flexible per-source pricing instead of per-client. However, for most marketing agencies, AgencyAnalytics offers the best balance of features, ease of use, and value at $59-349/month.
Focus on three key factors: 1) Integration support for your specific platforms (Google Analytics, Facebook Ads, etc.), 2) Pricing model that fits your scaling needs (per-client vs. per-user vs. per-data-source), and 3) White-labeling quality if you present to clients. Test 2-3 options with free trials before committing, focusing on data accuracy and ease of use.
Google Looker Studio (free) works best if you primarily use Google tools. For growing businesses needing more capabilities, AgencyAnalytics at $59/month provides professional features without overwhelming complexity. Implementation takes 1-2 weeks, and the interface is intuitive enough that non-technical team members can create reports without extensive training.
Use a reporting tool unless you have dedicated development resources and highly unique needs. Pre-built tools like AgencyAnalytics or Swydo offer 80-250+ integrations that would take months to build manually, plus they handle API updates automatically. Custom dashboards make sense only for large enterprises with specialized requirements that commercial tools can’t address.
Agencies with 50+ employees or those serving Fortune 500 clients benefit from enterprise tools. Power BI ($14-24/user/month) makes sense for Microsoft-heavy organizations. Tableau ($75+/user/month) suits agencies needing advanced statistical analysis or complex custom visualizations. Smaller agencies (under 50 employees) typically get better value and faster results from specialized tools like AgencyAnalytics or Swydo.
Yes. Most platforms pull fresh data from your connected sources (Google Analytics, Facebook Ads, etc.), so historical data remains accessible through those original platforms. Plan a 2-4 week parallel period running both old and new platforms to validate data accuracy. Export any custom reports or configurations you want to preserve before canceling your old subscription.
Agency-focused tools range from $59-579/month depending on client count and features. AgencyAnalytics starts at $59/month for 5 clients ($20 per additional client). Swydo begins at $69/month for 10 data sources. Enterprise tools like Tableau ($75/user/month) and Power BI ($14-24/user/month) cost more but offer advanced capabilities. Budget 25% more for setup, training, and potential connector fees.
Third-party connector fees ($20-350/month each) quickly add up, especially with “free” platforms like Looker Studio. Setup and implementation consume 25% of first-year costs through team time. Training costs vary—simple tools need minimal training while enterprise platforms may require $2,000-5,000 certification programs. The biggest hidden cost is opportunity cost from delayed implementation or poor adoption.
Per-client pricing (AgencyAnalytics: $20/client) scales with revenue since more clients typically means more income. Per-user pricing (Power BI: $14-24/user) works better for organizations with many internal users but few large clients. Per-data-source pricing (Swydo: starting at $69 for 10 sources) offers flexibility when clients have varying integration needs. Choose based on your primary scaling factor.
Most offer 14-30 day free trials. AgencyAnalytics provides 14 days, Tableau offers 14 days, and Power BI has a 60-day trial. Google Looker Studio is permanently free for Google data sources. Always test with real client data during trials to verify data accuracy, ease of use, and that key integrations work properly before committing to annual subscriptions.
Essential integrations include Google Analytics (website traffic), Google Ads and Facebook Ads (paid advertising), and major social platforms your clients use. SEO agencies need rank tracking and backlink tools. Ecommerce agencies require Shopify, WooCommerce, or similar platform connectors. Verify your specific platforms are supported—having 250+ integrations doesn’t help if yours aren’t included or don’t work reliably.
AI features have become genuinely useful. Automated anomaly detection alerts you immediately when metrics drop significantly (like 40% conversion rate decline overnight), preventing costly issues. Predictive analytics forecast trends so you can adjust strategies proactively. Natural language insights explain data in plain English for non-technical stakeholders. However, AI quality varies—test thoroughly during trials as poor AI creates confusion.
White-labeling lets you brand reports and dashboards with your company logo, colors, and domain instead of the tool’s branding. This makes reports appear to come directly from your agency, not a third-party platform. Look for complete customization (not just logo placement), custom email domains for automated delivery, and branded client portal URLs. Essential for agencies but less important for internal business use.
Analytics tools (like Google Analytics) collect and store data from your website or campaigns. Reporting tools pull data from multiple analytics platforms and combine them into unified dashboards and reports. You need both—analytics tools generate the data while reporting tools like AgencyAnalytics or Swydo organize it into client-ready presentations and track performance across all your marketing channels.
Yes, agency-focused tools like AgencyAnalytics, Swydo, and Whatagraph are specifically designed for multi-client management. They offer client portals (so clients access their own data), separate dashboards per client, automated report scheduling, and client-level permissions. Enterprise tools like Tableau work for multi-client tracking but lack agency-specific features like automated white-labeled report delivery.
Real-time sync matters for paid advertising where you need to catch budget overspend or performance issues immediately. For most other metrics, daily updates are sufficient. Real-time capabilities increase costs and complexity, so prioritize based on your needs. If you manage large ad budgets or time-sensitive campaigns, real-time sync is worth it. For monthly strategic reporting, daily updates work fine.
Simple tools like AgencyAnalytics or Swydo take 1-2 weeks for small agencies (5-10 clients). Medium agencies need 4-6 weeks for comprehensive setup including client migration and team training. Enterprise platforms like Tableau require 2-3 months for large organizations. Start with a pilot using one client before full rollout to identify issues early and refine your process.
Agency-focused tools like AgencyAnalytics and Swydo are designed for non-technical users and can be learned in a few days. They offer pre-built templates and drag-and-drop interfaces. Enterprise tools like Tableau have steeper learning curves—plan on weeks of training and potentially formal certification. Google Looker Studio falls in between, easy for basic reports but requiring more skill for advanced customization.
Yes, all modern reporting tools offer automated report delivery. Set up weekly, monthly, or custom schedules to email PDF or live dashboard links to clients automatically. Most tools let you customize what each recipient sees, add personalized messages, and choose delivery times. This eliminates manual report generation and ensures clients receive updates consistently without your team remembering to send them.
Start by documenting all current integrations, custom reports, and client configurations. Choose 2-3 pilot clients to migrate first rather than switching everyone simultaneously. Run both platforms in parallel for 2-4 weeks to validate data accuracy. Most platforms pull fresh data from original sources, so you won’t lose historical data. Expect the full migration process to take 4-8 weeks depending on client count.
Involve team members in platform selection from the start—people support what they help create. Provide role-specific training (account managers need different skills than analysts). Create internal documentation with screenshots for common tasks. Address frustrations quickly with weekly check-ins during the first month. Choose tools with intuitive interfaces like AgencyAnalytics over complex platforms like Tableau if your team isn’t highly technical.
Most tools offer 80-250+ pre-built connectors for common platforms. For unusual data sources, look for API flexibility or custom connector options. AgencyAnalytics has 80+ native integrations, TapClicks offers 250+, while enterprise tools like Tableau can connect to virtually any data format but require more technical setup. Always verify your specific platforms are supported before committing to a tool.
Data accuracy issues typically stem from integration problems, incorrect setup, or source platform changes. Check that connections are authorized and up-to-date first. Compare platform data with original sources (like Google Analytics directly) to identify where discrepancies occur. Quality tools offer reliable support—response time matters when Friday afternoon reports break. This is why many agencies left Report Garden for tools with better support and reliability.
See why agencies choose Swydo over Report Garden for reliable marketing reporting.
Start Your Free Trial Today