
Swydo Is the Most Cost-Effective Whatagraph Alternative for Agencies That Need White-Label Reporting Without Paying Premium Prices. It starts at $69/month with all features included on every plan, no exceptions. AgencyAnalytics is the better pick if you need 80+ integrations and a fully branded mobile app for your clients. Databox wins if AI-driven analysis is your priority. DashThis works best for small teams that want polished dashboards fast. The right answer depends on what you actually need, and that’s what this article is here to help you figure out.
Whatagraph is a solid product. We’re not here to argue otherwise. But it just became the most expensive option in this entire comparison, and it packs in features many agencies will never use. If that’s been on your mind lately, this article is for you.
So let’s get into it.
What Whatagraph Actually Costs in 2026
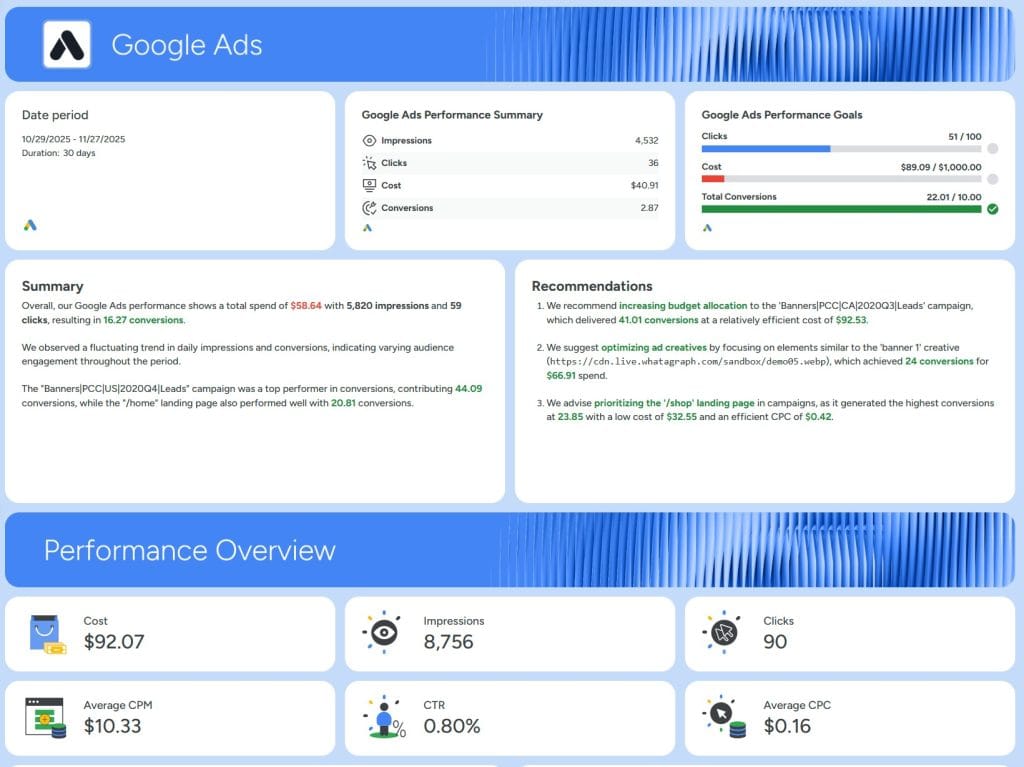
Whatagraph restructured its pricing again in mid-2026. The old four-tier lineup (Free, Start, Boost, Max) is gone. What’s live on whatagraph.com/pricing today is a two-plan structure, and only one of those plans has a published price:
| Plan | Annual ($/mo) | Source Credits | Key Inclusions |
|---|---|---|---|
| Max | $812 | 50+ | White-label, IQ, data blends, KPI alerts, dedicated CSM |
| Prime | Custom | 100+ | Everything in Max, plus premium integrations, Looker Studio transfer, SAML/SSO, tailored onboarding, priority support, Enterprise SLA |
A few things worth knowing. Max is billed annually only. There’s no monthly option anymore. It’s also the cheapest plan with a public price, and it already includes white-labeling by default, which is new; that used to be a separate, cheaper Boost tier. There’s no forever-free plan either. Instead, sign-up gets you a 14-day free trial of Max, no credit card required, and you pick a plan (or move to a custom Prime quote) when it ends.
Prime isn’t a flat upgrade either. Custom report domain, Public API access, and BigQuery transfer are all listed as paid add-ons on top of Prime’s custom price, not included features. The only genuinely bundled step up is Looker Studio transfer, SAML/SSO, and premium integrations. If your agency needs BigQuery piping or a public API, budget for that as a separate line item on top of whatever Prime quote you get.
Whatagraph IQ is genuinely impressive. AI-generated summaries in 18 languages, IQ Chat that lets your clients ask questions of their own report on a shared link, self-healing widgets that fix themselves when integrations hiccup. If those features matter to your agency, Whatagraph earns its price tag.
But what if they don’t?
Why Agencies Look for Alternatives
The reasons are usually some mix of three things. Cost. Integration gaps. Or features they’re paying for but never use.
The cost piece is straightforward. Whatagraph’s Max plan, now the only tier with a published price, runs $812/month on annual billing. That’s roughly $9,744/year before you add a single overage credit, and there’s no monthly billing option to soften the upfront commitment. For an agency with five clients, that’s a real number. For a freelancer, it’s a non-starter.
There’s also the AI-everything direction. Some agencies love it. Others want a tool that just builds a report, sends it to the client, and doesn’t try to be a chatbot. Both preferences are valid. Whatagraph leans hard into the first. Either way, becoming a data-driven marketing agency means picking tools that fit how your team actually works, not the other way around.
So which alternative fits which situation? Let’s go through them.
Quick Comparison
Before the deep dives, here’s how the main options stack up on the things that matter most:
| Swydo | AgencyAnalytics | Databox | DashThis | Whatagraph | |
|---|---|---|---|---|---|
| Starting price | $69/mo | $25/mo ($20 annual) per client | $159/mo annual | $54/mo annual | $812/mo annual |
| White-label included? | Yes, every plan | Yes, every plan | Add-on or Premium | Pro+ | Yes, on Max |
| Integrations | 30+ | 80+ | 130+ | 30+ | 62 |
| Free trial | 14 days, no card | 14 days, no card | 14 days, no card | 14 days | 14-day Max trial, no card |
| G2 rating | 4.6/5 (111) | 4.7/5 (~432) | 4.4/5 (194) | 4.7/5 (83) | 4.5/5 (278) |
| Best for | Agencies wanting transparent pricing | Agencies needing branded mobile portals | AI-driven analysis | Small teams, fast dashboards | Premium AI features at scale |
Now the details.
1. Swydo – The All-in-One Pick for Agencies That Hate Pricing Surprises
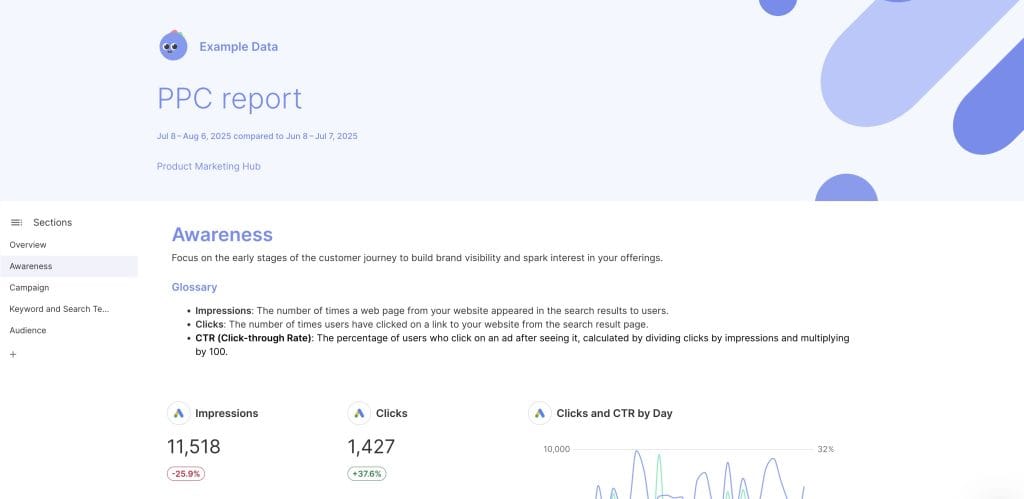
Swydo solves a specific problem: you want white-label reporting, you want it now, and you don’t want to read a pricing page three times to figure out what your bill will be.
The base plan is $69/month and includes the first 10 data sources, all features, unlimited users, unlimited clients, unlimited reports. Past 10 sources, it’s $4.50 each up to source 100, then $3.00 up to 500, then $2.00 beyond. Annual billing knocks 10% off.
That’s the whole pricing model.
Notice what’s not in there. No premium connector add-ons. No tier where white-labeling unlocks. No AI gating. No “starter plan that doesn’t include the thing you need.” Every plan gets every feature.
Here’s how that plays out at common agency sizes:
- 5 sources: $69/month
- 25 sources: $136.50/month
- 50 sources: $249/month
- 100 sources: $474/month
For comparison, at 5 sources, Whatagraph’s only published plan costs $812/month on annual billing. Same workload. Roughly 11.8x more.
What You Actually Get
Swydo’s feature set is deeper than the price suggests. Start with the part most comparison articles skip entirely.
Reporting Tools Report. Swydo Also Watches.
Whether you’re running 5 client accounts or 50, someone on your team is still doing a manual sweep most mornings: opening each client’s dashboard one at a time, scanning the numbers, and checking whether a data source silently disconnected overnight, usually before a report goes out. With Looker Studio, that sweep is entirely manual because there’s no monitoring layer at all. Most other reporting tools, including AgencyAnalytics and DashThis, are built the same way: they generate reports well, but nothing watches the numbers in between.
Swydo built four connected pieces specifically to remove that sweep, grouped under Monitoring in the left nav:
- Metrics Overview pulls up to 6 KPIs across every client into one cross-client screen, so you’re not opening 30 separate dashboards just to see who’s up or down.
- Goals track pacing against a target (On Track, Off Track, Achieved) so you’re not doing the math yourself on whether $9.60 spent by noon against a $20/day budget is actually a problem.
- Alerts run daily in the background and email you the moment a metric moves outside the range you set, instead of you finding out three days later.
- Data Health Check flags a broken connection with a red dot and an email the moment it breaks, not when a client asks why last week’s chart is empty.
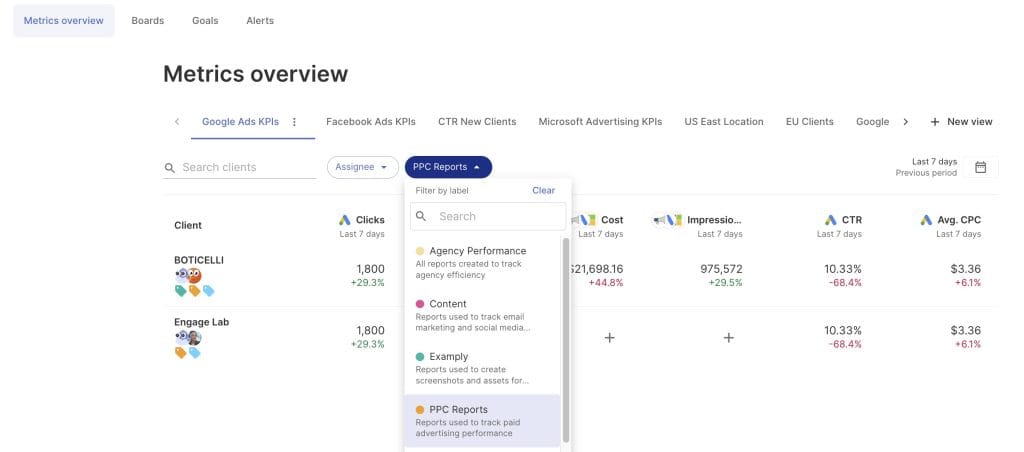
None of this is one flashy feature. It’s a narrower job: collapsing a routine that used to take real time clicking between client accounts into a couple of minutes of scanning color-coded status, whether the roster is 5 clients or 50. That said, it’s a genuine time trade, not a magic fix. You still have to set up the goals and alerts you care about per client, and a team that never checks its Alerts inbox won’t get the benefit automatically.
A few other things worth calling out specifically.
Master templates that scale. Build one report once (say, a PPC template) and link 50 client reports to it. Edit the master and every linked report updates automatically. This is the difference between an hour of edits and a full afternoon when a client asks for a layout change. If you’re setting up a client reporting workflow from scratch, our client reporting best practices guide covers the fundamentals.
Combined Data Sources. Blend up to five ad platforms (Google, Meta, LinkedIn, TikTok, Microsoft, X, Pinterest, Snapchat, Reddit) into a single widget: Cost, Clicks, Impressions, Conversions, ROAS, Revenue. As of February 2026, you can also track these blended metrics over time with line, spline, and area charts. Most competitors charge premium to do this.
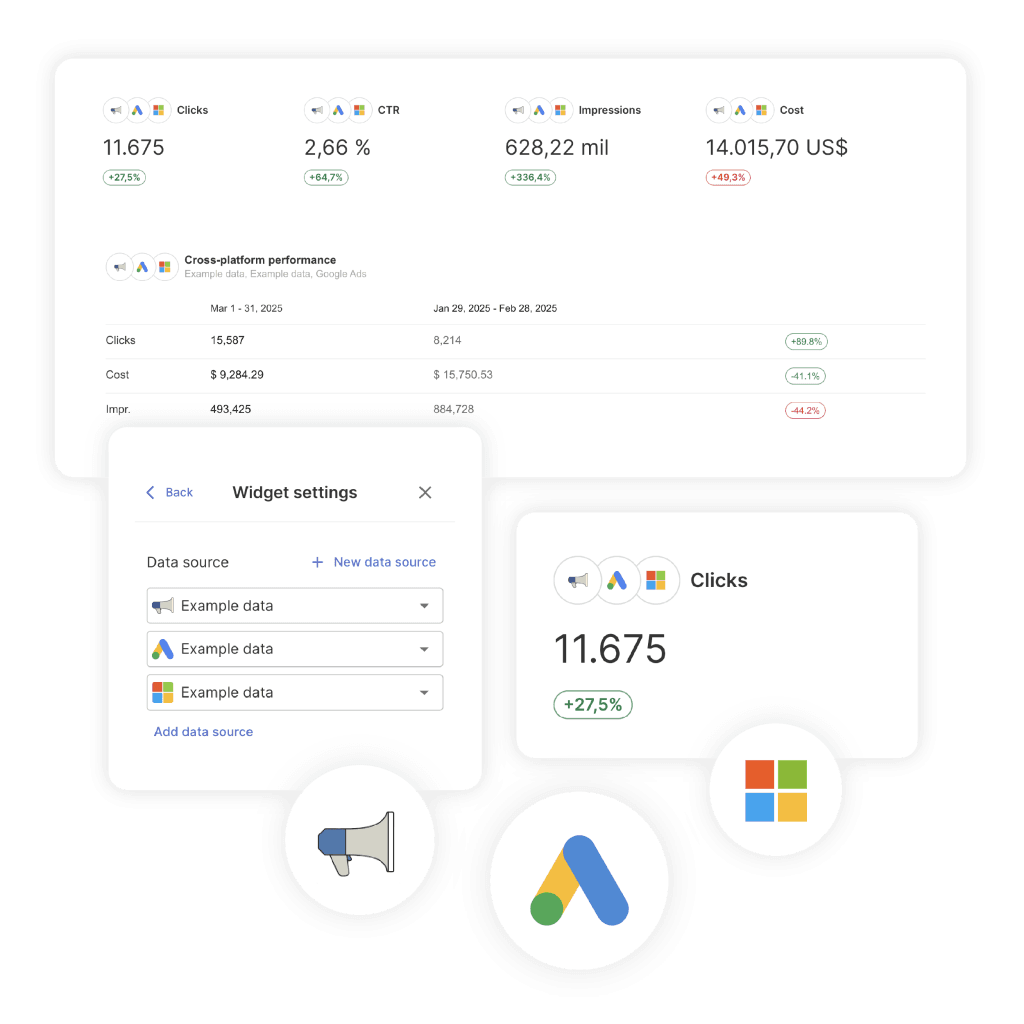
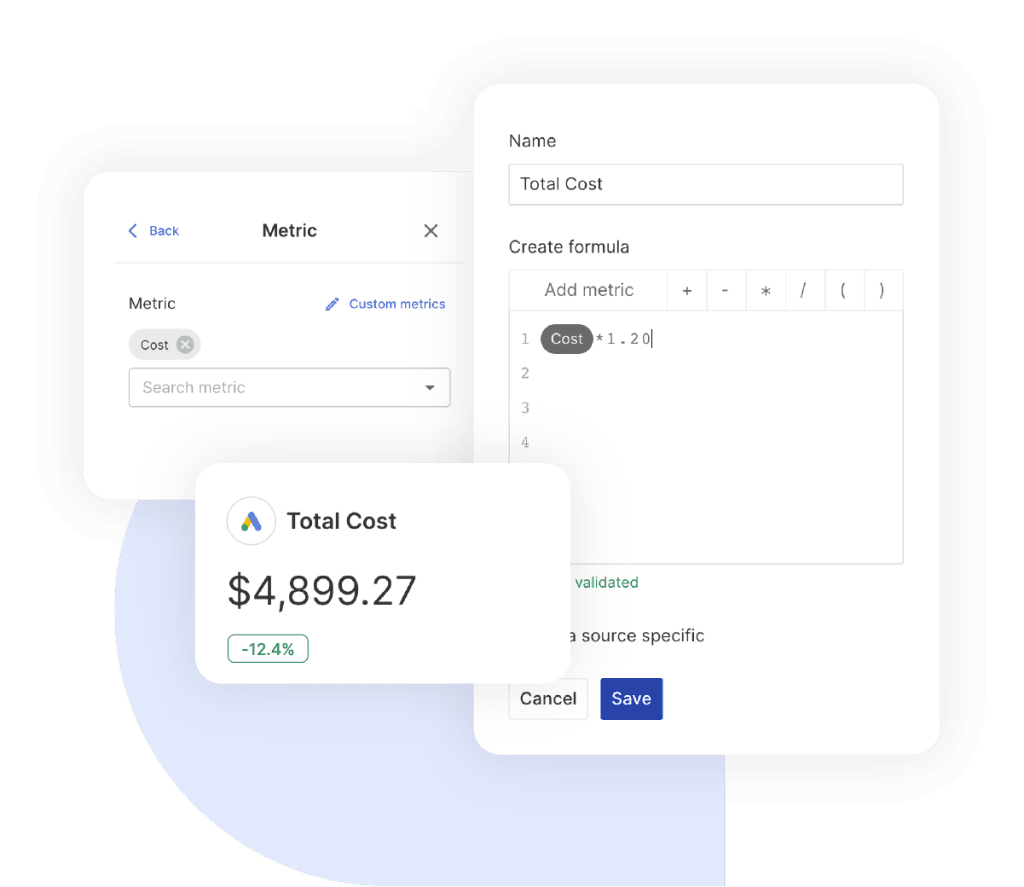
Custom Metrics for agency markup. Build a metric like `Cost × 1.20` to mark up media spend automatically across every client report. Update the formula once, every report reflects it.
Manual KPIs. Got offline data, like phone leads or in-store revenue, that doesn’t have an integration? Add it as a Manual KPI and it renders identically to automated ones.
Report Filters and Sections. Apply a filter to every widget at once, or organize widgets into unlimited sections. As of February 2026, you can copy entire sections between reports.
Bulk widget editing. Multi-select widgets to drag-move, copy, delete, or reset filters across the selection (March 2026 update).
Swydo AI – Included, Not an Upsell
Swydo AI launched in October 2025. Four default prompts: Summary, Wins, Issues, Recommendations. Multilingual (Dutch, English, French, German, Spanish, and more). Outputs paste directly into a text widget.
You get 4,000 AI credits per month included. Average report summary uses about 95 credits. There’s also a client-facing AI mode you can toggle in dashboard sharing settings: viewers can chat with the AI themselves on a shared link.
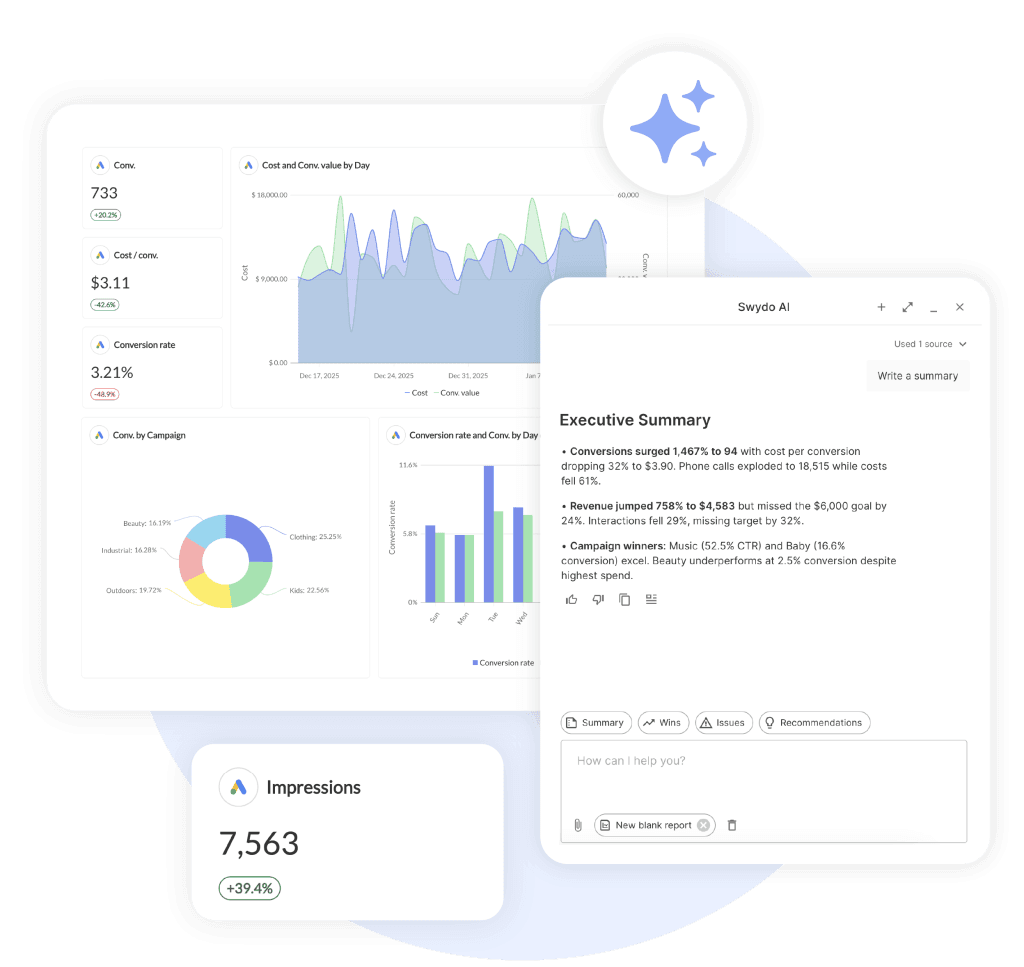
As of April 2026, AI summaries can be included directly in scheduled report emails. This is part of a broader shift toward report automation for marketing agencies, where AI increasingly handles the narrative layer that used to eat up an analyst’s afternoon.
Integrations: Focused, Not Bloated
Swydo connects 30+ marketing platforms: Google Ads, Meta, GA4, LinkedIn Ads, Microsoft Ads, TikTok Ads, X Ads, Pinterest Ads, Snapchat Ads, Reddit Ads (Beta), Search Console, Google Business Profile, Google Sheets, AccuRanker, SE Ranking, HubSpot, Mailchimp, Klaviyo, ActiveCampaign, CallRail, Call Tracking Metrics, AdRoll, YouTube Analytics, Toggl (Beta), and more.
Reddit Ads went live in February 2026. Toggl time tracking landed the same month. If you need Amazon Ads, DV360, or Yelp natively, Swydo isn’t where you’ll find them, though Google Sheets imports through Zapier or Make cover most edge cases.
White-Labeling, Included
Every plan gets the full white-label suite: custom domain with SSL, custom email sender, your logo, your colors, 1,000+ Google Fonts, A4 PDF cover customization, the option to remove Swydo branding entirely. If white-labeling is the deciding factor for your agency, our guide to white label reporting for agencies walks through what to prioritize.
Recent additions in March 2026: report background color, widget background color, widget border color, border style with shadow levels, and a fade-header-with-body toggle.
What G2 and Capterra Reviewers Say
G2 score: 4.6/5 across 111 reviews. 90% are 5-star. The most-cited pros are ease of use, customer support, and time-savings. One reviewer’s quote sums it up well: an Excel report that took five hours now takes ten minutes.
What about the cons? They’re real. Some reviewers want deeper KPI-level customization. The integration list is smaller than Databox or Supermetrics. There’s no native API or Zapier (custom data has to come through Sheets). And a few G2 reviews mention surprise overages when inactive sources kept being counted, worth knowing before you sign up.
Swydo is the right pick if you have 5 to 50 clients, you want predictable pricing, you need white-labeling out of the box, and you don’t need 130 obscure connectors. Try it free for 14 days, no credit card.
2. AgencyAnalytics – Strongest Agency-Specific Feature Set
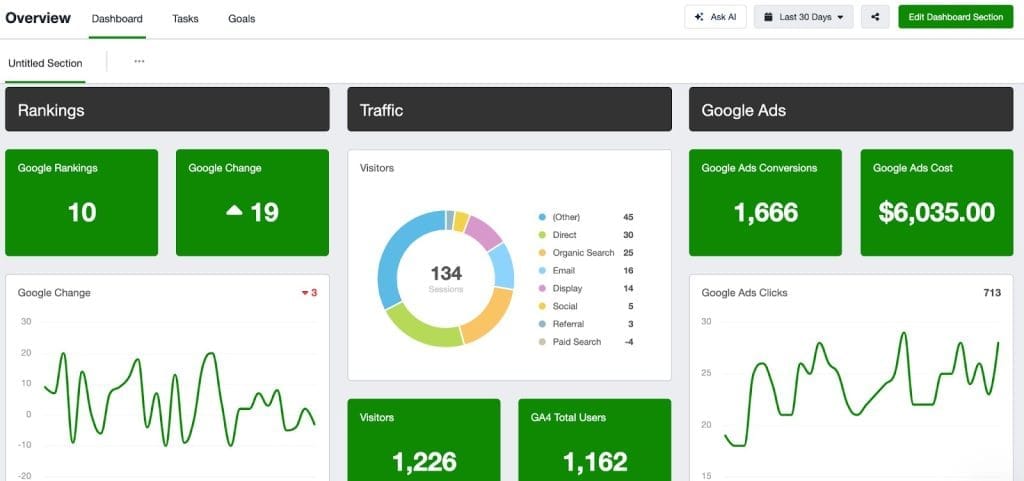
AgencyAnalytics is the platform that thinks like an agency. Branded iOS and Android apps for your clients. Roll-up dashboards across multiple clients. Proposals built into the tool. Goal and budget tracking with ad-spend markup baked in.
AgencyAnalytics rebuilt its pricing in 2026 too. The old Freelancer, Agency, and Agency Pro tiers are gone, replaced by a single Core plan with every feature unlocked from client one:
| Plan | Monthly | Annual ($/mo) | Includes |
|---|---|---|---|
| Core | $25 per client | $20 per client | All features, unlimited staff and client users, unlimited data sources, unlimited reports |
| Enterprise | Custom | Custom | For 25+ clients, database connectors, dedicated onboarding |
Annual billing saves about 20%. There’s no more tier-hopping to unlock AI or unlimited staff. Everything (white-label branding, the client portal, goals and alerts, API access, unlimited staff and client users) ships in Core from the first client. The trade-off is that the bill scales linearly: 5 clients runs about $100/month annual, 25 clients runs about $500/month, and so on. Two features sit outside Core as paid add-ons: AI Tracker (AI visibility and brand monitoring across ChatGPT, Google AI Overview, Gemini, and more) at $20.83/month per 250 credits, and Rank Tracker at $41.67/month per 500 keywords, both billed annually.
A lot of write-ups claim AgencyAnalytics killed its SEO suite. Not all true. The rank tracker, backlink monitor, and integrations with Ahrefs, SEMrush, Moz, and Majestic are all still active. The one thing that did change is the Site Auditor: it’s only available to legacy accounts created before November 2023. New accounts don’t get it.
AskAI got a 2.0 release in November 2025. The full feature set now includes 80+ integrations, Smart Reports that auto-populate in about 11 seconds, AI Summary widgets, and the Proposals module.
The G2 numbers are excellent: 4.7/5 across roughly 432 reviews, with a Quality of Support score of 9.5/10. Capterra is 4.8/5.
The criticisms? Integrations occasionally break with multi-day data delays. The per-client model means costs climb steadily as your roster grows rather than jumping between tiers, so it’s easy to underestimate the bill at 20 or 30 clients. AI Tracker and Rank Tracker sit outside the base price as add-ons, which can feel like features you’d expect to be included. Template changes don’t always propagate to existing client reports automatically.
Pick AgencyAnalytics if your clients want a fully branded mobile app experience, or if you’re managing 10+ clients and want the most polished agency-specific feature set in this category. For a full side-by-side, see our Swydo vs AgencyAnalytics comparison.d want the most polished agency-specific feature set in this category. For a full side-by-side, see our Swydo vs AgencyAnalytics comparison.
3. Databox – For Agencies That Want AI to Do the Thinking
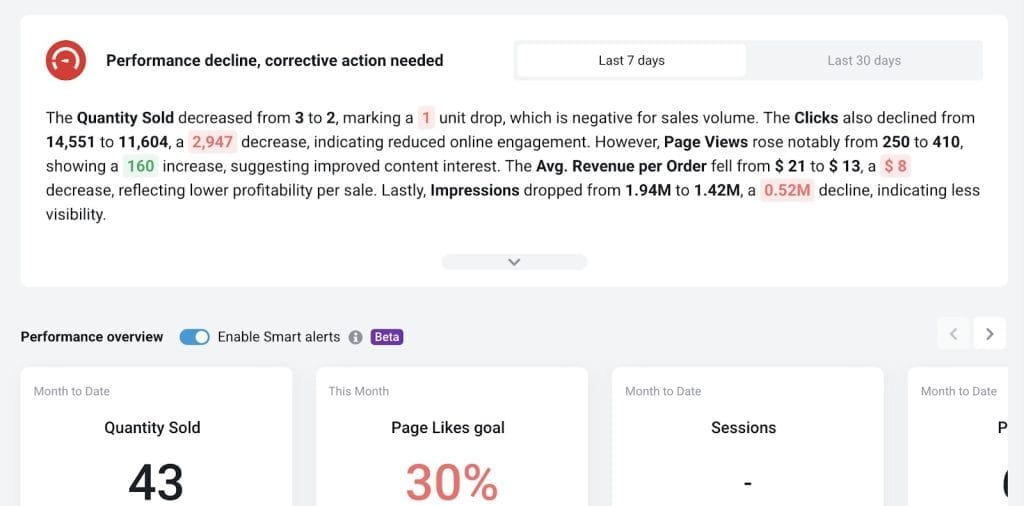
Databox isn’t quite an agency tool. It’s a business intelligence platform that agencies happen to use. That distinction matters.
Pricing:
| Plan | Annual ($/mo) | Monthly | Sources |
|---|---|---|---|
| Free | $0 | $0 | 3 |
| Pro | $159 | $199 | 3 (overage $5.60–$7) |
| Growth | $399 | $499 | 3 |
| Premium | $799 | $999 | 50 |
Yes, the free plan still exists. The free tier is on databox.com/pricing right now: 3 sources, 1 dashboard, 3 users, 10 custom metrics. Good for testing, not for running an agency.
Databox shipped Genie AI Analyst in October 2025. It does natural-language Q&A on your data. You ask “why did paid social conversions drop last week” and Genie writes the analysis. There’s also an MCP server, so Genie can talk to Claude, ChatGPT, or n8n directly. Anomaly detection, forecast modeling, and editable AI Performance Summaries round out the AI features.
Integration count is now 130+. White-labeling is a $200/year add-on, or it’s bundled in Premium ($799/month annual).
G2: 4.4/5 across 194 reviews. Reviewers consistently praise the AI summaries and the depth of analysis. The recurring complaints: steep learning curve, slow support response times mentioned in several Capterra reviews, and per-source pricing that adds up fast at agency scale.
Databox makes sense if your clients want analysis, not just numbers, and if you have the budget to support that. It’s also a better fit for SaaS and consulting firms than for traditional digital agencies. For more options in this category, see our Databox alternatives roundup.
4. DashThis – Fast, Polished, Just-Repriced
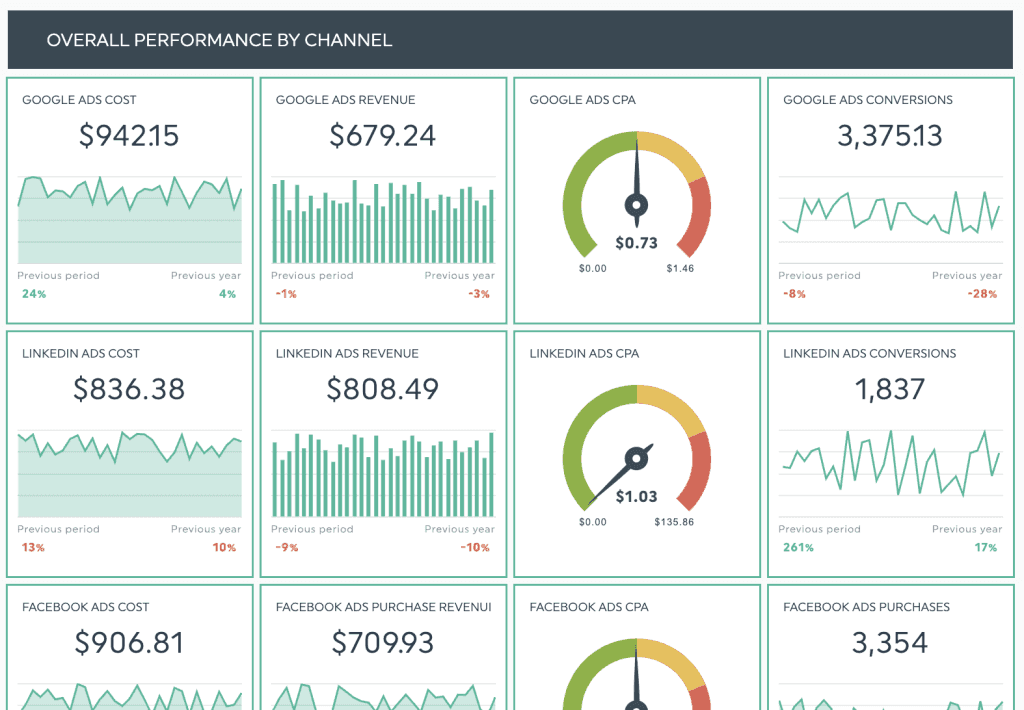
DashThis announced new pricing on March 30, 2026. Here’s what’s live now:
| Plan | Monthly | Annual ($/mo) | Dashboards | Sources |
|---|---|---|---|---|
| Individual | $54 | $44 | 3 | 15 |
| Professional | $164 | $139 | 10 | 40 |
| Business | $324 | $279 | 25 | 100 |
| Standard | $499 | $429 | 50+ (slider) | 200+ (slider) |
The shift in 2026: plans now meter both dashboards AND data sources. The old “$49 for 3 dashboards” model is gone.
DashThis is fast. That’s its core appeal. Templates load, integrations connect, and a client-ready dashboard is live within an hour. The G2 scores reflect this: 4.7/5 across 83 reviews, with the highest Quality of Support score in this entire comparison at 9.6/10.
The 30+ integration list is smaller than competitors, and the widget customization is described as “clunky” by some reviewers. AI Insights is a $19/month add-on, not included by default. Custom domains require Business tier and up.
DashThis fits small agencies with under 25 dashboards who care more about speed and polish than data depth. If you want to bill clients tomorrow morning, it’s a serious option. Read our full Swydo vs DashThis comparison for the details.
5. Supermetrics – The Connector King (But Not Really a Reporting Tool)
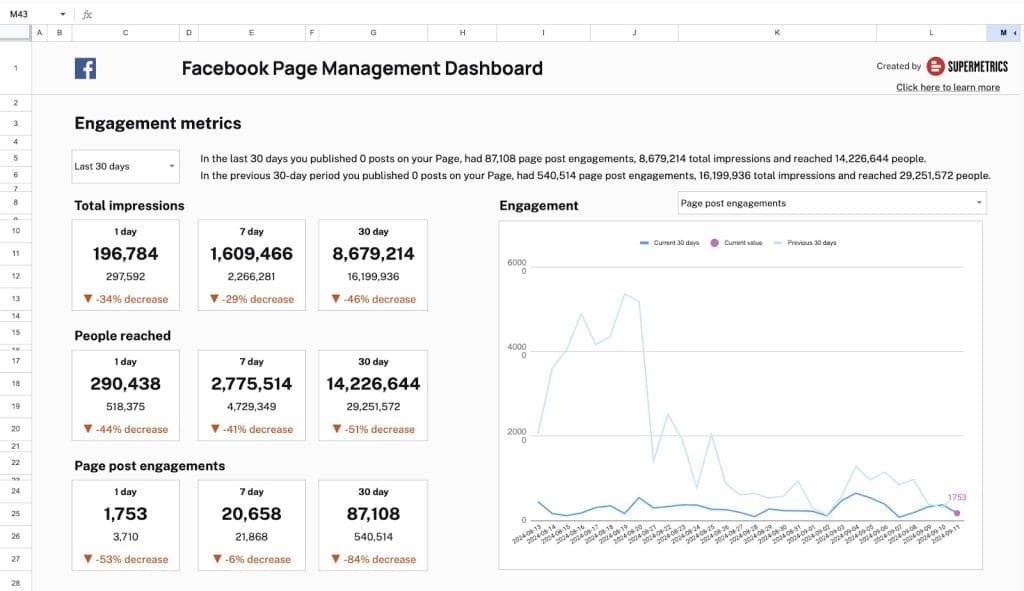
*Facebook Page report template exported to Google Sheets using Supermetrics.*
This one needs context. Supermetrics is in this article because people compare it to Whatagraph, but they shouldn’t. They do different jobs.
Supermetrics is a data pipeline. It moves marketing data from sources (Google Ads, Meta, LinkedIn, etc.) into destinations (Google Sheets, Looker Studio, Excel, Power BI, BigQuery). It doesn’t build client-ready reports. You still need a reporting layer on top.
Pricing for Google Sheets, annual:
| Plan | Annual ($/mo) | Sources | Refresh |
|---|---|---|---|
| Starter | $37 | 3 | Weekly |
| Growth | $177 | 6 | Daily |
| Enterprise | Custom | Custom | On-demand |
Hidden costs are real. Extra destination: \+$177/month. Extra user: \+$99/month. Premium connectors (Adobe Analytics, Salesforce, X Ads, DV360, Trade Desk) are restricted to higher tiers with no public per-connector pricing. BigQuery, Snowflake, and Redshift integrations are Enterprise-only.
What you get: 150+ connectors. The widest catalog in this category. Supermetrics AI launched November 2025 with five agents and an MCP server, and a Marketing Intelligence Agent in Gemini Enterprise.
What you should know: Supermetrics had 48 documented outages between June 2025 and April 2026 per StatusGator, including a system-wide outage on June 5, 2025 and ongoing X Organic data accuracy issues from April 10–22, 2026.
G2: 4.4/5 across 819 reviews. The most-cited complaint: “hidden costs everywhere” and connectors getting moved to higher tiers over time.
Use Supermetrics if you’ve already chosen Looker Studio or Sheets as your reporting destination and you need the deepest connector library. Don’t use it expecting a finished agency reporting tool.
6. Data Studio (Formerly Looker Studio) – Free, With Caveats
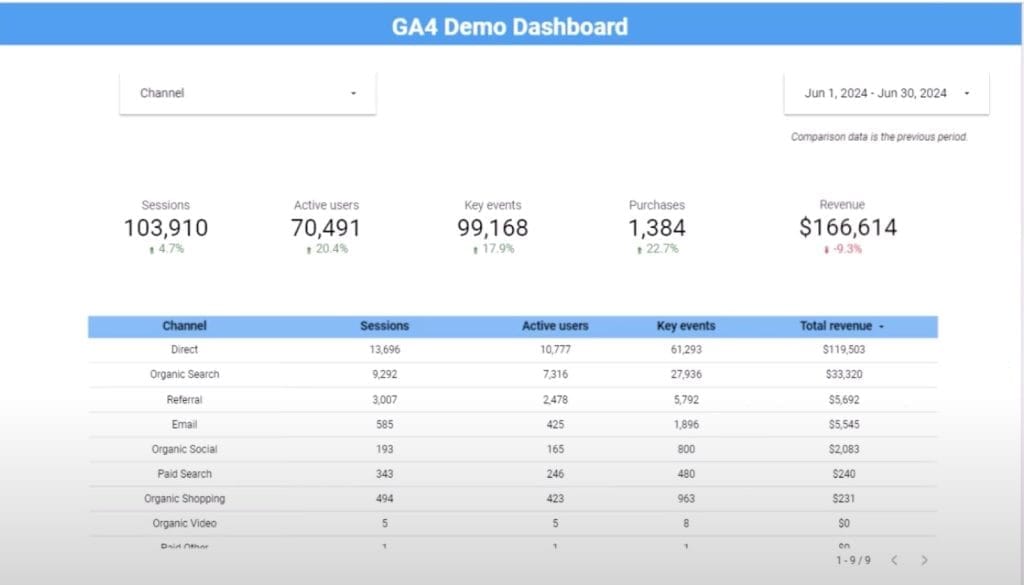
Google quietly reversed itself on April 10, 2026. Looker Studio is now Data Studio again. The 2022 rebrand is dead. Existing reports, sources, and users migrated automatically on April 16.
The free tier is still excellent for what it is: unlimited reports, native Google connectors (GA4, Google Ads, Search Console, Sheets, BigQuery), 1,300+ community connectors, real-time collaboration.
Data Studio Pro is $9/user per Google Cloud project per month. That sounds cheap. It isn’t, at scale: 50 users in one project \= $5,400/year. Pro adds team workspaces, IAM/SSO, 200 scheduled email deliveries (vs. 1 on free), Conversational Analytics powered by Gemini, and “Add to Slides.”
What free Data Studio can’t do: white-label your reports, send branded client emails without manual workarounds, or perform well on large blended datasets. About 38% of recent G2 reviews flag performance issues with bigger data volumes.
Then there’s the connector trap. Most of those 1,300+ partner connectors are paid, typically $20 to $500/month each through Supermetrics, Windsor.ai, Coupler.io, or Catchr. One Beast Metrics analysis found teams spend 3–5x more on connectors than they do on the BI tool itself.
Free Data Studio is genuinely useful for solo marketers, small in-house teams, and anyone who lives in the Google ecosystem. It’s not a Whatagraph alternative for an agency that needs client-ready white-label reporting at scale.
7. Klipfolio – Power, Depth, and a Learning Curve
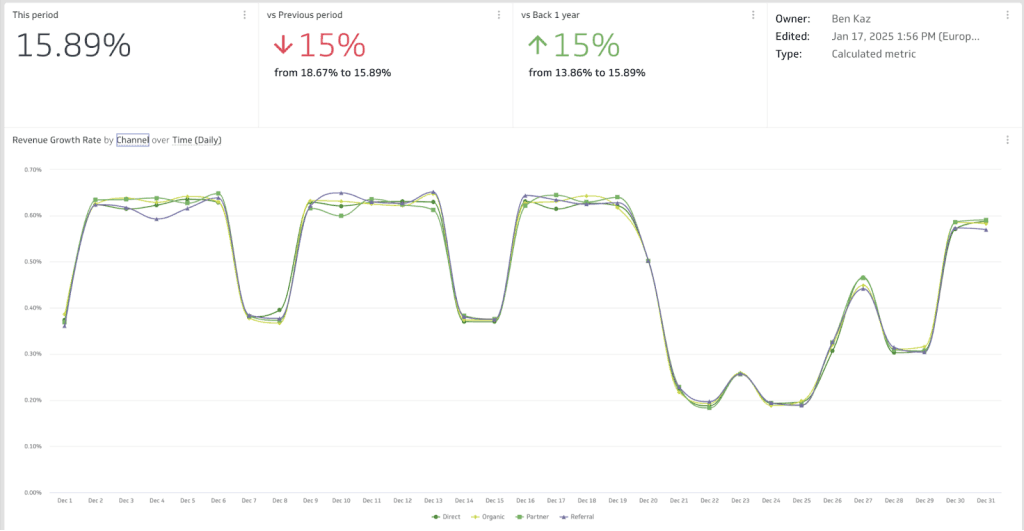
Klipfolio is a different beast. If Swydo is the easy answer, Klipfolio is the powerful one, assuming you’ve got the patience to learn it.
Klips pricing, annual:
| Plan | Annual ($/mo) | Dashboards | Refresh |
|---|---|---|---|
| Base | $120 | 3 | 4 hours |
| Grow | $190 | 10 | 1 hour |
| Team | $310 | 20 | 15 minutes |
| Team+ | $600 | 40 | Up-to-the-minute |
White-labeling is a $299/month bundle on top. Custom domain alone is $90/month. SSO is $63/month. Add-ons stack quickly.
The selling point is flexibility. Klipfolio reviews on G2 (4.5/5, 257 reviews) repeatedly call it “more like designing a web page than configuring a chart.” If you’ve got an analyst on staff who wants pixel-level control, Klips can do things other tools can’t.
The flip side, in reviewer language: “custom visualizations basically require a developer.” The UI feels dated. The learning curve is the steepest in this comparison.
Pick Klipfolio if customization beats convenience for you, and if you have technical chops on the team. See our full Klipfolio alternatives breakdown for more options in this category.
8. Coupler.io – ETL Plus a Reporting Layer
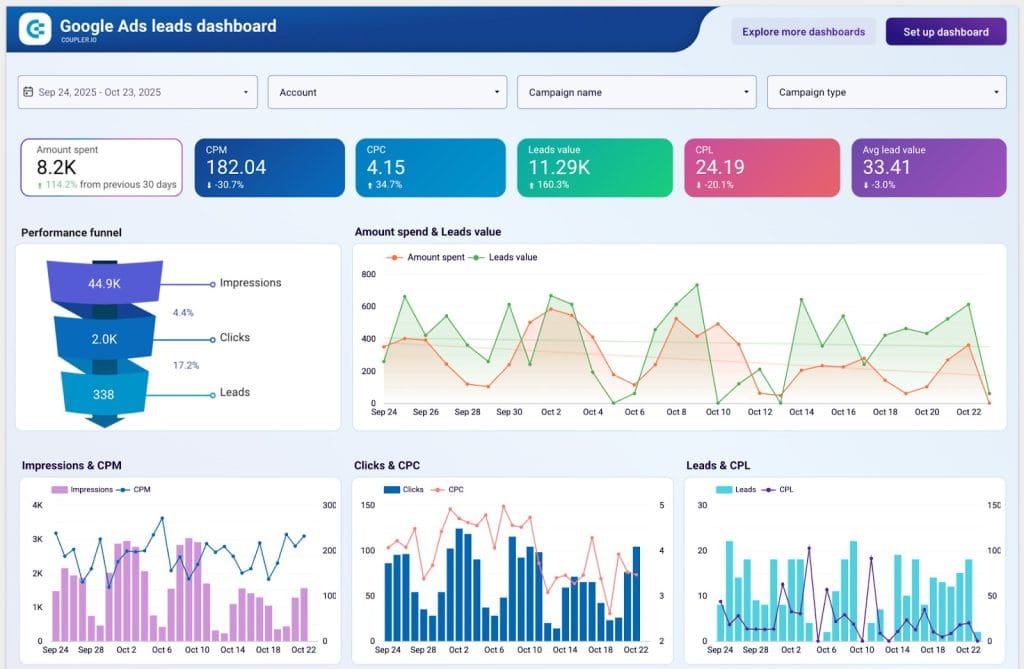
Coupler.io sits in an interesting spot in 2026. It started as a data pipeline (sources to destinations), then added native dashboards, then added AI on top.
Pricing, annual:
| Plan | Annual ($/mo) | Accounts | Refresh |
|---|---|---|---|
| Free | $0 | 1 | Manual, 100 rows |
| Starter | $24 | 3 | Daily |
| Active | $99 | 15 | Daily |
| Pro | $199 | 50 | Hourly |
| Agency | Custom | Custom | 15-min |
Two facts worth knowing. The free plan is real and forever-free at the row cap. And the 15-minute refresh is Agency-tier custom pricing only. Pro tops out at hourly.
What’s good about Coupler.io: 400+ data sources, 13 destinations, all included on every plan. Around 210+ pre-built dashboard templates. AI Insights powered by Claude that writes ~20-second summaries with Trends/Findings/Recommendations. SOC 2 Type II \+ GDPR \+ HIPAA compliance.
G2: 4.8/5 across 108 reviews, the highest score in this comparison. Setup in under 30 minutes. One-license-includes-everything pricing model. The criticism: connections per platform can stack up fast (six per YouTube channel, for example).
Coupler.io fits if you need a no-code ETL tool that also handles light reporting, and if a flat connector fee beats the per-source models elsewhere.
Three New 2026 Entrants Worth Knowing About
A few players have shown up worth mentioning.
TapClicks has gone deep on AI in 2025. AI Summary Agents in April, Operator Agents in May, 13 Insights Agents in September, SmartReports/SmartSlides in October. It absorbed Megalytic and shut down iSpionage on July 9, 2025. Pricing starts around $99/month for TapData but full agency stacks typically run $1,500–$2,000+/month. G2: 4.3/5 across 336 reviews. Worth a look if you want the broadest AI agent capability and you’ve got enterprise budget.
Adriel is the AI-forward AdOps and reporting hybrid. It rebuilt itself for enterprise pricing in 2025. Starter is now $6,000/year, Professional $12,000/year. It has 650+ data connectors, the largest set in this comparison. G2 around 4.7/5 across a smaller sample (~25 reviews).
Reportz is the budget play. Per-dashboard pricing starts at $9.98/month, decreasing as you add dashboards. Full white-label included on every plan. Around 20+ integrations (no Bing or Shopify natively). No AI features as of 2026, which is a real gap. G2: 4.3/5 across 98 reviews. Best for freelancers and SMB agencies on tight budgets.
Catchr deserves a mention as the rising European alternative. Paris-based, $20–$165/month across five tiers, native MCP integration for Claude/ChatGPT, one of the first agentic-AI plays in this space. G2 around 4.9/5 across 40 reviews.
So Which One Should You Actually Pick?
Honest answer: it depends on three things.
How many clients do you have? Under 5: Swydo, DashThis, or Reportz. 5 to 25: Swydo or AgencyAnalytics. 25 to 100: Swdyo, AgencyAnalytics, Databox, or Whatagraph if budget allows. 100+: Swydo, TapClicks, Whatagraph Prime, or enterprise tools.
Is white-labeling non-negotiable? Then Swydo, AgencyAnalytics, Reportz, or Whatagraph Max. Skip Databox unless you’re on Premium. Skip free Data Studio entirely.
Do you want AI doing the analysis, or just clean reports? AI-first: Databox, Whatagraph, AgencyAnalytics, TapClicks. Reports-first: Swydo, DashThis, Reportz.
What’s your actual bottleneck right now? Time spent on reports? Cost? Client retention because reports look generic? The right tool answers your specific bottleneck, not a feature checklist. For a broader shortlist beyond this comparison, our best client reporting software roundup covers more ground.
Why Swydo, in Plain Language
You’ve made it this far. Here’s the case for Swydo: straight, no spin.
It’s $69/month base. White-label is included. AI is included. Customer support is included. Personal onboarding is included. Free migration is included. The whole product is included.
That last sentence is the thing competitors can’t say. Whatagraph now charges $812/month just to get in the door, with white-label bundled into that one published plan. Databox charges $200/year extra or pushes you to the $799 plan. AgencyAnalytics charges $20.83/month extra for its AI Tracker add-on. Klipfolio adds it as a $299/month bundle.
Swydo’s bet (and we’ll let you judge whether it’s right) is that pricing transparency is what most agencies actually want. No tier-hopping. No surprise add-ons. No “contact sales for pricing.”
But the pricing is only half of it. The part that tends to actually change how an agency’s mornings go is the monitoring layer: Metrics Overview, Goals, Alerts, and Data Health Check working together so your team is scanning color-coded status instead of clicking through every client’s dashboard by hand. That’s the difference agencies managing 5 clients and agencies managing 50 both mention when they explain why they switched.
Try it for 14 days, free, no credit card. Worst case, you’ll have a clearer sense of what your current tool is missing. Best case, you’ll save 60-80% on your reporting bill, and get your mornings back.
Whatagraph Alternatives FAQ
Quick answers to the questions agencies ask most before switching tools
Whatagraph now has two plans: Max ($812/month, billed annually only, 50+ source credits) and Prime (custom pricing, 100+ source credits). The old Free, Start, and Boost tiers are gone. White-labeling is bundled into Max, so the cheapest way to get your branding on reports now runs $9,744/year, up sharply from the old Boost-tier price.
Yes, but the offer changed shape. Whatagraph dropped its permanent free plan. Signing up now gives you a 14-day trial of the Max plan, no credit card required, with full access to white-labeling, data blends, and KPI alerts. When the trial ends, you choose Max or move to a custom Prime quote. There’s no free tier to fall back on. Most alternatives (Swydo, AgencyAnalytics, Databox, DashThis) still offer straightforward 14-day free trials with no credit card.
62 integrations as of the current public integrations page. Older marketing materials still reference “55+” but the actual count is higher. Premium connectors like Adobe Analytics, DV360, and SA360 are now restricted to the Prime tier, one step above the $812/month Max plan. Note that BigQuery transfer isn’t automatically part of that Prime jump. It’s billed as a separate add-on even at the custom-quote tier. By comparison, Databox has 130+, AgencyAnalytics 80+, and Swydo 30+ focused integrations.
Whatagraph IQ is the platform’s AI layer. It generates report summaries in 18 languages, powers IQ Chat (where clients can ask questions of their own report on a shared link), and runs self-healing widgets that auto-fix when integrations break. IQ+ adds advanced features and is locked to the Prime tier. The AI features are genuinely strong. The question is whether your agency uses them enough to justify the price.
Three reasons keep coming up, and cost has gotten sharper since the mid-2026 repricing. The only published plan, Max, now runs $812/month, billed annually with no monthly option, a steep jump from the old Boost tier it replaced. That locks agencies into a bigger upfront commitment just to access white-labeling. And the AI-heavy direction still doesn’t match every agency’s workflow. If your clients glance at reports for two minutes and care most about whether numbers went up or down, you’re paying for AI capabilities that go unused.
Three scenarios. First, agencies with 100+ clients on enterprise budgets that need premium connectors like Adobe Analytics, DV360, or SA360. Second, agencies whose clients actively use IQ Chat to query their own reports. That interactive AI layer is hard to replicate elsewhere. Third, agencies with international client bases who need AI summaries in multiple languages. Outside those cases, alternatives deliver most of the value at a fraction of the cost.
It depends on what you need. Swydo wins on price and pricing transparency at $69/month with white-label included. AgencyAnalytics wins for agencies wanting branded mobile apps and a polished agency-specific feature set. Databox wins if AI-driven analysis is your priority. DashThis wins for small teams that want fast, polished dashboards. There’s no universal “best.” Match the tool to your agency size, budget, and how clients actually consume reports.
Swydo is better for agencies that want predictable pricing and white-labeling without paying premium prices. It’s about 11.8x cheaper than Whatagraph’s Max plan at small agency scale, now that Whatagraph’s cheapest published tier runs $812/month. Whatagraph is better if you need 60+ integrations including premium connectors, advanced AI features like IQ Chat, or international AI summaries. For most agencies under 50 clients with standard reporting needs, Swydo delivers 80-90% of the value at a fraction of the cost.
AgencyAnalytics has more integrations (80+ vs 62), branded iOS and Android apps for clients, and built-in proposals. All features Whatagraph doesn’t match. It’s also dramatically cheaper at small agency scale, with AgencyAnalytics’s Core plan running $20/client/month annual (about $100/month for 5 clients) vs Whatagraph’s Max plan at a flat $812/month annual regardless of client count. The gap narrows as your roster grows since AgencyAnalytics bills per client, but Whatagraph still costs more at almost any realistic agency size. Whatagraph counters with stronger AI (IQ Chat, multi-language summaries) and self-healing widgets. For pure agency workflows, AgencyAnalytics is the more practical pick. For AI-first reporting, Whatagraph still leads, at a much higher price.
Databox is a business intelligence platform that agencies use. Whatagraph is purpose-built for agency reporting. Databox has 130+ integrations vs Whatagraph’s 62, and its Genie AI Analyst handles natural-language Q&A on data. White-labeling on Databox is a $200/year add-on or requires the $799/month Premium plan, while Whatagraph now bundles it into its only published plan at $812/month annual, more expensive than Databox’s Premium tier for a narrower feature set. Databox suits SaaS and consulting firms; Whatagraph suits traditional digital agencies with the budget for it.
Not really. Supermetrics is a data pipeline that moves marketing data from sources into destinations like Google Sheets, Looker Studio, Excel, Power BI, or BigQuery. It doesn’t build client-ready reports. You’d still need a reporting layer on top. Use Supermetrics if you’ve already chosen Looker Studio or Sheets as your reporting destination and need 150+ connectors. Don’t expect a finished agency reporting tool.
Yes, for small agencies under 25 dashboards. DashThis is the fastest tool to launch. Templates load and dashboards go live within an hour, and it has the highest support score of any alternative (9.6/10 on G2). The trade-offs: only 30+ integrations, AI Insights costs $19/month extra, and custom domains require the Business tier ($279/month annual). Picking DashThis is choosing speed and polish over data depth.
Reportz, at $9.98/month per dashboard with full white-label included on every plan, best for freelancers on tight budgets. Note Reportz has no AI features and only ~20 integrations (no native Bing or Shopify). For more capability at low cost, Swydo at $69/month base includes white-labeling, AI, unlimited users, and unlimited reports. Both are dramatically cheaper than Whatagraph’s current $812/month entry point, which is now its only published plan.
Three now: Swydo ($69/month), Reportz ($9.98/month per dashboard), and AgencyAnalytics ($20/client/month annual), which folded white-labeling into its single Core plan in 2026. DashThis requires Business or above. Databox sells it as a $200/year add-on. Whatagraph now bundles white-labeling into its only published plan, Max, at $812/month annual. If white-labeling is non-negotiable on a tight budget, Swydo and Reportz stay the cheapest options that don’t gate it.
Swydo includes AI on every plan starting at $69/month, with 4,000 AI credits monthly and four default prompts (Summary, Wins, Issues, Recommendations) in multiple languages. Coupler.io includes AI Insights powered by Claude on its Starter plan. Most competitors charge extra for AI: AgencyAnalytics ($20.83/month AI Tracker add-on), Databox ($159/month Pro tier minimum), DashThis ($19/month add-on), Klipfolio ($299/month bundle), Whatagraph (core IQ comes with the $812/month Max plan, with IQ+ gated to the custom-priced Prime tier).
AgencyAnalytics is the only major alternative offering fully branded iOS and Android apps for clients, included in its single Core plan at $20/client/month annual. Your agency name, icon, and branding appear throughout. Swydo, DashThis, Databox, and Whatagraph all focus on responsive web dashboards rather than native branded apps. If a branded mobile experience is a hard requirement, AgencyAnalytics is the natural pick.
Adriel leads at 650+ data connectors. Supermetrics has 150+ if you’re using it as a pipeline to Sheets or Looker. Databox has 130+ native integrations. AgencyAnalytics has 80+. Whatagraph has 62. DashThis and Swydo have around 30+ focused integrations. More isn’t always better. Most agencies use 5-15 integrations across all clients combined. Match the integration count to what your stack actually requires, not to feature-list bragging rights.
Most major platforms support TikTok Ads natively. Swydo, AgencyAnalytics, Databox, Whatagraph, and DashThis all have it. Reddit Ads is rarer. Swydo added Reddit Ads in beta in February. AgencyAnalytics and Databox also support Reddit Ads. If you need niche platforms like X Ads, Snapchat, or Pinterest, Swydo and AgencyAnalytics cover the broadest set among reasonably-priced tools.
Yes, on most platforms, but it varies in cost. Swydo includes Combined Data Sources on every plan, blending up to five ad platforms (Google, Meta, LinkedIn, TikTok, Microsoft, X, Pinterest, Snapchat, Reddit) into a single widget for Cost, Clicks, Impressions, Conversions, ROAS, and Revenue. Most competitors charge premium tiers for this feature. Whatagraph and Databox support it but on higher-tier plans.
Yes. Swydo supports Manual KPIs. You enter offline data like phone leads or in-store revenue, and it renders identically to automated metrics. Most competitors handle this through Google Sheets imports, which adds a step but works. AgencyAnalytics, Databox, and Whatagraph all support custom data via Sheets or CSV uploads. If offline data is central to client reporting, Swydo’s native Manual KPIs are the smoothest workflow.
Swydo’s master templates are the strongest implementation. Build a PPC template once, link 50 client reports to it, and edits to the master propagate automatically. AgencyAnalytics has Smart Reports that auto-populate but template changes don’t always propagate to existing reports. Whatagraph and Databox support templates but with manual application. For agencies running 25+ similar client reports, master templates can save hours per layout change.
Yes. Most reporting tools, including Whatagraph, AgencyAnalytics, and DashThis, generate reports and stop there. Swydo adds a Monitoring suite that runs in the background: Metrics Overview shows up to 6 KPIs across every client in one screen, Goals track pacing against a target (On Track, Off Track, Achieved), Alerts email you the moment a metric moves out of range, and Data Health Check flags a broken connection before a client sees an empty chart. The practical effect is that checking on 30 or 50 clients each morning takes a couple of minutes of scanning color-coded status instead of opening every dashboard by hand. It’s not a substitute for setting up the goals and alerts you actually care about per client, but it removes the manual sweep most agencies still do by hand with report-only tools.
Swydo starts at $69/month and includes the first 10 data sources, all features, unlimited users, unlimited clients, and unlimited reports. Past 10 sources, it’s $4.50 each up to source 100, then $3.00 up to 500, then $2.00 beyond. Annual billing knocks 10% off. Sample costs:
| Sources | Monthly Cost |
|---|---|
| 5 sources | $69 |
| 25 sources | $136.50 |
| 50 sources | $249 |
| 100 sources | $474 |
Yes, and several alternatives offer help. Swydo includes free migration with personal onboarding on every plan. AgencyAnalytics offers white-glove setup on higher tiers. Most platforms require rebuilding templates from scratch since report structures aren’t directly portable, but starting from each tool’s pre-built templates usually gets you 70-80% of the way there. Plan for 1-2 days of setup time per major template.
Most do, with 14-day trials and no credit card required: Swydo, AgencyAnalytics, Databox, and DashThis all follow this pattern. Coupler.io has a forever-free plan at limited capacity. Databox also has a permanent free tier (3 sources, 1 dashboard, 3 users). Whatagraph offers only a free plan with 5 source credits, with no time-limited trial of paid features. Test 2-3 platforms with a real client account before committing.
Not for agencies needing white-label reporting. Google reverted the name back to Data Studio in April. The free tier is genuinely useful: unlimited reports, 1,300+ community connectors, real-time collaboration. But it cannot white-label reports, send branded client emails, or perform well on large blended datasets. The connector trap is real: most premium connectors cost $20-$500/month each, and one analysis found teams spend 3-5x more on connectors than on the BI tool itself.
Reportz at $9.98/month per dashboard if you have 1-3 clients and need white-labeling on a tight budget. Swydo at $69/month if you want everything included (white-label, AI, unlimited reports) and plan to grow. AgencyAnalytics’s Core plan works out to about $100/month annual for 5 clients ($20/client), with the full agency-specific feature set included from client one. Skip Whatagraph, Databox, and Klipfolio at this scale. The pricing doesn’t make sense for solo operators.
AgencyAnalytics for the most polished agency-specific feature set: roll-up dashboards across multiple clients, branded mobile apps, built-in proposals, goal and budget tracking with ad-spend markup. At this bracket its per-client pricing adds up fast, running roughly $500 to $2,000/month annual for 25 to 100 clients at $20/client. Databox if your clients want analysis, not just numbers, particularly SaaS and consulting firms. Swydo if predictable pricing matters more than feature breadth. At 50 sources you’re paying $249/month vs Whatagraph at $812 (Max, annual).
Four common traps. First, premium connector add-ons. Supermetrics is notorious for moving connectors to higher tiers over time. Second, white-label as an upsell on Databox ($200/year) and others. Third, AI features behind upgrades on most platforms. Fourth, inactive sources still being counted in usage on tiered tools (some Swydo reviewers flagged surprise overages). Read the pricing page twice and check what each “starter” plan excludes before signing up.
Answer three questions in order. How many clients are you reporting on now and in 12 months? Is white-labeling non-negotiable? Do you need AI to write analysis, or are clean reports with manual commentary fine? Then identify your actual bottleneck: time, cost, integration gaps, or generic-looking reports. The right tool solves your specific bottleneck rather than scoring well on a feature checklist. Test 2-3 platforms with real client data during their free trials before committing.
Switch from Whatagraph to Swydo for faster, easier, and affordable client reporting.
Try Swydo Free