
If you’re an agency managing paid search campaigns, you know the reality: client reporting consumes hours of valuable time that could be spent on strategy and optimization. The challenge isn’t just collecting data. You need to consolidate information from Google Ads, Microsoft Advertising, Facebook, LinkedIn, and Google Analytics into professional, client-ready reports.
The good news? The SEM reporting landscape has matured significantly. Today’s tools offer automation, cross-platform integration, and white-labeled dashboards that transform what used to take hours into minutes of work.
This guide examines the leading SEM reporting platforms for marketing agencies, with focus on what each tool does well, where they fall short, and how to choose the right one for your specific needs.
Automated SEM Reporting Saves Agencies Time and Reduces Manual Errors
Manual reporting creates two fundamental problems. The work is time-intensive and error-prone. When you manually export data from multiple platforms, copy numbers into spreadsheets, and format reports, you spend billable hours on administrative work rather than strategic tasks that grow client accounts.
Research across industries shows manual processes can consume significant time, with studies indicating up to 7.5 hours weekly wasted on manual tasks. For agencies billing strategic work at premium rates, this represents substantial opportunity cost.
But automation isn’t without challenges. Common issues include integration failures, data synchronization delays, and platforms that require frequent reconnection. The key is choosing tools that balance automation benefits with reliability.
Three Market Categories Define Your Platform Options
The SEM reporting market divides into three distinct tiers.
Dedicated reporting tools focus exclusively on consolidating data into dashboards and reports. These platforms (like Swydo, DashThis, and Whatagraph) typically cost $49-500 monthly for small-to-mid-sized agencies. They excel at presentation but don’t include research or optimization capabilities.
All-in-one marketing platforms bundle reporting with additional features like keyword research, rank tracking, and site audits. Tools like Semrush and AgencyAnalytics fall into this category, with pricing from $79-499 monthly. These work best when you need both internal research tools and client reporting in one subscription.
Enterprise data infrastructure platforms act as data pipelines feeding business intelligence tools. Supermetrics, Funnel.io, and TapClicks cost $300-3,000+ monthly and serve agencies managing complex data transformations or 50+ clients.
Most successful agencies use a hybrid approach: all-in-one platforms for internal work and dedicated reporting tools for polished client deliverables.
Leading SEM Reporting Platforms Compared by Features and Value
Each tool in this category takes a different approach to solving the reporting problem. Some prioritize simplicity and speed, while others focus on depth and customization. Understanding these differences helps you match the right platform to your agency’s specific workflow and client expectations.
Swydo Specializes in PPC Agency Reporting
Pricing: Base plan starts at $69/month including 10 data sources, with additional sources costing $4.50 each for sources 11-100, $3.00 for sources 101-500, and $2.00 for sources 501+
Best for: PPC-focused agencies of all sizes
Swydo offers over 30 native integrations with unlimited users and clients, plus complete white-labeling capabilities starting at the base plan level.
Key features include:
- Combined Data Sources feature allows merging up to 5 advertising platforms into single widgets
- Data Health Check capabilities for monitoring connections
- Dynamic templates for updating multiple client reports simultaneously
- 24/5 support
The pricing works like this. Swydo charges per data source, not per client. For an agency managing 25 clients who each use 4 platforms (Google Ads, Facebook, LinkedIn, Analytics), that’s 100 total sources. Your calculation: $69 base + (90 sources × $4.50) = $474 monthly.
For 50 clients with 4 sources each (200 total sources), the calculation becomes: $69 base + (90 sources × $4.50) + (100 sources × $3.00) = $774 monthly.
This transparent pricing model makes it easy to calculate costs as you scale. The per-source structure works well for agencies focused primarily on PPC reporting without needing built-in SEO research tools.
Strengths: Fast setup process, transparent pricing with online calculators, unlimited users included, strong integration reliability, proactive connection monitoring
Limitations: Agencies needing extensive SEO research capabilities (beyond basic Google Search Console reporting) will need separate tools like Semrush. Advanced data transformations are limited compared to enterprise platforms.
Best use case: PPC-focused agencies wanting reliable, straightforward reporting without paying for features they won’t use. The unlimited users and clients model removes scaling barriers that per-client pricing creates.
AgencyAnalytics Consolidates Multi-Channel Marketing Data
Pricing: Freelancer plan starts at $79/month with per-client fees of $20 per client beyond the base allocation; pricing scales based on client count
Best for: Full-service agencies needing multi-channel reporting
The platform offers 80+ native integrations that pull data from various marketing channels into consolidated dashboards.
Key features include:
- Conversational AI analytics for natural language queries
- AI-powered report summaries and insights
- Comprehensive integration library covering major marketing platforms
- White-label client portals
- Integrations with third-party SEO tools (Ahrefs, Semrush, Moz, Majestic)
Important cost considerations: While AgencyAnalytics positions itself as an all-in-one platform, several key features require additional fees. The Rank Tracker costs $50/month for every 500 keywords tracked. Backlink monitoring pulls data from Majestic (which requires a separate Majestic subscription). This means agencies often pay the base platform fee plus multiple add-ons to access full functionality.
Strengths: Extensive integration coverage eliminates need for separate reporting tools, unlimited users on all plans, strong customer support, can consolidate data from multiple marketing channels
Limitations: Per-client pricing becomes expensive at scale. Integration reliability issues reported by some users, with frequent disconnections and data inaccuracies compared to source platforms noted in reviews. Add-on costs for rank tracking, and other features can significantly increase monthly expenses beyond the advertised base price. Not suitable for agencies with tight budgets where add-on costs create budget overruns.
Best use case: Full-service agencies managing clients across multiple channels (PPC, social, email) who need one dashboard to consolidate everything. Works best when you already subscribe to third-party SEO tools and just need AgencyAnalytics to pull that data into client reports.
Whatagraph Delivers Advanced Visual Analytics
Pricing: Credit-based model (1 credit per data source) with both monthly and annual billing options available; Basic plan starts at $286/month or $229/month when paid annually
Best for: Medium-to-large agencies with sophisticated reporting needs
Whatagraph positions itself as a premium analytics platform with advanced data blending capabilities and high-end visualizations. The platform offers 50+ integrations with focus on professional presentation quality.
Key features include:
- Smart Builder for rapid report creation
- Advanced data transformation capabilities
- AI-powered features for automated insights
- Dedicated Customer Success Manager on paid plans
- 99.95% uptime guarantee for integrations
Strengths: Sophisticated visualization options, strong data blending capabilities, dedicated support included, powerful for complex multi-source analysis, monthly billing available
Limitations: Higher price point than entry-level tools creates barrier for smaller agencies. Longer setup time for complex implementations means you won’t see ROI immediately. Credit-based pricing requires careful calculation to avoid surprise costs. Not ideal for agencies wanting plug-and-play simplicity or those with straightforward reporting needs.
Best use case: Agencies with technically sophisticated clients who expect advanced analytics and interactive dashboards, or teams with resources to invest in proper implementation. Best for agencies where visual presentation quality directly impacts client retention.
DashThis Prioritizes Speed and Simplicity
Pricing: Dashboard-based pricing starting at $49/month for 10 dashboards; Standard plan at $409/month for larger dashboard counts; custom pricing available for enterprise needs
Best for: Freelancers and small agencies who prioritize ease of use
DashThis offers over 30 integrations with features including AI Insights in open beta, unlimited data sources per dashboard, and setup that can be completed in approximately 10 minutes.
Key features include:
- AI Insights Beta that generates automated analysis
- 50+ preset templates for rapid deployment
- Multi-source flexibility within single dashboards
- White-label capabilities across all tiers
- Unlimited integrations per dashboard
Strengths: Fastest setup time in the market, intuitive interface requiring minimal training, strong customer service, unlimited users and integrations per tier
Limitations: Dashboard-based pricing creates inefficiencies for agencies needing multiple dashboards per client. Fewer total integrations than enterprise competitors means niche platforms may not be supported. Limited customization beyond preset templates frustrates agencies wanting unique layouts. Not designed for deep data analysis or complex cross-platform attribution.
Best use case: Small agencies or freelancers wanting professional reports quickly without technical complexity. Perfect for agencies where speed matters more than customization depth.
Optmyzr Combines PPC Management with Reporting
Pricing: Tiered by monthly ad spend; Core/Essentials plan costs $208/month annually (or $249/month) for $10K in ad spend. Note that 2026 pricing includes overage fees for exceeding spend limits.
Best for: PPC specialists focused on Google Ads campaign management
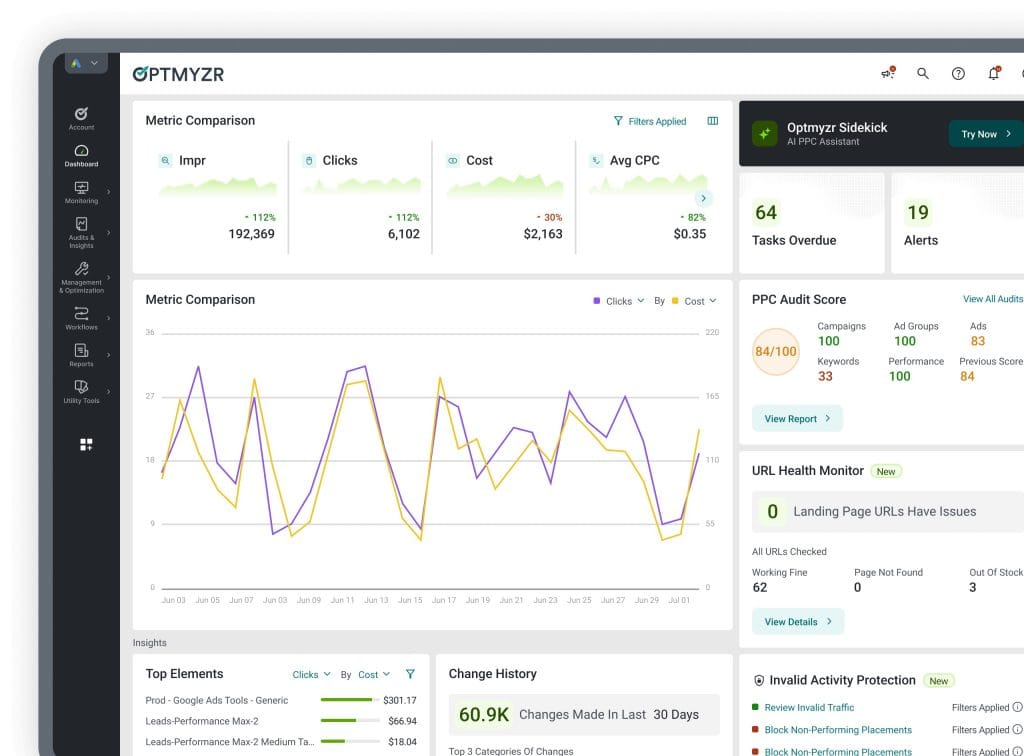
Founded by Frederick Vallaeys, who worked on Google AdWords, Optmyzr provides 50+ Enhanced Scripts (marketed as “Blueprints”), automated bid management tools, and advanced Google Shopping campaign builders alongside reporting capabilities.
Key features include:
- Rule Engine for creating custom automation with conditional logic
- Blueprints providing pre-built and custom scripts for automations like hourly dayparting and mobile bid optimization
- Shopping Campaign Builder that can auto-create granular product group structures
- Quality Score tracking and optimization
- Real-time data loading from Google Ads API
Strengths: Powerful automation capabilities, deep Google Ads expertise, combines optimization with reporting, real-time data access
Limitations: Learning curve for beginners means you’ll need technical PPC knowledge to maximize value. Complex interface requires time investment to master. Limited support for platforms beyond Google/Microsoft Ads (Facebook and Amazon available as add-ons but not core strengths). Feature differences between plan tiers create frustration when desired features require expensive upgrades. New overage fees in 2026 add unpredictability to monthly costs.
Best use case: PPC specialists managing significant Google Ads budgets who want both optimization and reporting in one platform. Best for agencies where campaign management efficiency matters as much as client reporting.
Google Provides Free Reporting Tools with Significant Limitations
Before investing in paid platforms, many agencies attempt to build reporting systems around Google’s native tools. Understanding what these free options can and cannot do helps you decide when the investment in paid software becomes worthwhile.
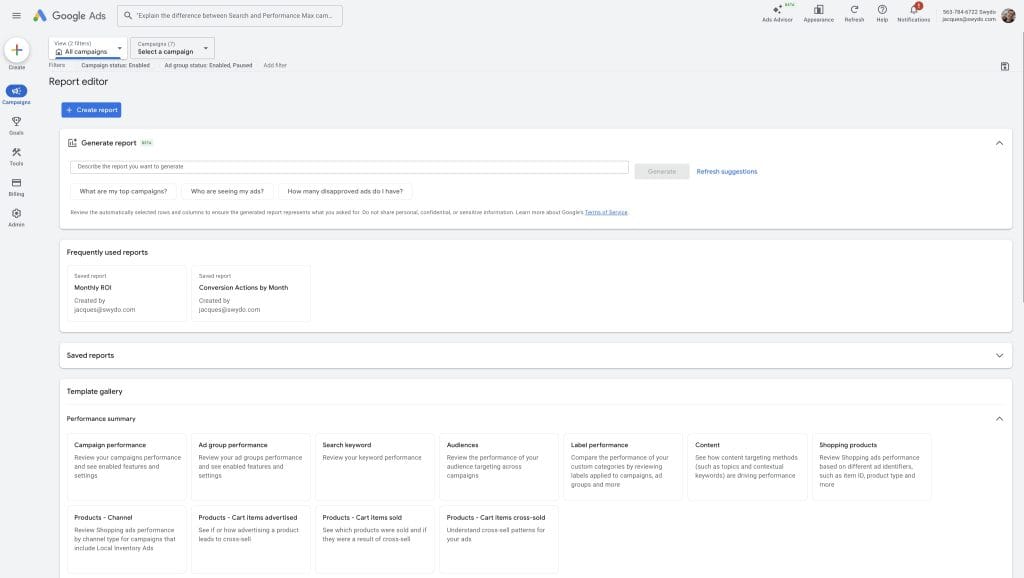
Google provides native reporting through Google Ads Report Editor, Google Looker Studio, and Google Analytics 4. These free options work for specific use cases but have important limitations.
Google Ads Report Editor handles single-platform reporting adequately with drag-and-drop functionality and scheduled delivery. However, it lacks cross-channel integration, provides limited multi-account visualization options (such as no secondary axis charts), and offers no white-labeling capabilities.
Google Looker Studio (formerly Data Studio) offers powerful visualization capabilities. The free version provides unlimited reports and over 20 native Google connectors. The Pro version at $9/user/month adds team workspaces and expanded scheduled deliveries.

The challenge with Looker Studio: it only includes Google data sources natively. Connecting Facebook, LinkedIn, or TikTok requires third-party connectors or tools like Supermetrics ($29-200+/month). There’s also a learning curve. Basic dashboards take 2-4 hours to build, while mastery requires weeks of practice according to user reviews.
When free tools work: Solo practitioners or small businesses with 1-5 accounts running Google-only campaigns, internal reporting rather than client deliverables, technical resources available, and straightforward conversion goals.
When agencies need paid tools: Managing 10+ client accounts, campaigns across multiple platforms, professional branded reports required, automated delivery expected, or white-label dashboards for client portal access.
Agency Size and Specialization Determine the Best Platform Choice
The right reporting platform depends less on which tool has the most features and more on how well it fits your agency’s size, specialization, and workflow. These guidelines help narrow your options based on your specific situation.
Small Agencies Need Fast Setup and Low Entry Costs
- 1-5 clients: Start with DashThis ($49/month) or Swydo ($69/month). Both offer fast setup, pre-built templates, and include white-labeling at entry levels.
- 10-25 clients: Consider Swydo ($189-614/month depending on data source count) or AgencyAnalytics ($79+ base with per-client fees). These provide scalability, team collaboration, and template systems.
- 50+ clients: Evaluate AgencyAnalytics at higher tiers or Whatagraph for enterprise needs. Look for dedicated support, bulk operations, and advanced automation.
Agency Focus Determines Required Features
- PPC-focused agencies: Swydo offers transparent per-source pricing that scales predictably for PPC work. Optmyzr adds campaign management if optimization matters as much as reporting.
- Full-service agencies: AgencyAnalytics or Whatagraph provide cross-channel reporting with comprehensive integration libraries. Watch for add-on costs that can increase monthly expenses.
- SEO and PPC agencies: Consider whether you need reporting aggregation (AgencyAnalytics pulls data from your existing SEO tools) or want to minimize tool subscriptions. Most agencies maintain separate SEO research tools (Ahrefs, Semrush) and use reporting platforms just for client deliverables.
Total Cost Calculations Reveal True Monthly Expenses
Look beyond advertised base pricing.
Consider per-client or per-source fees (the main cost driver), white-labeling costs (though most now include this), premium features or add-ons, additional user seats (most now offer unlimited), setup and implementation time, and annual versus monthly billing requirements.
For 50 clients with 4 data sources each (200 total sources):
- Swydo: approximately $774/month
- AgencyAnalytics: $79 base plus $20 per client (varies by plan structure) plus add-ons for rank tracking ($50/500 keywords) and site audits
- DashThis: custom pricing needed for this scale
Common Implementation Mistakes That Reduce Tool Effectiveness
Even agencies that choose the right tool often sabotage their success through predictable mistakes during setup and rollout. Avoiding these common errors significantly improves your chances of successful adoption and ROI realization.
Superficial Testing Leads to Post-Purchase Disappointment
Many agencies sign up based on marketing materials without testing with real client data. During trials, replicate your most complex client’s report completely. Verify that all needed metrics pull correctly and integration reliability meets your standards.
Setup Time Requirements Exceed Vendor Promises
Tools advertise “minutes to set up” but professional implementation takes time. Creating templates, configuring white-labeling, training team members, and testing accuracy requires 1-4 weeks for most platforms. Budget accordingly.
Integration Reliability Issues Appear After Trial Periods
Not all integrations are equal. Some platforms experience frequent disconnections requiring manual intervention. Test integrations over 7-14 days during trials and ask vendors about SLAs for fixing connection issues. Reviews consistently mention reliability problems across multiple platforms, particularly with data accuracy matching source platforms.
Feature Counts Distract from Usability Requirements
A tool with 100 integrations doesn’t help if you only need 10 platforms but the interface is too complex for your team to use efficiently. Prioritize usability and workflow fit over feature counts.
Support Quality Becomes Critical During Integration Failures
Submit actual support questions during your trial period. Check response times and solution quality. Poor support becomes critical when integrations break before client meetings.
Hidden Costs Inflate Monthly Expenses Beyond Budget
Read the fine print on add-on pricing. Platforms that advertise low base prices often charge extra for essential features like rank tracking, site audits, or advanced integrations. Calculate your total monthly cost including all add-ons you’ll actually need.
The Right Tool Depends on Your Agency’s Specific Situation
There’s no universally “best” SEM reporting tool. You need the best tool for your specific situation.
Start here if you’re new to automation: DashThis or Swydo at base pricing levels. Both offer straightforward setup, professional results, and reasonable costs. Begin with 3-5 clients, prove the value, then expand.
Scale to this for established agencies: Swydo provides predictable per-source pricing that grows with your agency without per-client fees. AgencyAnalytics or Whatagraph work when managing 20+ clients across multiple channels, though calculate total costs including add-ons before committing.
Consider this for PPC specialists: Swydo for straightforward PPC reporting with transparent pricing. Optmyzr when campaign optimization matters as much as reporting, particularly for Google Ads-focused work.
The successful pattern follows these steps: start with affordable, simple tools, validate ROI with pilot clients over 30-60 days, then upgrade strategically as your agency grows and reporting needs become more sophisticated.
Focus on tools that solve your immediate problems rather than future hypothetical needs. A $69/month tool you implement this week delivers more value than a $499/month tool you’ll adopt “eventually.” Choose simplicity over sophistication until your agency size and complexity genuinely require advanced capabilities.
SEM Reporting Tools FAQ
Direct answers to common questions about PPC and SEM reporting software for agencies
SEM reporting is the process of tracking and presenting data from paid search campaigns to measure performance against business goals. It combines metrics from platforms like Google Ads, Microsoft Advertising, Facebook Ads, and Google Analytics into consolidated reports that show clients how their ad spend translates to results like clicks, conversions, and revenue.
Manual reporting creates two problems: it’s time-intensive and error-prone. Research shows manual processes can consume up to 7.5 hours weekly. For agencies billing strategic work at premium rates, this represents significant opportunity cost. Automated tools also reduce data entry errors, ensure consistent formatting, and free your team to focus on strategy and optimization rather than copying numbers into spreadsheets.
Monthly reporting is standard for most retainer clients. Fast-moving campaigns or high-touch accounts may need weekly updates, while quarterly reports work for strategic planning discussions. The key is setting expectations upfront—clients who know when to expect reports ask fewer anxious questions between delivery dates. Many agencies also provide real-time dashboard access so clients can check results anytime without waiting for formal reports.
Dashboards show real-time data with interactive filters—they tell clients “what” is happening right now. Reports are curated documents with context, analysis, and recommendations—they explain “why” things happened and “what to do next.” Most agencies provide both: dashboards for clients who want to check metrics between meetings, and formal reports with strategic insights delivered on a schedule.
Looker Studio is only free when connecting to Google products (Google Ads, Analytics, Search Console). To pull data from Facebook Ads, LinkedIn Ads, Microsoft Ads, or TikTok, you need third-party connectors like Supermetrics ($29-200+/month). Once you add connectors, Looker Studio isn’t free anymore. It also has a steep learning curve—basic dashboards take 2-4 hours to build, and mastery requires weeks of practice.
For agencies with 1-10 clients, DashThis ($49/month for 10 dashboards) or Swydo ($69/month base) offer the best balance of simplicity, speed, and cost. Both include white-labeling at entry levels, have fast setup times, and provide pre-built templates. DashThis is fastest to set up (about 10 minutes). Swydo offers more flexible per-source pricing that scales predictably as you grow.
Swydo offers transparent per-source pricing ideal for PPC work, with features like Combined Data Sources (merge up to 5 ad platforms into single widgets) and Data Health Check for monitoring connections. If you also need campaign optimization features alongside reporting, Optmyzr provides 50+ automation scripts, bid management, and Quality Score tracking—though it has a steeper learning curve and is priced by ad spend.
AgencyAnalytics offers 80+ integrations with per-client pricing starting at $79/month—better for agencies wanting breadth of connections. Whatagraph starts higher ($286/month) but offers more advanced data blending, better visualizations, and dedicated Customer Success Managers. Key difference: AgencyAnalytics charges extra for rank tracking ($50/500 keywords) while Whatagraph includes more features in base pricing. Choose AgencyAnalytics for integration breadth; Whatagraph for sophisticated analytics and premium presentation.
The market divides into three tiers: Dedicated reporting tools (Swydo, DashThis, Whatagraph) at $49-500/month focus on dashboards and reports without research features. All-in-one platforms (Semrush, AgencyAnalytics) at $79-499/month bundle reporting with keyword research and rank tracking. Enterprise data infrastructure (Supermetrics, Funnel.io, TapClicks) at $300-3,000+/month serve as data pipelines for agencies with 50+ clients or complex data needs.
Entry-level tools start at $49-79/month (DashThis, Swydo, AgencyAnalytics base plans). Mid-tier options run $200-500/month for growing agencies. Enterprise solutions cost $300-3,000+/month. But advertised prices rarely tell the full story—always calculate your real cost by adding per-client fees, per-source fees, add-ons like rank tracking, and required third-party subscriptions. A “$79/month” tool can easily become $300+ when you add what you actually need.
Per-client pricing charges based on total clients regardless of data sources—simpler to calculate but expensive at scale. Per-source pricing (like Swydo) charges based on total data connections. For 25 clients using 4 platforms each (100 sources), Swydo costs about $474/month. For 50 clients (200 sources), it’s approximately $774/month. Per-source pricing often works out cheaper for agencies where clients use multiple ad platforms.
Watch for: rank tracking add-ons ($50/month per 500 keywords is common), site audit tools, third-party data subscriptions (Majestic for backlinks), premium integrations, overage fees for exceeding usage limits, and annual billing requirements that lock you in. Some platforms also charge extra for white-labeling or additional users. Always ask “what’s included?” and calculate your realistic monthly cost with all features you’ll actually need.
Track current time spent on manual reporting (exporting data, formatting, fixing errors). Multiply hours by your billable rate. If you save 5 hours weekly at $150/hour, that’s $3,000/month in recovered capacity. Compare against your tool cost. Most agencies see ROI within 2-3 months. Beyond time savings, factor in reduced errors, consistent delivery, and ability to serve more clients without adding headcount.
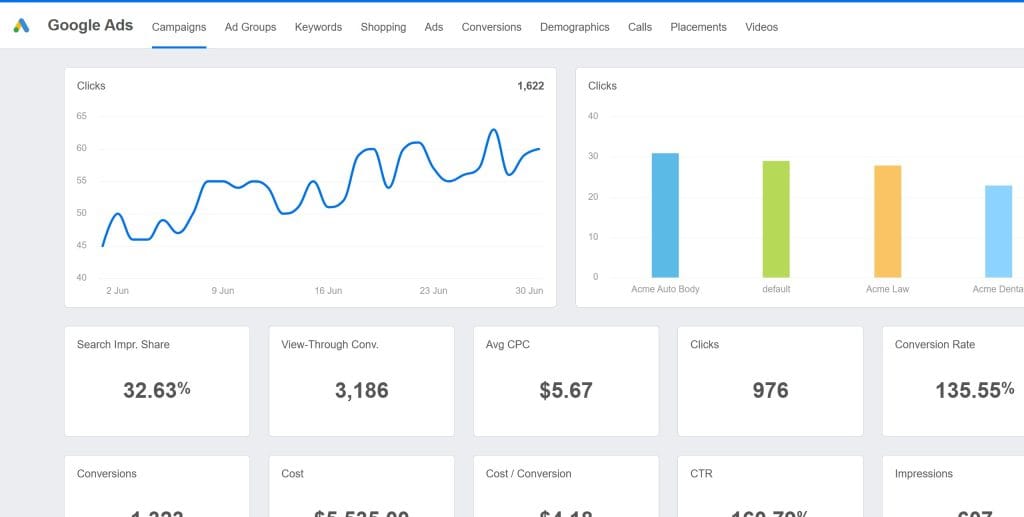
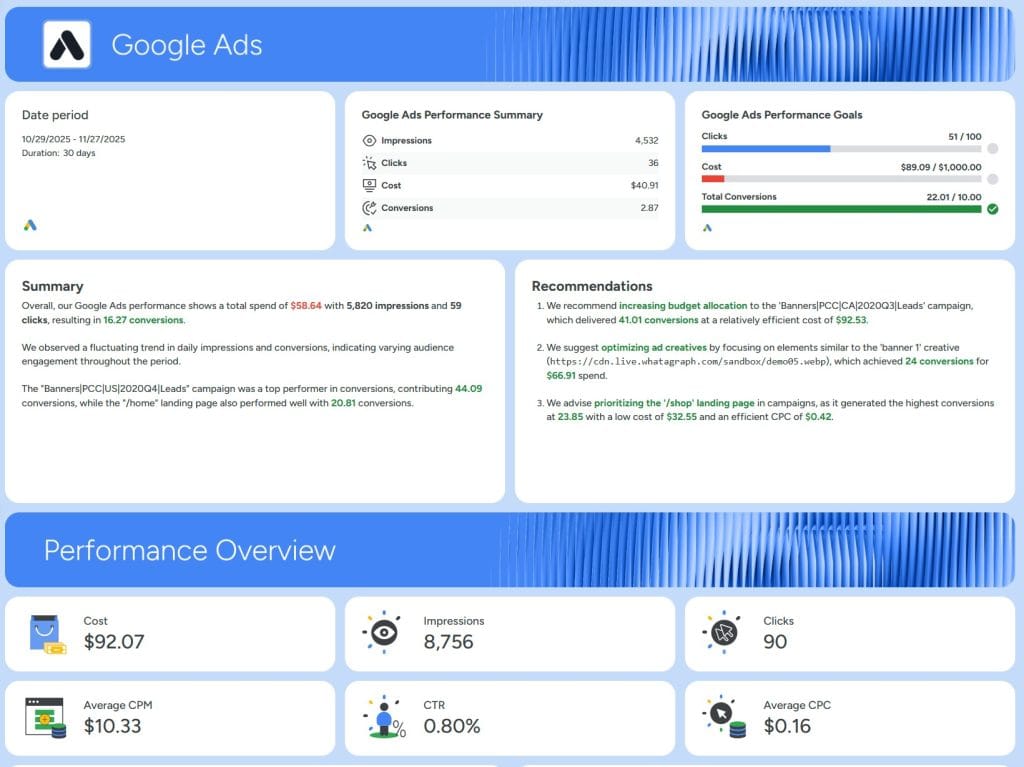
Essential metrics include: Conversions (the actions clients care about), Cost per Conversion/CPA (efficiency of spend), ROAS (revenue generated per dollar spent), CTR (ad relevance and engagement), CPC (cost efficiency), and Impression Share (competitive visibility). Match metrics to campaign goals—lead gen campaigns prioritize CPA and conversion rate; ecommerce focuses on ROAS and revenue.
A statistically significant CTR is 2% or above for search ads. Average CTR across industries is around 6.66% for search campaigns, but varies widely by industry and platform. Display ads typically see lower CTRs (0.5-1%). More important than hitting a benchmark: track CTR trends over time and compare against your own historical performance. A declining CTR signals ad fatigue or relevance issues.
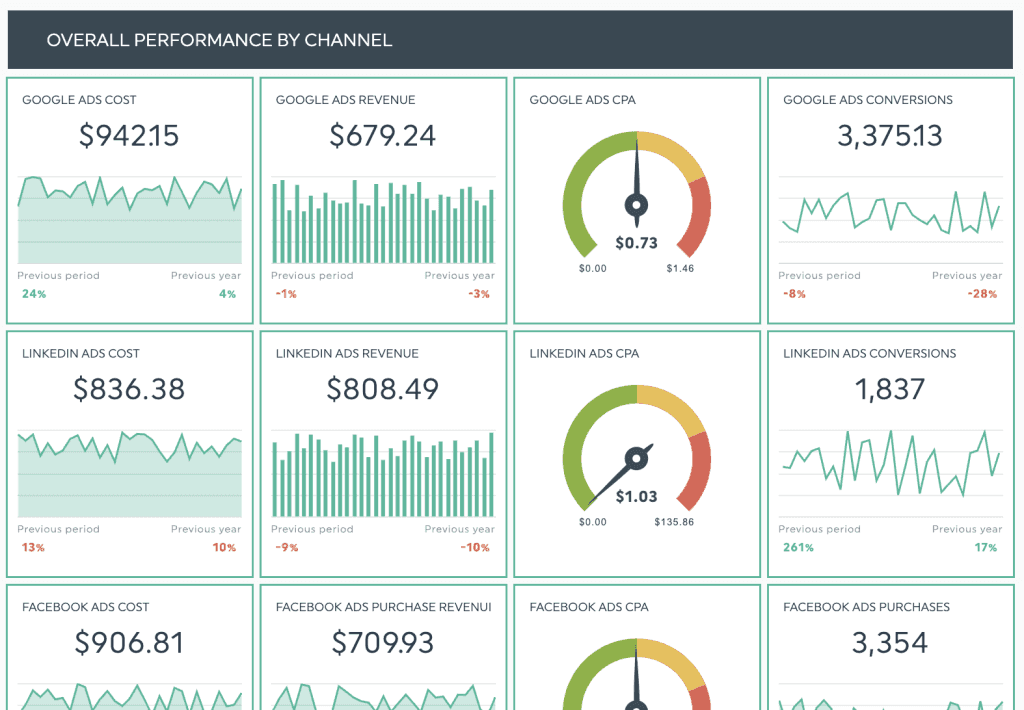
The average ROAS is 2.87:1 ($2.87 revenue per $1 ad spend), but “good” depends entirely on your margins. A business with 70% margins can profit at 2:1 ROAS, while one with 20% margins needs 5:1 or higher. Cross-industry benchmarks suggest 3.5:1 as a solid target. Always contextualize ROAS with profit margins—a lower ROAS on high-margin products may actually be more profitable than higher ROAS on low-margin items.
Keep reports to 8-15 pages total with a 1-2 page executive summary. Busy executives should get key insights in 3-5 minutes of reading. Structure reports so decision-makers find essential information quickly, with detailed sections for team members who need tactical details. Avoid data dumps—clients don’t need every metric, they need the story behind results and clear recommendations for what to do next.
CPC (Cost per Click) measures what you pay for each ad click—useful for managing budget and comparing keyword efficiency. CPA (Cost per Acquisition) measures total cost to acquire one conversion, calculated as (Total Spend ÷ Conversions). CPA is the more important metric because it shows actual cost to achieve business goals. A high CPC with strong conversion rates can still deliver good CPA and profitability.
Despite “minutes to set up” marketing claims, professional implementation takes 1-4 weeks. This includes: connecting data sources, building reusable templates, configuring white-label branding, training team members, and testing data accuracy against source platforms. Simple tools like DashThis achieve basic functionality faster, but creating polished client-ready templates still requires investment. Budget time realistically.
The top mistakes are: Superficial testing—signing up based on demos without testing real client data. Ignoring integration reliability—some platforms have frequent disconnections requiring manual fixes. Prioritizing features over usability—100 integrations don’t help if your team won’t use the tool. Missing hidden costs—not calculating total expense with add-ons. Skipping support evaluation—poor support becomes critical when integrations break before client meetings.
During free trials: replicate your most complex client’s report completely, verify all metrics match source platforms, test integrations for 7-14 days to catch reliability issues, submit actual support questions to evaluate response quality, and calculate your real cost including all needed add-ons. Run reports in parallel (new tool alongside your current process) during the first month to validate accuracy before switching completely.
Common causes: different data refresh timing (third-party connectors refresh at different rates than native sources), attribution model differences between platforms, date range handling variations, timezone mismatches, and currency conversion errors. Some variance is normal—but significant discrepancies indicate integration problems. Test accuracy during trials and document any known differences to explain to clients.
Consider paid tools when: you’re managing 10+ client accounts, running campaigns across multiple platforms (not just Google), clients expect professional branded reports, you need automated delivery on a schedule, or you want client portal access with white-label dashboards. If you’re spending more than 5 hours weekly on manual reporting, the time savings alone typically justify a $69-200/month tool investment within the first month.
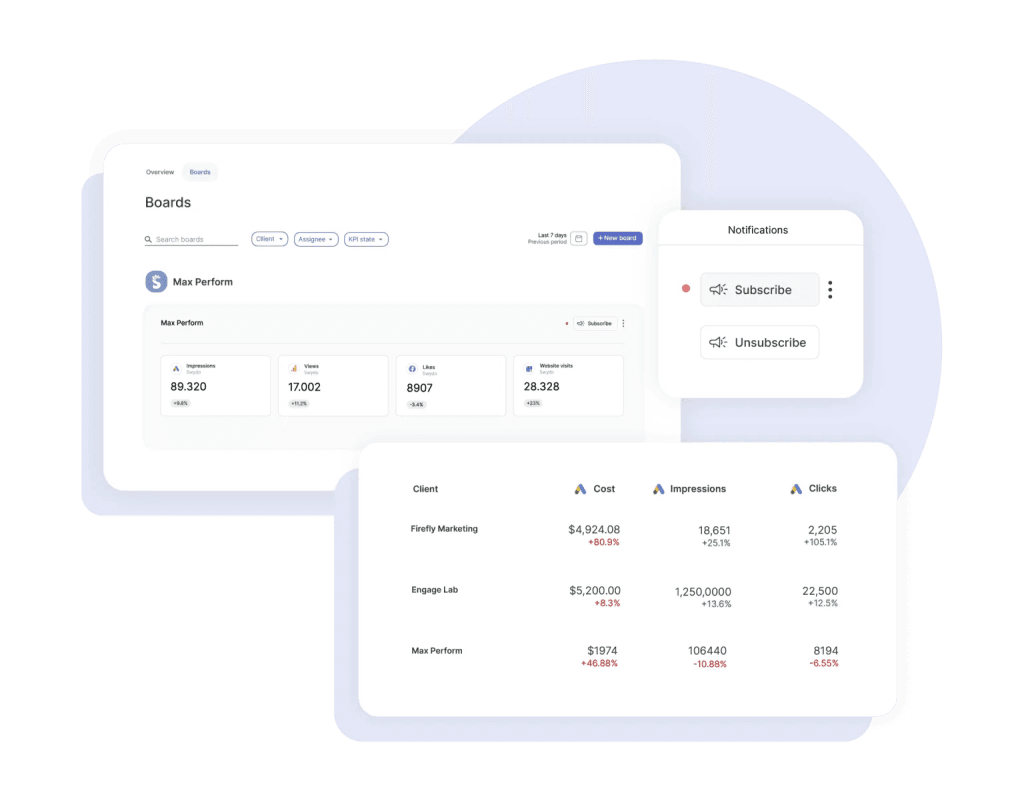
Consolidate all your clients’ PPC data into one monitoring overview—no more checking each account one by one.
Start Your Free Trial Today