
Brand awareness metrics measure how many people in your market know your brand exists, how easily it comes to mind when they need what you sell, and whether that familiarity is growing. The useful ones fall into three groups: what people say (surveys), what people do (search, traffic, social and AI-assistant behavior), and what your campaigns cause (lift studies and holdout tests).
Most teams only track the middle group. It’s free and it updates daily. That’s a fine place to start, but it’s why so many brand awareness reports feel thin. A follower count and a reach number don’t prove anyone remembers you.
In this guide
- The three kinds of brand awareness evidence and when to use each
- Every metric worth tracking, with the formula and what it can’t tell you
- What a realistic “good” score looks like
- The mistakes that make awareness reports fall apart
- A one-page structure for reporting awareness to clients
A quick analogy, and then we’ll get practical. A physical doesn’t diagnose you from one number. Blood pressure, a heart-rate monitor worn for a week, and a stress test each answer a different question. Brand awareness works the same way. A survey is the blood pressure reading. Branded search is the monitor. A lift study is the stress test. Any one of them alone will mislead you eventually.
Why Brand Awareness Metrics Matter More Than Most Agencies Admit
Brand awareness metrics matter because most of your market isn’t buying today, and the brands they remember when they finally are win the deal before sales gets a call.
Quick take
- Only about 5% of B2B buyers are in market in a given quarter. Awareness is how you reach the other 95%.
- Awareness gains translate into share of search, and share of search leads market share.
- Clients underfund brand because nobody proves it works, not because they don’t believe in it.
Most of your market isn’t buying right now
Share of B2B buyers in market for services they replace roughly every five years
In market this quarter
~5%
In market this year
~20%
Not in market this quarter
~95%
Performance campaigns compete for the 5%. Brand awareness is how you reach the other 95% before they’re ready to buy.
Source: the Ehrenberg-Bass Institute’s 95:5 research for the LinkedIn B2B Institute. Figures are a planning heuristic and vary by category.
In research for the LinkedIn B2B Institute, the Ehrenberg-Bass Institute found that companies switch providers of services like banking, software and legal advice roughly every five years. That puts about 20% in market in a given year and only around 5% in a given quarter. Your performance campaigns fight over that 5%.
The commercial link isn’t theoretical anymore. For the Return on Awareness study Tracksuit published with Google, Google merged Tracksuit’s always-on brand tracking data with its own aggregated search data for 31 brands across 15 categories in Australia and New Zealand, covering July 2024 to June 2025. Every five points of awareness growth produced roughly five points of share of search when brands started early, with the lift tapering as brands matured. Two markets and 31 brands is not a universal law, but it’s the most direct awareness-to-search evidence published so far.
Now the uncomfortable part. In the Fall 2024 CMO Survey, marketers said their ideal split is 50% brand building and 50% short-term performance. Their actual split is 31.2% brand and 68.8% performance. That gap isn’t a belief problem. It’s a proof problem.
The gap between the budget marketers want and the one they fund
Split of marketing budget between long-term brand building and short-term performance
Brand building
Short-term performance
Ideal
Actual
Marketers fund brand building at 18.8 points below where they say it should be. Better awareness reporting is how agencies close that gap.
Source: the Fall 2024 CMO Survey from Duke University’s Fuqua School of Business.
Compare two lines from a report for a coffee subscription client:
| The usual version | The version that renews the retainer |
|---|---|
| “2.1 million impressions this quarter.” | “Unaided awareness in our 25 to 44 target went from 6% to 11% over two quarters. Branded search grew 38% while category search was flat. Share of search is now 14%, up from 9%.” |
Same campaign. One of those is evidence.
The Say, Do, Prove Framework for Brand Awareness Measurement
Say, Do, Prove is our name for a simple sorting rule: group every brand awareness metric by the kind of evidence it gives you, so you always know how much weight a number can carry.
| Layer | The question it answers | Where it comes from | Cadence |
|---|---|---|---|
| Say | What do people remember? | Surveys, brand trackers | Quarterly, or continuous if funded |
| Do | What do people do? | Search Console, Trends, GA4, listening tools, AI visibility tools | Monthly |
| Prove | What did the campaign cause? | Lift studies, geo-holdouts, marketing mix models | Per campaign flight |
Each layer fixes a weakness in the one before it. Surveys tell you what people remember, but they’re slow and cost money. Behavioral data is fast and free, but it can’t tell you why a line moved. Experiments tell you why, but they need budget and planning, and they only measure the campaign you ran.
The rest of this guide walks through each layer, then shows you how to combine them in a client report.
The Say, Do, Prove Framework
Three kinds of evidence, three cadences. Each layer fixes a weakness in the one before it.
What do people remember?
Unaided awareness
Aided awareness
Top-of-mind awareness
Consideration and preference
LimitSlow and costs money. Measures memory, not behavior.
What do people do?
Branded search vs. category
Share of search
Social share of voice, mentions
AI share of voice
Direct + branded organic traffic
LimitFast and free, but can’t tell you why a line moved.
What did the campaign cause?
Brand lift (recall, awareness, consideration)
Search lift
Geo-holdout results
Marketing mix model brand effect
LimitNeeds budget and planning. Measures one campaign, not the brand.
Believed by the CFO
Moves first, reported monthly
Answers “did it work?”
Say Metrics That Come From Surveys
Survey-based awareness is the only way to measure what actually lives in someone’s memory. That’s why serious brand marketers keep it even when it’s inconvenient.
Quick take
- Unaided awareness is the honest number. Aided awareness is the flattering one.
- The gap between them is a diagnosis, not a rounding error.
- Ask unaided first. Freeze the wording. Keep the sample consistent.
Unaided Awareness
Unaided (spontaneous) awareness is the percentage of people who name your brand when asked an open question like “Which coffee subscription brands can you think of?” with no list to pick from.
It measures recall, not recognition. It can’t be gamed by a logo that looks familiar. And it’s the hardest metric on this page to move.
Always ask the unaided question first. If respondents see your brand in a list before the open question, the result is contaminated.
Aided Awareness
Aided (prompted) awareness is the percentage of people who say they’ve heard of your brand when shown its name in a list of competitors.
It always reads higher than unaided awareness for the same brand. That’s the point. The gap tells you something:
- High aided, low unaided. Recognizable but not memorable. A creative and distinctiveness problem, not a reach problem.
- Both low. A reach problem. Spend on breadth first.
- Both high, flat. You’ve saturated the easy audience. Move the goal to consideration.
Never put aided and unaided numbers on the same trend line. They measure different things, and mixing them is the fastest way to make a chart lie.
Top-of-Mind Awareness
Top-of-mind awareness is the share of respondents who name your brand first in the unaided question.
In most categories it’s a single-digit number for everyone but the leader. It’s the best single proxy for what the Ehrenberg-Bass Institute calls mental availability: how likely your brand is to surface in a real buying moment.
Brand Consideration and Preference
Consideration (“Which of these would you consider?”) and preference (“Which would you choose?”) sit downstream of awareness. They aren’t awareness metrics, strictly. They belong in the same survey because awareness that never turns into consideration is a positioning problem you want to catch early.
How to Run a Brand Awareness Survey Properly
A brand awareness survey is worth the money only if four things hold: a representative sample, identical wording across waves, unaided before aided, and enough respondents to see real change instead of noise.
- Define the population before the sample. “Adults 25 to 54 who bought coffee online in the last six months” is a population. “People on the internet” isn’t. Hold it constant across waves.
- Size the sample to the decision. Consumer trackers survey thousands per wave so they can cut by segment. B2B rarely gets that. Aim for a few hundred per segment you plan to report on and accept wider error bars.
- Order the questions. Unaided, then aided, then consideration and preference, then associations. Randomize the brand list in the aided question.
- Freeze the wording. The most common mistake in brand tracking is “improving” a question between waves. Change the wording and the trend line breaks.
- Pick a cadence and keep it. Quarterly waves are the floor. Always-on trackers (Tracksuit, Latana, Attest and others) field continuously and roll results monthly, so you can see a campaign land instead of guessing from two points a year apart.
On cost, most vendors quote rather than publish. Enterprise trackers from firms like Kantar or Ipsos have historically run into six figures a year. Always-on platforms changed the math. Based on the pitch deck Tracksuit used to raise funding, Adweek reported that its subscription runs around $19,000 a year. Treat that as a reference point, not a list price.
Do Metrics That Come From Behavior
Behavioral awareness metrics measure what people do when they already know your brand: search for you by name, type your URL, mention you, or ask an AI assistant about you.
Quick take
- Free, daily, and available from connections you already have.
- Every one of them needs a control (category or competitor) to mean anything.
- Impressions, reach and followers are exposure metrics. They go in the appendix.
Branded Search Volume
Branded search volume is the number of searches that include your brand or product names in a period. People search a name because it’s in their head, which makes it the closest free proxy for recall. It’s a proxy, though, not proof: news, job hunting, complaints and competitor ads all drive branded searches too.
- Where to get it: Google Search Console (impressions and clicks on branded queries), Google Trends (relative interest), Semrush or Ahrefs (estimated volume).
- Formula worth reporting: branded search growth minus category search growth over the same window.
- What it can’t tell you: why it moved. A competitor outage, a PR story or a price change all spike branded search.
One caution on branded clicks. According to a zero-click study from SparkToro using Similarweb data, 68.01% of U.S. Google searches ended without a click in the first four months of 2026, up from 60.45% in 2024. That figure covers all searches, and branded queries click through at higher rates than generic ones, but the direction is the same for both: awareness gains increasingly show up as impressions, not sessions.
So if you’re still judging brand health by branded organic traffic in GA4, you’re measuring a shrinking slice of a growing pie. Report Search Console impressions for branded queries as the primary number. Clicks are secondary.
Share of Search
Share of search is your brand’s search volume divided by the total search volume for all brands in your category. It’s the behavioral cousin of share of voice, and the one brand metric with published evidence that it predicts market share.
Formula: share of search = your branded searches ÷ (branded searches for every brand in the set) × 100
What the research says:
- Les Binet presented the metric at the IPA’s EffWorks Global 2020 conference after six years of testing. As the IPA reported, share of search in automotive, energy and mobile handsets correlated with market share and led it: by about nine to twelve months in cars, about six months in handsets, zero to three months in energy.
- Marketing Week reported on follow-up work by James Hankins for the IPA. Across 30 cases in 12 categories and seven countries, share of search typically ran at about 83% of a brand’s market share, and when one moved, the other tended to move with it. The ratio varied by category and market, and the researchers stress these are correlations, not causal relationships.
You can approximate it free in Google Trends by comparing up to five brand terms and normalizing. Trends gives relative interest, not true volume, and Semrush or Ahrefs volumes are modeled estimates, so treat the result as a trend rather than a precise share.
Two cautions. The competitive set is a judgment call, and a bad set makes the number meaningless. And negative news drives searches too, so a spike during a recall isn’t good news. Binet calls the metric powerful but not a silver bullet. He’s right.
Share of Voice on Social
Social share of voice is the percentage of all category conversation on social platforms that mentions your brand.
Formula: share of voice = your mentions ÷ (your mentions + all tracked competitor mentions) × 100
You need a listening tool for this (Brandwatch, Brand24, Sprout Social, Talkwalker and others), and you need to know its blind spots:
- Platform API restrictions have made X and Reddit coverage patchy in many tools.
- Automated sentiment scoring is wrong often enough that you should spot-check before it goes in front of a client.
A clean rule: report mention volume and share of voice as awareness metrics. Report sentiment only after a human has sampled it. If you’re choosing a tool, our roundup of the best social media monitoring tools covers what each one actually tracks.
Direct Traffic
Direct traffic is sessions where GA4 can’t identify a referrer. It’s supposed to mean someone typed your URL. In practice it’s the noisiest metric on this list.
What lands in Direct that has nothing to do with awareness:
- Links opened from apps and PDFs
- Email clients that strip referrers
- A growing share of visits from AI assistants
Its trend still carries some signal if your tracking didn’t change. Report it with a caveat, or fold it into one “came looking for us” number: direct plus branded organic. If you’re unsure which numbers belong to which tool, the differences between GA4 vs Google Search Console matter more here than anywhere else.
Mentions, Earned Media and Referring Domains
Brand mentions across news, blogs, podcasts and forums, plus new referring domains, are earned-media awareness signals. They move slowly, which makes them a quarterly trend rather than a monthly one. Ahrefs, Semrush, Mention and Brand24 all track them.
Follower Growth, Reach and Impressions
Everyone reports these. Almost nobody should lead with them.
- Reach and impressions measure exposure, which is an input to awareness, not awareness.
- Follower growth measures a decision to follow. It correlates with awareness and is trivially inflated by giveaways.
Put them in the appendix. Our guide to vanity metrics goes deeper on why they feel good and prove little.
AI-Assistant Visibility
AI visibility is how often, and how favorably, your brand appears in answers from ChatGPT, Perplexity, Gemini, Claude and Google’s AI Overviews when someone asks a category question. For many B2B and software categories, that’s already where early research happens.
Formula (AI share of voice): prompts where your brand is mentioned or cited ÷ total prompts in the set × 100, tracked per engine
Tools that track it include Ahrefs Brand Radar, Profound, Otterly, Semrush’s AI toolkit and CiteTrack AI. Two honest caveats:
- Methodologies differ enough that numbers aren’t comparable across tools.
- Answers drift month to month, so one reading tells you little.
Track it as a trend on a fixed prompt set. Treat it the way you’d have treated share of search in 2020: promising, early, not yet a headline.
Brand awareness metrics at a glance
What each one measures, where it comes from, and what it cannot tell you.
| Metric | How it’s calculated | Data source | Cadence | What it can’t tell you |
|---|---|---|---|---|
| Unaided awareness Say | % naming your brand from an open category question | Survey, brand tracker | Quarterly / always-on | Whether they’d consider you |
| Aided awareness Say | % recognizing your brand from a list | Survey, brand tracker | Quarterly / always-on | Whether they’d recall you unprompted |
| Top-of-mind Say | % naming your brand first, unaided | Survey, brand tracker | Quarterly / always-on | Anything for brands outside the top 3 |
| Branded search vs. category Do | Branded impressions growth minus category growth | Search Console, Trends | Monthly | Why it moved (PR, outage, price) |
| Share of search Do | Your branded searches ÷ all brands’ branded searches × 100 | Google Trends, SEO tools | Monthly | Good news from bad (recalls spike it too) |
| Social share of voice Do | Your mentions ÷ all tracked brands’ mentions × 100 | Social listening tool | Monthly | Sentiment, without human checking |
| AI share of voice Do | Prompts mentioning you ÷ prompts in set × 100, per engine | AI visibility tool | Monthly (trend only) | A precise level; answers drift |
| Direct + branded organic Do | Sessions with no referrer plus branded organic sessions | GA4 | Monthly | Who actually typed your URL |
| Ad recall lift Prove | Exposed group recall % minus control group recall % | Platform brand lift study | Per flight | Brand health beyond that campaign |
| Search lift Prove | Branded search increase in exposed vs. control | Google Ads lift study | Per flight | Effects on channels Google didn’t serve |
Impressions, reach and follower counts are intentionally absent. They measure exposure and are supporting data, not awareness metrics.
Prove Metrics That Come From Experiments
Experiment-based metrics are the only ones that let you say “our campaign caused this” instead of “this happened while our campaign ran.”
Quick take
- Brand lift studies are free on the platforms but need minimum spend to work.
- Underfund a study and you don’t get a smaller answer. You get no answer.
- Geo-holdouts work for any channel. Marketing mix models work for big budgets.
Brand Lift Studies
A brand lift study randomly splits your audience into a group that sees your ads and a control group that doesn’t, surveys both shortly after, and reports the difference in ad recall, awareness, consideration or intent. That difference, in percentage points, is the lift.
Each platform runs its own, and each has minimums that exist for statistical reasons, not billing reasons.
| Platform | How to run it | Minimum spend | Notes |
|---|---|---|---|
| Google / YouTube | Experiments section in Google Ads, on video and Demand Gen | $10,000 over 10 days in the U.S. for one question, per Google’s Brand Lift setup guide; varies by country and rises with more questions | Search Lift is included at no extra spend once you qualify. Access usually goes through a Google rep. |
| Meta | Experiments in Ads Manager (brand survey test) | Set per country based on the responses needed for significance, per Meta’s Brand Lift requirements | Needs a sustained flight of a few weeks. Exclude the study audience from other campaigns during the test. |
| TikTok, LinkedIn | Through platform sales teams | Platform-specific thresholds | Ask before you plan the flight. |
| Third party (Nielsen, Kantar, others) | Priced per study | Higher cost | Measures across channels, which platform studies can’t. |
Two Google details worth knowing. According to Google’s lift measurement documentation, at the recommended budget you can expect to detect lift once you have roughly 4,100 survey responses per metric, and if nothing shows after 16,800 responses you may not be able to detect lift at all.
For reference points when a client asks “is this number good?”: Nielsen’s analysis of more than 1,000 U.S. campaigns in podcasts, influencer content and branded content found brand recall drives 38.7% of lift in those channels, ahead of baseline awareness at 37.5%. Aided recall ran at 71% for podcast ads, 79% for influencer marketing and 81% for branded content.
What a lift study can’t tell you: whether the brand as a whole is healthier. It measures one campaign on one platform. Pair it with your Say and Do metrics.
Geo-Holdout Tests
A geo-holdout runs the brand campaign in some matched markets and withholds it in others, then compares branded search, direct traffic or sales between the groups.
- Works for any channel, including ones with no native lift product (out-of-home, radio, podcasts, sponsorships).
- Needs no survey.
- The trade-off: you’re deliberately not advertising somewhere for a few weeks. Some clients find that hard even when the math is clear.
Marketing Mix Modeling
Marketing mix modeling (MMM) uses regression on historical spend and outcome data to estimate what each channel contributed, including long-term brand effects.
It’s the right tool when a client spends across many channels and wants a defensible allocation. It’s overkill for a $20,000-a-month account. Open-source options like Meta’s Robyn and Google’s Meridian have made it far cheaper, but you still need a couple of years of clean weekly data.
What Is a Good Brand Awareness Score?
There is no universal “good” brand awareness score. Awareness is relative to your category, your competitors and your starting point. Anyone who gives you a single number without asking what you sell is guessing.
Quick take
- Benchmark growth, not level.
- Five points of awareness gain in a year is outstanding in most categories.
- Compare to the brand one place above you, not the leader.
Tracksuit, which tracks thousands of brands continuously, publishes category growth benchmarks. According to Tracksuit’s guide to brand benchmarks, a five-percentage-point annual increase in awareness is considered outstanding in many categories, and in crowded categories like packaged goods, simply maintaining awareness counts as acceptable.
That reframes the client conversation. “Double awareness this year,” from 20% to 40%, almost never happens without a very large budget.
Rules of thumb for reading survey numbers:
| If you see | It usually means | Do this |
|---|---|---|
| Aided awareness above ~40% | Easy reach is saturated | Make unaided awareness the headline metric |
| Large aided-to-unaided gap | Memorability problem | Fix distinctive assets and creative consistency, not reach |
| Leader above 90% aided | Normal in mature consumer categories | Stop comparing to the leader; compare to the next brand up |
For behavioral metrics the benchmark is always internal and relative: your branded search growth vs. the category, your share of search vs. last quarter, your share of voice vs. the competitor you want to displace. Absolute numbers without a comparison aren’t benchmarks. They’re trivia.
Which Brand Awareness Metrics Fit Which Business
The right brand awareness metrics depend less on industry than on how people buy: how often, how long they research, and where that research happens.
| Business type | Lead with | Support with | Skip unless funded |
|---|---|---|---|
| B2B SaaS and services | Unaided awareness in the ICP, branded search vs. category, AI share of voice | LinkedIn mentions, referring domains, G2 and Capterra presence | Consumer-panel trackers (wrong population) |
| Consumer ecommerce | Share of search, aided and unaided awareness, branded search impressions | Social share of voice, UGC volume, review growth | Geo-holdouts (until spend justifies it) |
| Local and multi-location | Google Business Profile impressions, branded local search, review volume | Direct traffic, local mentions | National surveys |
| Consumer packaged goods | Always-on tracker, share of search, penetration | Brand lift per flight, retail recall studies | Follower counts |
| Agencies reporting to clients | Branded search vs. category, share of search, one survey metric | Share of voice, mentions, lift per campaign | Anything you can’t explain in one sentence |
One note on the B2B row. B2B buyers tend to shortlist before they ever talk to a vendor. So unaided awareness inside the buying committee is worth far more than general awareness in the market. A tracker that surveys “U.S. adults” tells a cybersecurity vendor nothing. Survey the 400 IT directors who matter.
Common Brand Awareness Measurement Mistakes
Most brand awareness reporting fails not because the metrics are wrong but because they’re presented without the context that gives them meaning.
| Mistake | Why it hurts | Fix |
|---|---|---|
| Reporting impressions as awareness | Impressions count ad serves, not memory. Recall drives lift, not exposure. | Lead with recall or share metrics; impressions go in the appendix |
| Branded search growth with no control | If category search rose the same amount, you did nothing | Show category or a competitor on the same chart |
| Aided and unaided on one chart | Different questions, different meaning | Two charts, always |
| Changing the survey wording | Every change resets the trend | Freeze it |
| Measuring too soon | Brand effects compound over quarters | Set expectations in quarters; report leading indicators monthly |
| Trusting direct traffic | Referrer loss made Direct a catch-all bucket | Use the trend, never the level, and never call it “typed our URL” |
| Trusting automated sentiment | Tools misread tone often | Sample by hand before reporting |
| Twelve awareness KPIs on one page | The client remembers none of them | Three to five, rest in appendix |
| Ignoring competitors | You can grow and lose share at the same time | Relative metrics only |
| Treating AI visibility as precise | Methodologies differ, answers drift | Report trend on a fixed prompt set |
Which of these is in your current client report? If the answer is two or three, you’re in good company. Most of them are formatting fixes, not data fixes.
How to Report Brand Awareness to Clients
A brand awareness report works when it separates leading indicators from lagging ones, compares everything to a control, and connects awareness to something the client already cares about, like pipeline or share of market.
Quick take
- One headline number with one comparison.
- Leading indicators monthly, lagging indicators quarterly.
- End with the bridge to revenue.
The structure that survives a client meeting has four layers:
- Headline metric with context. One number, one comparison, one sentence. “Share of search: 14.2%, up from 9.8% two quarters ago, now second in the set.”
- Leading indicators (monthly). Branded search impressions vs. category, share of search, social share of voice, AI share of voice trend, new referring domains.
- Lagging indicators (quarterly). Aided and unaided awareness, consideration, and brand lift from that quarter’s flights.
- The commercial bridge. Conversions from branded search, direct-plus-branded-organic revenue, and for B2B, opportunity creation and win rate in brand-exposed accounts vs. the rest.
Set Up the Monthly Layer
Most of the monthly data lives in platforms you’re already connected to.
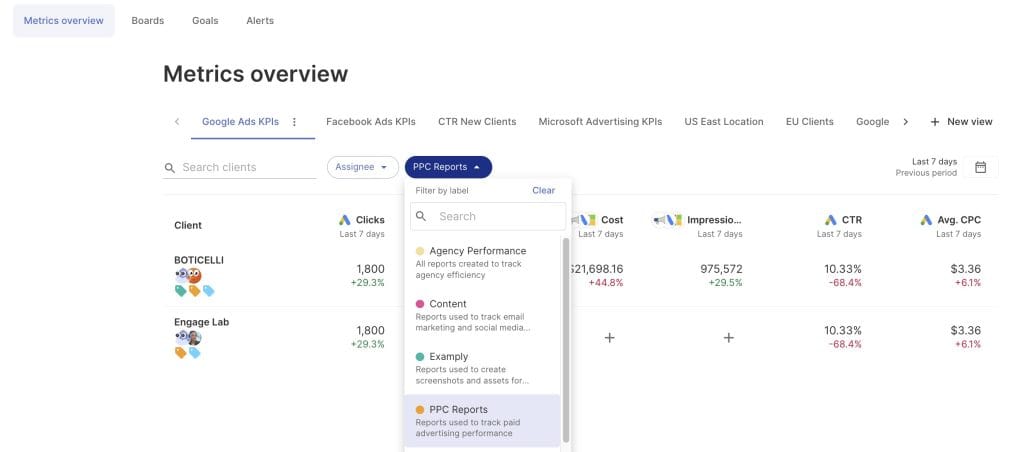
In Swydo, add Google Search Console to Metrics Overview. You get branded impressions, clicks and average position across every client in one view, filtered by client label, without opening 40 Search Console properties on a Monday morning.
Then turn the two numbers that matter most into targets:
- Goal. Open Monitoring → Goals → +New Goal. Pick the client, the Search Console data source, and set a quarterly target on branded impressions, for example “greater than 120,000 for Q4.” Goals shows On Track, Off Track or Achieved, and the Recent Periods Overview surfaces prior quarters’ actuals while you set the target, so you benchmark against history rather than a guess.
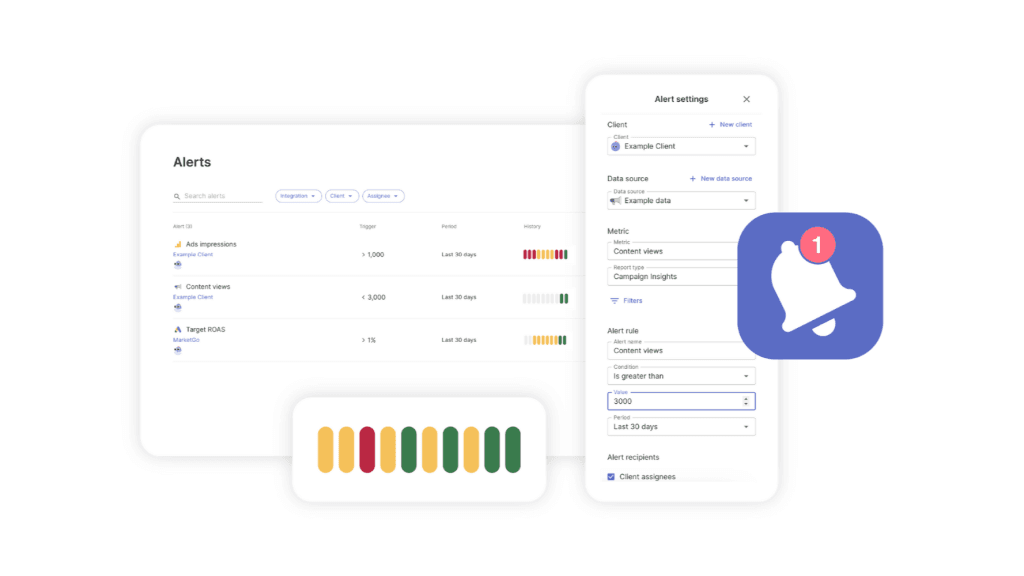
- Alert. Set an Alert on branded impressions with a 30-day trigger window and a drop threshold. Awareness rarely collapses overnight, but a tracking break, a domain migration or a competitor’s aggressive branded bidding can quietly erode it. An email or Slack notification the day it starts beats discovering it in a quarterly review.
If you’re weighing which metrics deserve an alert versus a monthly chart, our guide on monitoring vs reporting draws the line.
Add Survey, Listening and AI Search Data to the Same Report
Your survey and social listening numbers belong next to your search data, not in a separate deck. Two features get them there:
- Google Sheets for data that updates regularly. Put share of voice, mention counts or AI share of voice from your listening or AI visibility tool into a Google Sheet and connect the sheet to Swydo as a data source. Pair the sheet with Zapier or Make and new results land in it automatically, so the report stays current without anyone copying numbers each month.
- Manual KPIs for quarterly survey results. Aided and unaided awareness change once a quarter, so enter them as manual KPIs. They sit alongside branded search in the same report your client already opens.
For AI search, the Semrush integration already reports how many of a site’s keywords trigger a Google AI Overview and which keywords they are. That gives you one AI visibility signal in the report from a connection many agencies already have.
Deliver It as One Story
Give each client one link. Client Portal puts their reports, monitoring boards and goals behind a single password-protected, branded URL, so the awareness story sits next to the performance story instead of arriving as a separate PDF.
For the scheduled monthly email, drop in the AI Summary block. The first thing the client reads is a plain-English take on what moved and why, before they open the report. Our piece on client reporting best practices covers the cadence and expectation-setting conversation that goes with it.
One-page brand awareness report, top to bottom
Leading indicators up top so the client sees direction; lagging indicators below so the CFO sees proof; a commercial bridge so it ties to revenue.
Headline
Share of search 14.2%, up from 9.8% two quarters ago. Now #2 in the set.One number. One comparison. One sentence.
Leading
Behavioral signals vs. a control
Branded impressions vs. category · Share of search trend · Social share of voice vs. named competitor · AI share of voice trend · New referring domains
Monthly · Search Console, Trends, listening tool · Goals and Alerts live here
Lagging
Survey and experiment results
Aided awareness · Unaided awareness (separate chart) · Consideration · Brand lift from this quarter’s flights, in percentage points
Quarterly · Brand tracker, platform lift studies · Added as manual KPIs
Bridge
Where awareness meets revenue
Conversions from branded search · Direct + branded organic revenue · B2B: opportunities and win rate in brand-exposed accounts vs. not
Quarterly · GA4, CRM
Appendix
Impressions, reach, follower growth, engagement. Available on request, never the headline.
One opinion to close the section. Agencies should stop apologizing for brand metrics being “soft.” A share of search number built from real search behavior, benchmarked against named competitors, with a published correlation to market share across 30 IPA cases, is at least as solid as most of the attribution models clients accept without blinking. Present it that way.
Which Tools Measure Brand Awareness
Brand awareness tooling splits into seven categories, and no single tool covers more than two of them well.
| Category | Examples | What it measures | Watch out for |
|---|---|---|---|
| Brand tracking (surveys) | Tracksuit, Latana, Attest, YouGov BrandIndex, Kantar, Qualtrics | Aided and unaided awareness, consideration, preference, associations | Cost; sample sizes per segment; most quote rather than publish pricing |
| Social listening | Brandwatch, Brand24, Sprout Social, Talkwalker, Meltwater, Mention | Mentions, share of voice, reach, sentiment | Sentiment accuracy; API gaps on X and Reddit |
| Search and SEO | Google Trends, Google Search Console, Semrush, Ahrefs | Branded search, share of search, referring domains | Trends is relative; category definition is subjective |
| Web analytics | GA4, Similarweb | Direct traffic, branded organic, new vs. returning | Referrer loss inflating Direct; Similarweb is modeled |
| Platform lift studies | Google/YouTube Brand Lift, Meta brand survey tests, TikTok, LinkedIn, Nielsen | Recall, awareness and consideration lift, search lift | Minimums; platform grades its own media; single-channel view |
| AI visibility | Ahrefs Brand Radar, Profound, Otterly, CiteTrack AI, Semrush AI toolkit | Mentions and citations in AI answers, AI share of voice | Methodology varies; answers drift; directional only |
| Reporting and monitoring | Swydo, DashThis, AgencyAnalytics, Looker Studio | Combines platform data into reports, goals and alerts | Pair with a brand tracker or listening tool and bring their results in through Google Sheets or manual KPIs |
On the reporting row: Swydo’s one plan is $69 a month with the first 10 data sources included and unlimited clients, users and reports. That matters when brand reporting means connecting Search Console, GA4 and three social accounts per client. Seasonal agencies can pause the subscription instead of canceling.
Brand Awareness Metrics FAQ
Direct answers on measuring, benchmarking and reporting brand awareness
Brand awareness metrics measure how many people in your market know your brand, how easily they recall it, and whether that number is growing. They come from surveys (what people remember), behavior (what people search, mention and visit) and experiments (what your campaigns caused).
Reach and impressions aren’t on that list. They count how often an ad was shown, not whether anyone remembers it.
Brand awareness is the umbrella term. Recognition means someone knows your brand when they see it. Recall means they name it from memory with no prompt.
Recall is the one that wins deals, because buyers rarely see a list of options when a need first comes up. They start with the brands already in their head.
The classic model, from David Aaker’s brand awareness pyramid, has four levels: unaware, brand recognition, brand recall and top of mind. Each level is harder to reach and worth more than the one below it.
Map your survey questions to the levels: aided awareness measures recognition, unaided awareness measures recall, and the first brand named unaided measures top of mind.
Unaided awareness is the share of people who name your brand without a prompt. Aided awareness is the share who recognize it from a list. Aided always reads higher.
The gap between them is the useful part. High aided with low unaided awareness means people know you but don’t think of you, which is a memorability problem, not a reach problem. Keep the two on separate charts.
Mental availability is how likely your brand is to come to mind in a buying situation. The term comes from the Ehrenberg-Bass Institute, which ties it to category entry points: the needs, moments and occasions that make someone think about buying in your category.
It’s broader than awareness. A coffee brand remembered for “weekend treat” but not “morning energy” is known, yet misses most buying moments.
Ask the unaided question first, then aided, then consideration. Asking in this order keeps the list of brands from planting answers.
- Unaided: “When you think of [category], which brands come to mind?” (open text)
- Top of mind: the first brand named in that open answer
- Aided: “Which of these brands have you heard of?” (randomized list)
- Consideration: “Which of these would you consider next time you buy [category]?”
- Source: “Where have you seen or heard about [brand] recently?”
Add one made-up brand to the aided list. The share of people who claim to know it shows how much your survey overclaims.
Brand awareness % = respondents who know your brand ÷ total qualified respondents × 100. Calculate it separately for aided and unaided awareness.
“Qualified” matters. Count only people in your target market, such as category buyers, or a mass-market sample will make a niche brand look invisible.
About 400 respondents per segment gives a margin of error near ±5 points, and about 1,000 brings it near ±3 points. These figures use the standard formula at 95% confidence for a 50% result.
| Respondents | Margin of error |
|---|---|
| 100 | ±9.8 points |
| 400 | ±4.9 points |
| 1,000 | ±3.1 points |
| 2,500 | ±2.0 points |
This is why small surveys mislead. A five-point jump between two waves of 400 people can be pure noise, so size the sample to the change you need to detect.
Check behavioral metrics like branded search and share of search monthly, run surveys quarterly, and run lift studies for each large campaign.
Awareness moves slowly, so monthly surveys mostly measure noise unless the tracker samples continuously and reports rolling averages.
Track behavior that only happens when people already know you: branded search in Google Search Console, share of search in Google Trends, mentions and share of voice in a social listening tool, and direct traffic in GA4.
Compare each one to a control, like total category searches or a competitor. If your branded search and the category both grew 30%, your campaign didn’t move anything.
Both use the same formula: your volume ÷ total volume for every brand in your competitive set × 100. Only the input changes.
| Metric | Input | Data source |
|---|---|---|
| Share of voice | Brand mentions | Social listening tool |
| Share of search | Branded searches | Google Trends, Semrush, Ahrefs |
| Paid share of voice | Ad impressions | Impression share reports |
| AI share of voice | AI answers mentioning you | AI visibility tracker |
Share of search tends to lead market share. As the IPA reported from research Les Binet presented, it ran about nine to twelve months ahead in cars and about six months ahead in mobile phones.
Use share of voice and mention volume, not follower counts. A listening tool counts how often people talk about you compared with competitors, including posts you aren’t tagged in.
Platform numbers like reach, impressions and follower growth measure exposure. Report them as supporting data, and sample sentiment by hand before sharing it, since automated sentiment scoring often misreads sarcasm and context.
GA4 can’t measure awareness directly. Its closest signals are direct traffic, branded organic sessions through the Search Console integration, and new users.
Direct traffic also collects visits from apps, PDFs, email clients and AI assistants that hide where people came from, so use its trend, not its level. Most Google searches now end without a click, according to SparkToro and Similarweb, which makes branded impressions in Search Console a better search signal than sessions.
Run a fixed set of category prompts on a schedule across ChatGPT, Perplexity, Gemini, Claude and Google AI Overviews, and count how often your brand is mentioned or cited. AI share of voice = prompts that mention you ÷ total prompts × 100, tracked per assistant.
Treat it as a trend. AI answers shift from month to month and tracking tools use different methods, so compare your brand against itself on the same prompts, not across tools.
Add an open-text “How did you hear about us?” field to your signup, demo or checkout form. It captures podcasts, private chats, communities and AI assistant recommendations that analytics tools label as direct traffic.
Use open text instead of a dropdown. A dropdown only offers the channels you already expected, and it tempts people to click the first option.
There is no universal good score. Benchmark growth against your own starting point and your nearest competitor.
According to Tracksuit’s brand benchmarks, a five-point yearly gain in awareness is outstanding in many categories, and in crowded categories like packaged goods, holding steady can be acceptable. Compare yourself to the brand one place above you, not the category leader.
A brand lift study compares survey answers from people who saw your ads with a control group who didn’t. The difference is your lift.
Platform studies have no separate fee but need minimum ad spend to reach significance. In the U.S., Google’s Brand Lift guide sets a minimum of $10,000 over 10 days for a one-question study, and Meta sets minimums per country. Underfund a study and you get an inconclusive result, not a smaller one.
Estimated ad recall lift is Meta’s modeled guess at how many extra people would remember your ad if asked within two days. It isn’t a survey of your audience.
In its help center, Meta labels it an estimate, says it isn’t comparable across campaigns with different targeting or time periods, and says a brand lift test is required for the most accurate recall measurement. Use it to compare creatives running at the same time.
Plan in quarters, not weeks. Share of search usually moves first, survey awareness follows, and market share comes last, with months between each step depending on how often people buy in the category.
Report branded search and share of search monthly so slow survey results don’t look like failure.
A good awareness KPI names one metric, a target and a deadline, for example “grow share of search from 9% to 12% by Q4” or “lift unaided awareness among category buyers by 3 points this year.”
Lead with unaided awareness, aided awareness, share of search, branded search against category search, and share of voice. Add ad recall lift for large campaigns and AI share of voice if your buyers research with AI assistants.
Unaided awareness inside the buying committee matters most, followed by branded search against category search and AI share of voice for category prompts.
Survey the few hundred decision makers who actually buy, not the general public. Most B2B buyers shortlist brands they already know before they start their research.
Use free tools: branded search in Google Search Console, share of search in Google Trends, profile views and searches in Google Business Profile, and a “How did you hear about us?” field.
Track them monthly against one competitor. Add a small survey once a year if you can, sized to your local market rather than a national sample.
No. NPS measures how likely existing customers are to recommend you, so it only covers people who already know your brand.
It belongs in a brand health or loyalty report next to awareness, not in place of it.
Binet and Field’s research on the IPA effectiveness database points to roughly 60% brand building and 40% activation for consumer brands, and about 46% brand and 54% activation for B2B. The Drum covered the B2B numbers in an exclusive look at their research.
The right split shifts with maturity. As Marketing Week reported, their B2B analysis found first-year brands did best with about 35% on brand, rising to 72% for category leaders.
Connect awareness to a commercial number in three ways: lift studies for single campaigns, share of search tracked against sales or market share over time, and pipeline or conversions from people exposed to brand campaigns compared with people who weren’t.
Last-click attribution will always undercount brand, because the buyer who remembered you still clicks a search ad at the end. Report branded search conversions as the visible part of that effect.
Lead with one headline number and one comparison, show leading indicators monthly and survey results quarterly, and finish with the link to revenue.
A strong headline reads like “share of search 14.2%, up from 9.8% two quarters ago, now second in the set.” Our guide to client reporting best practices covers cadence and setting expectations.
Next Steps
Pick one client. Pull their branded impressions from Search Console and their category or top competitor from Google Trends, and calculate share of search for the last four quarters. That’s an afternoon of work and already a better brand awareness story than most agencies tell.
Then set a quarterly branded-impressions Goal and a 30-day drop Alert in Swydo so next quarter reports itself. Add one survey wave when the client’s next brand flight is big enough to justify it.
Give every client a monthly report that shows their brand is getting remembered, not just seen.
Start Your Free Trial Today