
You’ve put in the hard work, optimizing pages and building links to get SEO results for your clients. Now, you need to turn that effort into a compelling SEO report that showcases your value and proves those long nights are paying off.
It’s a challenge to sift through mountains of data and translate it into what clients care about most: leads, revenue, and exceeding expectations. But creating reports that resonate is crucial.
I learned this firsthand running my SEO agency. We transformed our reporting from a chore into a secret weapon for client retention and growth.
In this guide, I’ll share my process for building monthly SEO reports that get clients excited. Reports that prove your value and make you an indispensable partner.
What You’ll Learn
Jump in and I’ll show you:
- 5 core elements every SEO report needs to boost retention and upsells
- My top tricks for finding the right data to tell a slam dunk story without spending your whole life in Analytics
- A foolproof method for turning mind-numbing data into an irresistible story that always ends with “and wait until you see what we do next”
- 3 ways to use reports to get more client referrals, testimonials and case studies
- How to automate the whole shebang and claw back hours of your life every month
Whether you’re an SEO consultant, agency leader, or in-house marketer, you’ll walk away from this post with a rock solid plan for turning your SEO reports from a total time-suck into your ultimate tool for cementing client loyalty and getting them pumped to grow with you.
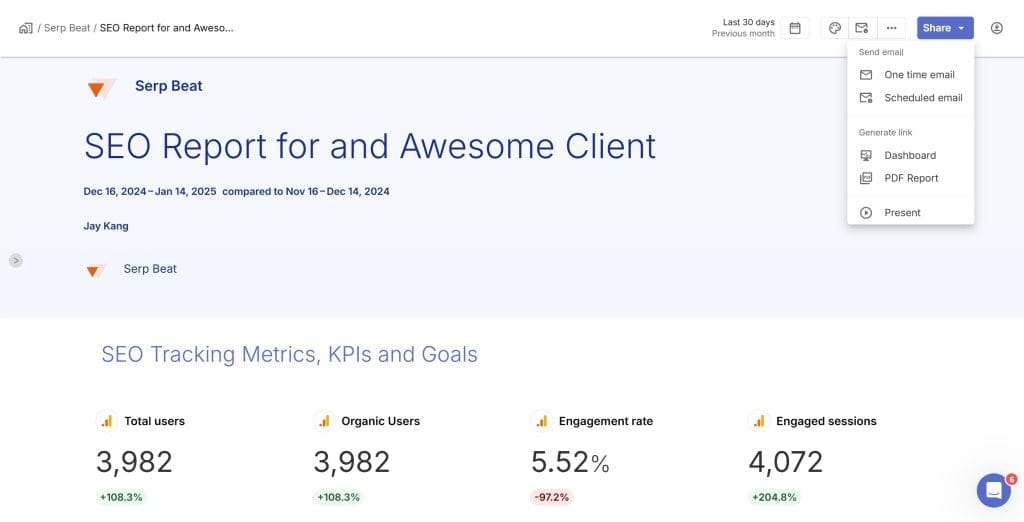
First Things First, Get Crystal Clear on Your Report Goals and Audience
Before we get into the details, we’ve got to talk about the cardinal sin I see most agencies committing with their SEO reports. They slap together the same generic “template” and send it off to every client, every month, no matter what.
Yeah, I get it. Your time is crazy limited and it’s tempting to try to get reporting off your plate as fast as humanly possible. But here’s the hard truth
The secret to an SEO report that gets results is that it’s hyper-specific to your client. If your SEO report for the CMO of a SaaS company looks identical to the one you send the solopreneur who makes jewelry in her garage, we’ve got problems.
The key is to develop a flexible template, a foundation you can customize for each client. Think of it like a blueprint – it provides the basic structure, but you can adapt it to suit the specific needs and preferences of each project.
The most killer SEO reports are built from the ground up around your client’s unique business, goals, level of SEO savvy, and what gets their motor running. What knocks one client’s socks off could put another client straight to sleep.
So job #1, before you even crack open Google Analytics or Google Search Console, is to get stupidly specific on what you’re trying to accomplish with each report. I want you to rapid-fire answer these questions about each of your clients:
- What are the top 3-5 things this client is paying you to do? Drive leads, sales, more web traffic, brand awareness? And not just “get more traffic” – traffic for what? To do what?
- How comfy is this client with technical SEO stuff? Are you talking to a head of marketing who wants to nerd out about canonicals and schema, or a business owner who glazes over when you say “search volume”? You’ve got to meet them where they are.
- What burning questions or worries does this client always seem to have about how their SEO is going and if they’re getting a return on their investment? Your report has to hit those head on.
- Which SEO to-dos were you focused on for this client last month? How can you show meaningful progress on those priorities and tie it back to their big picture goals?
- What new awesome stuff can you pitch them on testing next based on the data? You want them to finish your report and think “holy cow, I can’t wait to see what else these guys can do!” not “okay, so what?”
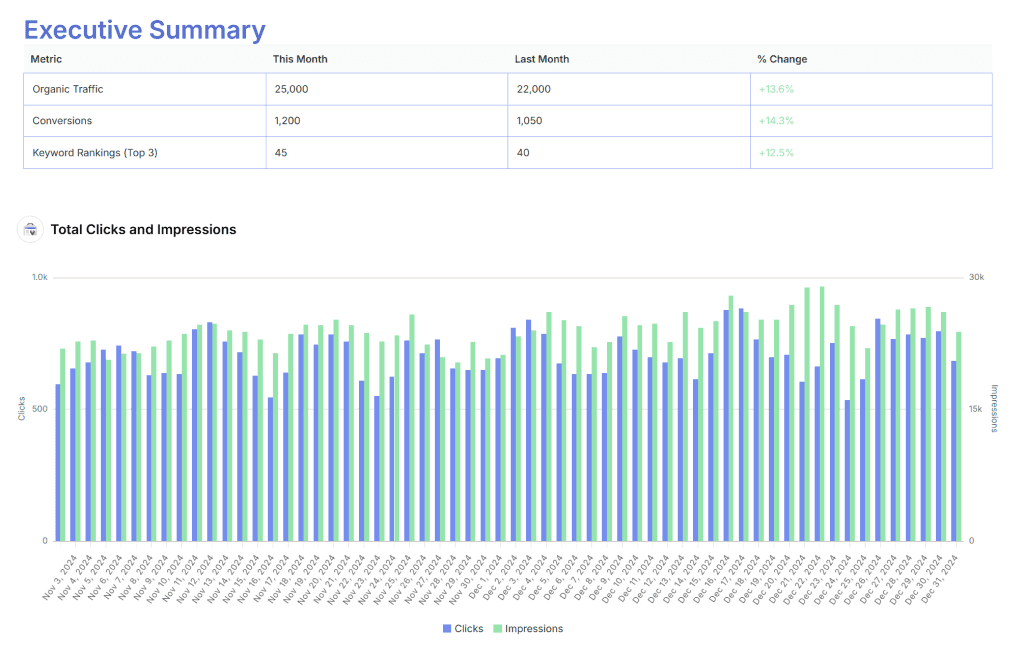
Your answers should shape every single part of your report – the exact data you put in, how you slice and dice the metrics, how you visualize the data, and what goes into the executive summary vs. the nitty gritty details.
How long should my SEO reports be, exactly?
My rule of thumb is to keep the core report to 5-7 pages max, with extra pages if you need to add more granular data. You want it to be long enough to tell a compelling story, but short enough that your client doesn’t go cross eyed trying to get through it.
The main body of the report should laser focus on the metrics and insights that are most critical for your client’s goals. The appendix covers all the specifics for anyone who really wants to dig deep.
At the end of the day, it’s on you to take all that complex data and distill it down into a clean, easy-to-grasp story. NOT to drown your client in numbers and jargon. If a busy CEO can breeze through your report in 5 minutes and get the key takeaways, but their marketing team can find all the juicy details to chew on in the back – you’ve nailed it.
Play with different report lengths and ask your clients what they find most useful and digestible. See what lights them up. The right length is going to be different for every client. When in doubt, keep it tight. If they say “hey, we need more info on X” you can always add it.
I know this sounds like a ton of work, and I won’t lie to you, it is. But when you build your reports 100% around what’s important to your client instead of what’s easiest for you – the payoff in client satisfaction and retention is off the charts. Every single time.
Hunt Down the Right Data to Tell Your Story
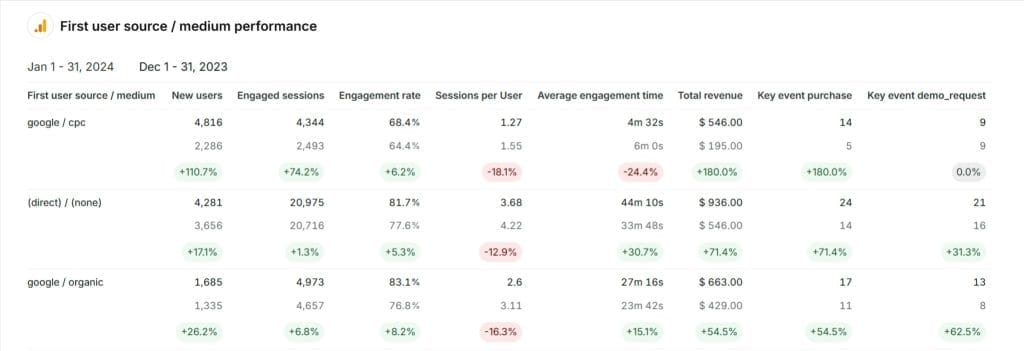
Now that you’ve got the blueprint for your bespoke client reports locked and loaded, it’s time to fill in the blanks.
For each client, you’ve got to dig up the exact data points and context that will help you tell that slam dunk story of why your work matters. Basically, you’re putting together a forensic evidence kit to prove how awesome you are.
In general, my “must include” evidence list usually looks something like:
| Category | Metric |
|---|---|
| Traffic Data | – Overall organic sessions and page views (monthly, quarterly, yearly) |
| – Organic traffic to key pages and sections | |
| – User engagement metrics (pages per visit, bounce rate, etc.) | |
| – Top pages driving the most organic traffic | |
| Conversion Data | – Number of leads, sales, and revenue from organic search |
| – Conversion rates for organic traffic | |
| – Micro and macro conversion rates for key site areas | |
| SEO Performance Data | – Ranking progress for target keywords |
| – Overall organic visibility (ranking trends for keyword groups) | |
| – Click-through rates (CTR) from organic search results | |
| – Number of featured snippets and “People Also Ask” appearances | |
| Technical Metrics | – Core Web Vitals scores (page experience metrics) |
| – Crawl stats and indexing data | |
| – Number of new and lost backlinks |
To gather and organize all this data efficiently, consider using a client reporting tool like Swydo. Swydo can pull data from various sources like Google Analytics, Google Search Console, Semrush, SE Ranking, and even your client’s CRM like HubSpot, making it easy to track the metrics that matter most to them.
The catch is – I’m not including all of these every time. I’m hand-picking the exact combo of metrics I know are going to help me point back to my client’s most important goals. The key trick is this
First up, ALWAYS circle back to the dollar. I don’t care how much you boost organic traffic – if those visitors aren’t converting into actual paying customers, you’re only doing half your job. Keep in mind, clients aren’t really after “more traffic” – they want more money in their pocket. Every SEO report has to reflect that or you’re missing the plot.
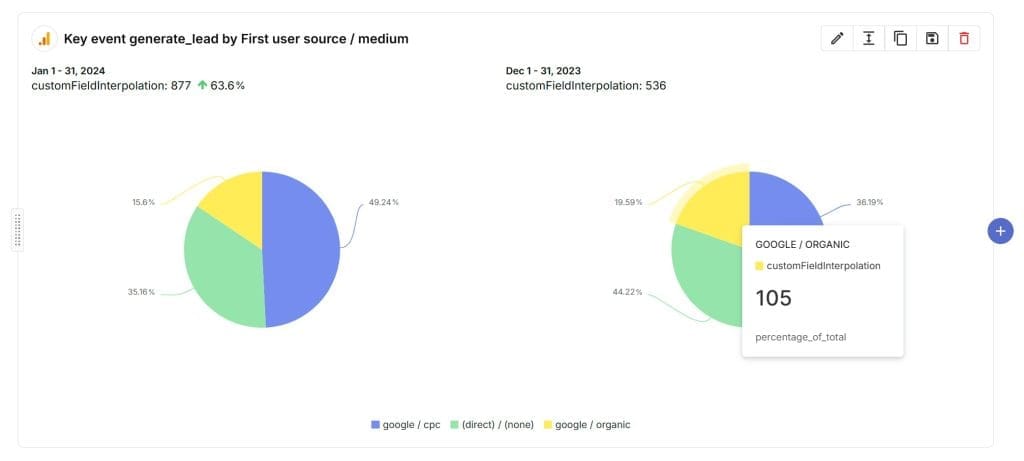
So get creative about finding ways to connect the dots between SEO metrics and $$$ generated. Set up goals in Google Analytics. Figure out how to use your client’s CRM to track organic leads through their sales funnel. Do whatever you’ve gotta do to get as close as you can to real revenue.
My client’s site doesn’t have conversion tracking set up – how do I report on that?
If you can’t get your hands on hard conversion data, don’t panic. You’ve still got plenty to work with to show how your SEO efforts are pushing the needle:
- Organic traffic increases to their most important money-making pages
- Improvements in rankings and overall SERP visibility for their highest converting keywords
- User engagement metrics like time on site that show their organic traffic is high quality
- Number of assisted conversions from organic search (people who visited the site from organic, then came back later to convert)
With more data, especially conversion tracking in place, you can use attribution modeling to generate even more powerful recommendations. Seeing how different channels work together to drive conversions allows you to pinpoint areas for improvement and demonstrate the full value of your SEO efforts.
For example, a first-click attribution model might reveal that organic search drives a significant portion of initial website visits that eventually lead to sales, even if those visitors convert through a different channel like paid advertising later on. This highlights that SEO and PPC can work beautifully together: SEO brings in those crucial first visits, getting the word out and capturing early interest, while PPC can then swoop in with targeted campaigns to nurture those leads and drive conversions.
Position-Based Attribution Model
The name of the game is to get as close as you can to proving your SEO work is making them money, even if you can’t draw a straight line. Get creative with it.
For example, if you can make a solid case that when you get a money keyword to page one, it historically sends 100 more leads their way, use that math to predict the $$ value of your next big rankings push.
And in the meantime, do whatever you can to help your client get their conversion tracking sorted out ASAP. The more you can prove to your boss how much money you’re bringing in, the easier your job will be.
Don’t forget, your SEO reports are more than just recaps of the past – they’re an opportunity to get your client hyped for the future.
So while you’re rummaging around in the data, here’s the kind of opportunities you’re always looking for:
- Low-hanging keyword wins you could lock down with just a little more elbow grease
- Pages and sections that are almost there to skyrocketing conversions with some extra CRO attention.
- Blog posts and landing pages that are raking in tons of organic traffic but not turning those visitors into customers
- Content ideas based on the PAA/AIO questions Google shows for your big keywords
- Fixes that could majorly move the needle on their Core Web Vitals scores
Basically, your reports shouldn’t just tell clients what you already did – they should paint an irresistible picture of how much more is possible. Insights that lead straight into “okay, so here’s what we’ve gotta do next” are the special sauce.
Finally, context is queen. Sometimes the juiciest thing you can add to the hard numbers is good old fashioned expert insight.
So as you’re on the hunt for data, look for important context that can help you tell the full story:
- Patterns you’re seeing over time, especially if this client’s sales tend to swing with the seasons
- New stuff their competitors are doing online that you need to be working on ASAP
- How the client’s other marketing efforts like paid search or email are playing with your SEO results
- Curveballs with the economy, their industry, etc. that are probably impacting their bottom line
For example, if you can explain why a dip in sales that’s freaking them out is probably due to an issue with their checkout page and not your SEO work, that’s the type of context that shows you’re not just a data jockey – you’re a high-level marketing partner who’s got their back.
This is also a great opportunity to provide updates on any outstanding items from your initial SEO audit. For example, if you identified technical issues or content gaps, highlight the progress made in addressing them and how those improvements are impacting their SEO performance.
Moral of the story: The data you pluck out and plunk into your report should be intentional. Surgical even. This is your chance to prove how well you get your client’s world and goals. So treat it that way. Context is everything.
Grab Your Client by the Heartstrings
Finally, it’s the moment you’ve been waiting for. You’ve got all your key data lined up like little soldiers. Now it’s time to weave those numbers into a story so irresistible, your clients will be throwing money at you to write the sequel.
An SEO report that hits a home run for your clients should do 2 key things:
- Prove beyond a shadow of a doubt that your work is paying off big time for their business
- Get them so hyped about what’s coming next, they can’t wait to green light all your genius ideas
It’s easier than it sounds. Just stick to this tried-and-true flow and you’ll nail it every time:
1. Hit Them With the Big Headlines
Kick things off with a quick and dirty executive summary that recaps the top 2-3 wins:
- The major SEO stuff you got done this month
- The high and low lights in terms of results and how they map to your client’s big goals
- Sneak peek of the opportunities you spotted and what you want to do next to make things even better
The point is that JUST by skimming this first page, even the busiest, most SEO-skeptical client should get the gist of the awesome stuff you’re doing and why. Keep it stupid simple with bullet points and breezy copy. Think of it more like a persuasive sales page than a boring business report.
2. Do the Deep Dive (in Snackable Soundbites)
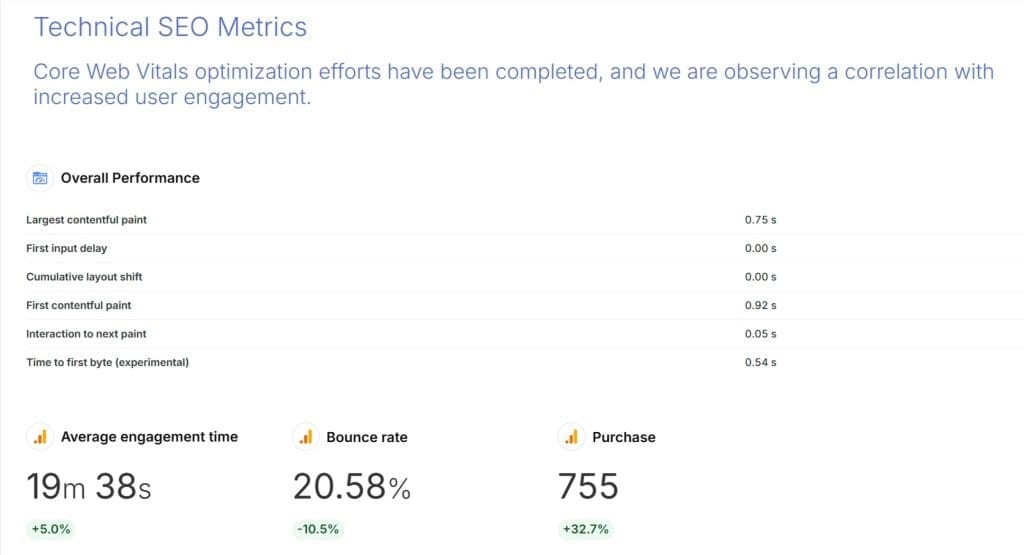
Next, use the main body of the report to dig into each key metric (organic traffic, rankings, leads from SEO, etc.). But here’s the catch – never JUST parrot back the numbers. Always, always, always tie the data back to why it matters for their bottom line.
So instead of “organic traffic was up 20% this month”, give it to them in plain English “The 20% spike in organic traffic this month was mostly thanks to all the content we’ve been optimizing. Now that we’re ranking on page one for 3 of your most profitable keywords, our SEO traffic is on track to drive 13% more sales this month.”
Boom. Heavy data tables or super complex charts are out. Opt for visuals that make the insights pop off the page. Annotate the heck out of your charts to spell out the “so what”. Clarity is your bestie.
3. Tell Compelling Stories With Case Studies
Now it’s time to pull out 2-3 ultra-specific examples that show without a doubt how smart SEO is lighting their world on fire. Maybe it’s an in-depth page you wrote that’s now ranking top 3 and sending oodles of free trial sign-ups their way. Maybe it’s some ninja technical fix you did that unclogged their conversion funnel and made online sales go crazy.
This is your chance to paint a picture so vivid, they’ll forget they ever doubted you. Use screengrabs and before and afters. Don’t just tell them what happened – show them how you made it happen and walk them through why the results matter. Stories sell.
Is your client ghosting your reports? Try this.
First things first, are you sending them data and insights that actually map to their goals and KPIs? Because if it reads as a bunch of SEO mumbo jumbo to them, I’d probably ignore it too.
Instead of lobbing a generic data dump their way, go back to square one:
- Only include metrics that connect to what they’ve told you is important (in their language, not marketing jargon).
- Ditch the endless Excel tables for easy-to-digest charts that make insights obvious.
- Tell the story through their eyes – why should they care about this data? What’s in it for them? Make it stupidly relevant to their world.
If you know the content is on point but the format is putting them to sleep, get experimental:
- Could you sum up the high-level takeaways in a quick video instead of yet another PDF?
- Would they rather you swing by to walk them through the highlights in person vs. making them go it alone?
- Can you trim the fat and really make the most important insights shine?
Don’t be shy about straight up asking what would make the reports more valuable for them. They might surprise you and say they don’t really need all the tiny details. Or that they’d love it if you added a section all about how they stack up to competitors.
At the end of the day, your reports should feel like a major value-add, not a homework assignment. So if they’re not making your clients fist pump, step into their shoes and rethink your approach. A few small tweaks can take you from delete fodder to their new favorite monthly read.
4. School Them, Just a Little
Let’s translate these insights into a winning strategy. Based on everything the data is telling you, what new tricks and tests can you run to squeeze even more ROI out of your work? Which of your latest moves are total winners you should double down on? What’s not pulling its weight and needs a tweak?
To make these future recommendations even stronger, connect them back to your original SEO campaign proposal and outline the milestones achieved. This reinforces the value you’re delivering and sets the stage for discussing future initiatives.
For example, ‘As outlined in our initial proposal, phase one focused on on-page optimization. We’ve successfully optimized 15 key pages, resulting in a 10% increase in organic traffic. Now, let’s move into phase two, which focuses on building high-quality backlinks…”
Most importantly, spell out in dead simple terms the extra juice you think you could get them if they let you run wild with a couple of the sexy new ideas you’ve got percolating based on all these learnings:
- Exactly how you’d use the winners and losers in this report to hit their goals even faster
- Specific projections for how much more traffic and $ you think you could net them if you do X, Y, Z
- Concrete next steps and action items (with deadlines) for you and their team so nothing falls through the cracks
This is where the magic happens. If you can get scary good at crunching the numbers in your SEO reports to extract 2-3 no-brainer quick wins or tests you KNOW will make their metrics soar, you’ll never have to convince a client your retainer is worth it again – they’ll be thrilled with the results and ready for more.
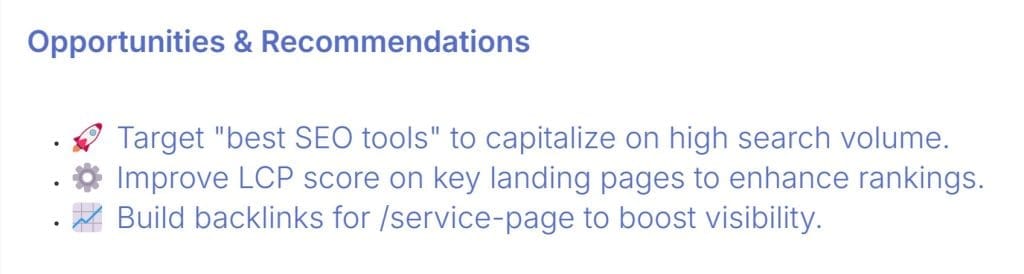
Go beyond simply stating what you’ll do next. Provide specific projections based on your SEO forecasts. For example, ‘Based on our current keyword rankings and content strategy, we project a 15% increase in organic traffic over the next quarter, leading to an estimated X number of leads.’ This paints a clear picture of the potential impact of your work.
You want me to sell MORE SEO work in my SEO reports? Really?
YEP. Ongoing SEO is all about iteration and building momentum. You probably know from hard-earned experience that one killer content or link building campaign is almost never enough to cement your client at the top of ultra competitive SERPs.
You’ve got to train your clients to think of SEO as a marathon, not a sprint. Every month, you’re analyzing what moved the needle and pitching ways to pour gasoline on those strategies. Every report is a chance to spell out, in terms of cold hard cash, what they stand to gain if they keep betting on you and SEO.
So for example, if traffic and leads went bonkers when you optimized and built links to their product pages, come to your next report armed with a plan for how you could 3X those results in half the time if they let you scale those tactics.
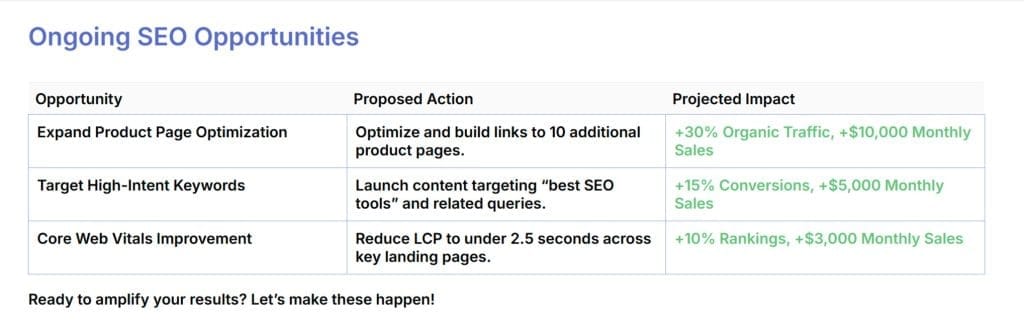
Don’t just slap a vague “hey, we should do more of that” in your report and pray they pick up what you’re laying down. Make a bulletproof case that ties your ideas to their revenue:
“The page optimization and link building playbook we ran last month was dynamite for your organic traffic and leads. I’ve identified 10 more pages that are perfect for this treatment. If we do this, I’m confident we can drive an extra $10K in monthly sales and hit our annual target 3 months early. Want me to get it teed up?”
Is it harder and more time consuming than just screenshotting Google Analytics or GSC graphs and hitting send? 1000%. But it’s one of the only truly reliable ways to keep clients coming back month after month (with steadily growing budgets to match).
5. Stick the Extras in the Back
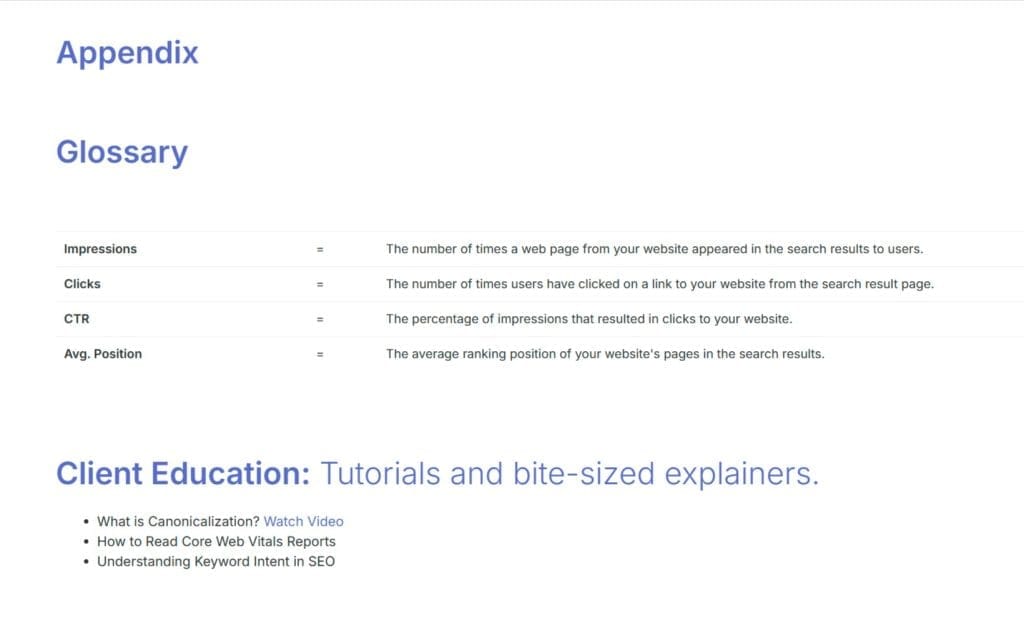
The meat of your report should be all about those big, juicy insights. But some clients are always gonna want to roll up their sleeves and spelunk every single data point for themselves too. Your monthly report appendix is the perfect place to stick all the raw numbers, full size charts, and nitty gritty details without gunking up your core story.
Bonus points if you can also start dropping in a little client education content in the back too. People LOVE bite-sized explainers and tutorials that make them feel smarter. So if you noticed they were super confused about canonicalization on your last call, whip up a quick video or one-sheeter that breaks it down Barney style for them to reference again and again.
Bottom line, your SEO reports shouldn’t read anything like those snoozy high school term papers you totally never BS’ed the night before. They should feel way more like your favorite Netflix show – a clever hook, a story chock full of eye-popping moments, and an irresistible cliffhanger ending that leaves them dying to smash “next episode”.
If you build your reports around an emotional arc that proves they’d be absolutely lost without your smarts and guidance, you’ve got the recipe for a beautiful partnership.
Test, Iterate, Improve – The Best SEO Report Writers Never Stop Testing
I know we just threw a ton at you. And honestly, if you can master even just a handful of the strategies we unpacked, you’re going to be miles ahead of most agencies on the reporting front.
But if you want to be the LeBron James of SEO reporting, here are a few pro moves to add to your toolkit once you’ve got the fundamentals nailed:
- Go all in with your reports. Reinforce SEO’s full-funnel impact. Show your clients how SEO is driving real business results across their whole marketing mix. Talk revenue, conversion rates, and lifetime customer value, not just rankings and traffic.
- Give them 24/7 access to the data. Build your clients a custom, live SEO dashboard in a tool like Swydo, Looker Studio or Tableau. Let them geek out on real-time numbers whenever they want.
- Whip out the industry benchmarks. Invest in tools and partnerships that help you show clients how they measure up to competitors and their vertical. A little context goes a long way.
- Put lead quality under the microscope. The faster you can show exactly how many marketing and sales qualified leads your SEO is driving, the faster they’ll be singing your praises.
- Get creative with your formats. Clients falling asleep at your same old PDF reports? Zoom through the highlights in a quick custom screencast each month. Or design some infographic-style visuals that make the insights pop. How you communicate is as key as the content itself.
TL;DR – never stop experimenting, never stop tweaking, and never stop asking your clients what could make your SEO reports more valuable for them.
Your 5-Step Cheatsheet for Ridiculously Effective SEO Reporting
I know you’re probably itching to go put this stuff into action. So let’s boil it down into a simple checklist you can tape up on your wall:
- Ask yourself what your client really wants to see – don’t guess!
- Dig up data that points back to their goals – every time
- Turn the numbers into a drool-worthy story – make it memorable
- Use it to spark real talk convos and pitch new strategies – make it actionable
- Test out new reporting tricks and get feedback constantly – make it a living process
In all honesty, going back to what I said in the beginning, leveling up your SEO reports like this is WORK. If it was easy, every SEO would be churning out mind-blowing reports without breaking a sweat. It takes serious time, creativity, and client wrangling to see what really flips their switch.
But once you start getting it right? Once you start sending reports that get your clients pumped to open every single month? Once you start hearing stuff like “Your reports are THE thing I look forward to most, what do we need to do to get 10X more of these results?” – you’ll never look back.
The payoff is legit. I’ve seen first-hand how even small tweaks in your client reporting style can take you from “vendor” to “irreplaceable partner” in their eyes crazy fast.
Start small, iterate constantly, and don’t be shy about bugging your clients to learn what makes them tick. Because at the end of the day, that’s what this is really about. Helping your clients win so big, they can’t picture their business without you. Finally, use Swydo’s SEO reporting tool to integrate, create, and visualize an SEO report based on our discussion.
SEO Reporting FAQ
Practical answers about creating client reports that showcase value and boost retention
An effective SEO report needs five key components: a concise executive summary highlighting major wins, key performance metrics tied directly to business goals, specific case studies demonstrating tangible results, actionable recommendations with projected outcomes, and an appendix with detailed data. Focus on metrics that matter to your client’s bottom line—traffic that leads to conversions, ranking improvements for money keywords, and revenue generated from organic search.
Monthly reporting is the industry standard for most SEO clients. This frequency provides enough time to show meaningful progress while maintaining regular communication. For new campaigns or during major algorithm updates, consider supplementing with biweekly check-ins. High-value enterprise clients may benefit from quarterly executive summaries that focus on bigger strategic trends, complemented by your regular monthly tactical reports.
Keep the core SEO report to 5-7 pages, with additional pages for detailed data in an appendix if needed. This length balances comprehensive insights with readability. Design the main report so a busy executive can grasp key takeaways in under 5 minutes, while providing sufficient technical details for marketing teams to analyze. Focus on telling a clear story rather than overwhelming clients with every possible data point.
Good SEO reports are client-specific, connecting SEO metrics directly to business goals and revenue impact. They use clear visualizations, include actionable recommendations, and tell a compelling story about progress. Bad reports are generic templates filled with technical jargon, overwhelming data dumps without context, and metrics that don’t relate to client priorities. The best reports transform complex data into strategic insights that both prove your value and guide future decision-making.
A strong executive summary should be one page maximum and focus on three elements: completed SEO initiatives, key results tied to business goals, and identified opportunities. Use bullet points, simple language without jargon, and highlight metrics that executives care about—revenue impact, lead generation, and competitive positioning. Think of it as a highlight reel that captures attention and demonstrates value at a glance, making busy decision-makers eager to approve your next recommendations.
Focus on metrics that directly connect to business outcomes: organic traffic growth to key landing pages, conversion rates from organic visitors, revenue generated from organic search, ranking improvements for high-value keywords, and click-through rates from search results. Include user experience metrics like Core Web Vitals and engagement statistics. Always prioritize metrics that demonstrate financial impact over vanity metrics like total keywords ranked.
Track SEO ROI by establishing clear conversion tracking through Google Analytics or your client’s CRM. Calculate the value of organic conversions using the client’s average sale value or lead-to-customer conversion rate. For e-commerce, directly measure revenue from organic traffic. When direct tracking isn’t possible, create attribution models that estimate value based on increased rankings and traffic for money keywords, comparing investment in SEO against revenue growth over time.
Use a combination of data sources for comprehensive SEO reporting: Google Analytics and Google Search Console for traffic and search performance, rank tracking tools like Semrush or Ahrefs for keyword positions, technical SEO tools for site health metrics, and backlink analysis platforms. Consider dedicated reporting platforms like Swydo, Looker Studio (formerly Google Data Studio), or AgencyAnalytics to automate data gathering and create professional, customizable reports.
For local SEO reporting, track Google Business Profile insights (views, actions, direction requests), local pack rankings for geo-targeted keywords, citation consistency across directories, local landing page performance, and localized conversion metrics. Include review volume and sentiment analysis, showing improvements in both quantity and quality. Map performance metrics to local business goals like foot traffic, local calls, or location-specific sales to demonstrate clear ROI from local optimization efforts.
When conversion tracking is incomplete, demonstrate SEO value through proxy metrics: increased organic traffic to high-intent pages, improved rankings for commercial keywords, enhanced user engagement metrics, and assisted conversions where organic search initiates the customer journey. Create correlations between traffic increases and business performance, and use industry benchmarks to estimate conversion potential. Simultaneously, prioritize helping your client implement proper conversion tracking to strengthen future reporting.
Translate technical SEO concepts into business language that resonates with your client. Instead of discussing “improved crawlability” or “optimized metadata,” explain how these changes help potential customers find their products more easily. Use clear visualizations with annotations that explain the “so what” behind each chart. Develop simple analogies that relate SEO concepts to familiar business ideas, and always frame results in terms of progress toward their specific business goals.
Address negative results honestly while maintaining context. Start by acknowledging the decline and explaining potential causes—algorithm updates, seasonal fluctuations, technical issues, or competitive shifts. Provide specific action plans to address each issue, showing you’re already working on solutions. Highlight any positive metrics, even small wins, and use historical data to demonstrate that temporary setbacks are normal in SEO. This transparent approach builds trust and positions you as a problem-solver rather than someone hiding negative results.
Set realistic expectations from the start by creating a clear timeline that maps specific SEO activities to expected outcomes over time. In your reports, highlight progress indicators like improved indexing, ranking movements for secondary keywords, and technical improvements—metrics that show momentum before major traffic or revenue increases occur. Break down your SEO strategy into phases with milestone achievements, and celebrate these smaller wins to demonstrate forward movement while the full impact develops.
Use milestone achievements in your SEO reports as natural opportunities to request referrals. When reporting significant wins, include a simple referral request section that clearly describes your ideal client profile and makes it easy for satisfied clients to make introductions. Create case study snippets from your reports’ success stories (with permission) to share with prospects. Consider offering incentives for referrals that convert, and always acknowledge referrals with meaningful appreciation to encourage continued advocacy.
Strategically use data insights to naturally suggest complementary services. Identify 2-3 high-potential opportunities from your report analysis and present them with specific projected outcomes. For example, if content optimization drove traffic increases, propose expanding to new keyword clusters with projected traffic and conversion estimates. Frame these as logical next steps toward the client’s goals rather than upsells, including concrete ROI projections tied directly to business metrics they care about.
Automate SEO reporting by using dedicated reporting platforms like Swydo, AgencyAnalytics, or Looker Studio that connect directly to data sources like Google Analytics, Google Search Console, and rank tracking tools. Create templatized report structures that maintain consistent formatting while allowing customization for each client. Set up automated data pulls on a scheduled basis, and use API connections to gather data from multiple sources simultaneously. Reserve your manual time for adding strategic insights and recommendations that automation can’t provide.
The best agency SEO reporting tools offer multi-client management, extensive data source integration, and customizable branding. Top options include Swydo for its comprehensive integration capabilities and client-friendly visualizations, AgencyAnalytics for its all-in-one dashboard approach, Looker Studio (formerly Google Data Studio) for extensive customization options and direct Google product integration, and Databox for its real-time client reporting features. Consider factors like scaling costs, white-labeling options, and automated scheduling when selecting the right platform.
Create custom SEO dashboards by first identifying 5-7 critical KPIs that directly connect to your client’s business goals. Design visually clean layouts that highlight these priorities with clear visualizations—trend charts for traffic and rankings, gauge charts for goal completion, and comparison widgets for year-over-year growth. Include both real-time metrics and historical comparisons, organize information in a logical flow, and add explanatory annotations that provide context. Test the dashboard with clients and refine based on which metrics they find most valuable.
Strike the right balance by automating routine data collection and visualization while reserving manual effort for analysis and strategy. Use reporting tools to automatically gather metrics from multiple sources, generate standard charts, and maintain consistent formatting. Then manually add strategic context, explanations of unexpected changes, competitive insights, and specific recommendations based on the data. This hybrid approach saves time on repetitive tasks while ensuring reports maintain the strategic value and personalization that drives client retention.
Leverage AI to enhance SEO reporting by using natural language processing tools to analyze large datasets and identify patterns human analysts might miss. AI can help automate anomaly detection (flagging unusual traffic drops or ranking changes), generate initial insights from complex data, assist with competitive analysis, and create draft report narratives that explain data trends. Use AI for the heavy lifting of data processing while maintaining human oversight for strategic recommendations and client-specific context.
Prove your SEO value with customized, data-driven reports.
Start Your Free Trial Today