
Your biggest client just renewed for another year.
Not because your campaigns were perfect. Traffic was flat. Conversion rates dropped 12%. Cost per lead actually increased during Q3.
They renewed because your reports made them feel like strategic partners, not just account holders.
The difference? You transformed their confusion into confidence through clear, compelling communication.
The stakes are higher than you think. Poor reporting kills more client relationships than poor performance. Average annual client churn rate for marketing agencies is typically 15-25%, meaning agencies might lose 1 in 4 to 1 in 6 clients yearly, depending on their total client base. For professional services firms (including agencies), the average churn rate is around 27%. At an average monthly retainer of approximately $3,500, that’s roughly $84,000-$168,000 in lost revenue annually (based on two clients), before factoring in replacement costs
We all face the same struggle. Creating reports that actually showcase our value while guiding clients toward success. Month after month, it feels like walking a tightrope between overwhelming them with data and oversimplifying everything.
But here’s what I’ve learned – nail this skill and you’ll transform your role. You’ll go from being just another service provider to becoming their indispensable strategic partner.
This guide shares strategies that can seriously boost your reporting game. We’re not talking theory here. This comes from years in the trenches, working with clients across every industry you can think of. Sometimes we learned the hard way what actually moves the needle. Let’s dive in.
The Evolution of Client Reporting: From Metrics to Strategic Partnership
Client reporting has changed dramatically. What used to be simple metric summaries has become comprehensive strategic partnership tools. Understanding this shift matters if you want to stay competitive in 2025.
Historical Context of Agency Reporting
Think back to how reporting used to work. We’d focus on activity metrics like impressions, clicks, and basic engagement stats. Most reports were template-driven. Generic documents that barely changed from client to client.
The whole point was proving we did the work. Not demonstrating strategic value. Clients got these reports monthly or quarterly, usually with little context or actionable insights attached to the raw data.
The Current Reporting Landscape in 2025
Everything’s different now. Several key factors drove this transformation.
Data abundance and integration capabilities have exploded. Your clients understand marketing analytics way better than before. They expect real-time reporting as standard. Cross-channel attribution isn’t optional anymore. And AI-powered analysis has completely changed how we generate insights.
Today’s clients want more than just data visualization. They expect comprehensive interpretation, strategic guidance, and actionable recommendations tailored specifically to their business objectives. The agencies that figured this out early? They’ve positioned reporting as the cornerstone of their value proposition rather than some administrative task.
6 Steps to Implement Client Reporting Best Practices
1. Define Objectives
Align reporting goals with client’s business objectives. Identify key metrics that matter most to your client.
2. Customize Reports
Tailor reports to each client’s unique needs. Use client-specific terminology and focus on their priority areas.
3. Visualize Data
Use clear, relevant charts and graphs. Make complex data easily digestible through effective visualization.
4. Tell a Story
Craft a narrative around your data. Explain the ‘why’ behind the numbers and provide context.
5. Provide Insights
Offer actionable recommendations. Go beyond reporting numbers to suggesting strategic next steps.
6. Gather Feedback
Regularly seek client input. Continuously refine your reporting process based on client feedback and evolving needs.
The Critical Role of Client Reporting in Agency Success
Client reporting goes way beyond routine tasks. It’s actually the cornerstone of agency-client relationships and drives long-term success. Good reporting doesn’t just demonstrate your agency’s value – it shapes strategy, builds trust, and opens doors for growth.
Let’s explore how well-built reports can completely transform your agency’s role and impact.
How Strategic Reporting Drives Client Retention
Most agencies see reporting as a necessary evil. A time-consuming task that pulls us away from “real” work. But what if you flipped that perspective? What if reporting became your most powerful tool for client retention and growth?
Think about it. Your report is often the most tangible evidence of your work that clients see. It’s your monthly or weekly chance to reinforce your value, showcase your expertise, and strengthen that relationship.
When you do it right, your report becomes more than just a document. It becomes a roadmap for your client’s success, with you as their trusted guide. Agencies that invest in sophisticated reporting methodologies typically see higher client retention rates compared to those using basic approaches.
Impact of Effective Client Reporting on Key Metrics
What Clients Expect Today
Today’s clients are more sophisticated. They demand real value. They’ll reject vanity metrics and pretty graphs because they want insights that drive actual business impact.
You need to nail your reporting strategy for these critical reasons.
1. Performance Documentation and ROI Validation
Reports serve as concrete evidence of your impact. Marketing budgets face constant scrutiny, so your ability to clearly demonstrate return on investment becomes the difference between a long-term partnership and a short-lived engagement.
Move beyond surface-level metrics. Show how your efforts directly contribute to business growth. Link your activities to key performance indicators that matter most to your clients.
- Revenue growth attribution
- Market share expansion
- Customer acquisition cost reduction
- Conversion rate optimization results
- Customer lifetime value enhancement
These metrics tell the real story.
2. Strategic Guidance and Business Intelligence
Clients hire agencies for more than tactical execution. They want strategic insights. Reports give you the opportunity to showcase your understanding of their business and industry. This positions you as a valuable advisor rather than just another service provider.
Provide forward-looking insights in your reporting.
- Identify industry trends,
- Spot new audience behavior patterns,
- Highlight competitive positioning opportunities
- Recommend strategic pivots based on performance data
- provide contextual market intelligence.
3. Transparency and Trust Building
Business values transparency more than ever. Clear, honest reporting builds trust and credibility, even when results fall short of expectations. Address challenges directly in your reports.
- Explain performance shortfalls
- Outline plans for overcoming obstacles
- Provide context for unexpected results
- Share successes and lessons learned
- and demonstrate proactive problem-solving.
This transparent approach shows your commitment to client success and your ability to handle complex challenges. Real-time dashboards or more frequent check-ins foster ongoing transparency.
4. Client Education and Capability Building
Each report offers an opportunity to educate clients about digital marketing complexities and your work’s value. This education justifies your efforts and opens doors for expanded services and increased budgets.
Transform your reports into educational tools.
- Simplify complex concepts
- Explain strategy interconnections
- Include anonymized client mini case studies
- Provide industry benchmark context
- and demonstrate connections between activities and business outcomes.
5. Competitive Differentiation and Agency Positioning
Your reporting approach differentiates your agency from competitors. Showcase your unique methodology, proprietary tools, or innovative approaches in your reports. Highlight strategy outperformance against industry benchmarks or exceptional results compared to previous campaigns.
This approach demonstrates execution capabilities and your capacity to innovate and lead in your field. It positions your agency as a premium partner rather than a commoditized service provider.
6. Adaptability and Performance Optimization
Marketing requires agility. Clients expect quick adaptation based on performance data. Demonstrate your ability to pivot strategies based on data insights.
- Showcase mid-campaign adjustments and their impact
- Highlight optimization decisions and rationale
- Document test-and-learn approaches
- Demonstrate continuous improvement methodology
- and provide comparative performance scenarios.
This proves your commitment to maximizing results regardless of changing conditions. It showcases both analytical capabilities and strategic flexibility.
The Consequences of Subpar Reporting Practices
What happens when reporting falls short? Poor reporting creates consequences that go way beyond dissatisfied clients.
- Client Attrition Risk – Unclear or uncompelling reports often signal early relationship deterioration. Clients start exploring alternatives.
- Revenue Growth Limitations – Reports that fail to communicate your current value create challenges getting approval for new initiatives or increased budgets.
- Operational Inefficiency – Poorly structured reporting processes waste valuable resources that could support strategy development and execution.
- Team Burnout and Disengagement – Teams that don’t recognize the strategic importance of reports create lower quality work. This creates a negative feedback loop.
- Strategic Partnership Barriers – Inadequate reporting positions your agency as a tactical executor rather than a strategic partner. This limits your potential value and billing rates.
| Reporting Aspect | Effective Practice | Ineffective Practice | Business Impact |
|---|---|---|---|
| Data Presentation | Clear, relevant visualizations tailored to specific insights | Overwhelming, cluttered charts or irrelevant graphics | Comprehension, engagement, and retention of key points |
| Metrics Selection | KPIs aligned with client’s specific business objectives | Generic vanity metrics disconnected from business outcomes | Perceived value and strategic relevance |
| Customization Approach | Reports tailored to each client’s unique goals and industry context | One-size-fits-all templates used across diverse clients | Client perception of agency understanding and investment |
| Insight Development | Actionable recommendations based on data analysis and business context | Raw data presented without interpretation or strategic guidance | Client’s ability to implement changes and see value |
| Narrative Structure | Coherent story explaining the relationship between actions and outcomes | Disjointed facts and figures without clear narrative framework | Comprehension and retention of key information |
| Transparency Level | Honest presentation of both successes and areas for improvement | Selective reporting that conceals challenges or underperformance | Trust development and relationship longevity |
| Educational Component | Clear explanations of complex concepts that improve client knowledge | Technical jargon without context, assuming complete client understanding | Client confidence and perceived agency expertise |
| Feedback Integration | Systematic solicitation and implementation of client input | No mechanism for gathering and responding to client reporting preferences | Report relevance and perceived responsiveness |
Meet Unique Client Needs With Tailored Reporting Frameworks
Each client brings a distinct set of objectives, industry contexts, and information processing preferences. You need to recognize and address these unique requirements through customized reporting approaches. This sets exceptional agencies apart from average service providers.
The Measurable Impact of Personalized Reporting
Personalization isn’t optional in client reporting anymore. Generic, one-size-fits-all reporting approaches consistently underperform compared to tailored frameworks. Experience shows that customized reporting approaches correlate with higher client satisfaction, improved contract renewal likelihood, greater service expansion opportunity, and reduced clarification requests and follow-up meetings.
These observations prove the business case for investing in customized reporting methodologies that align with each client’s specific needs and objectives.
Client Report Prioritizer
Drag and drop the reporting elements to prioritize them based on their importance for a typical client report.
Develop Client-Specific Reporting Strategies
Effective customization starts with comprehensive understanding of each client's unique circumstances, priorities, and objectives.
Identify Core Business Objectives
Customization starts with clarity on what each client truly wants to achieve. Look beyond surface-level goals to understand underlying business priorities.
- What specific growth targets drive their business strategy?
- How does their marketing integrate with their overall business model?
- What internal pressures or stakeholder expectations influence their priorities?
- How do they define success beyond standard metrics?
- What industry-specific challenges impact their performance assessment?
This deeper knowledge lets you design reports that directly address foundational objectives. This makes them immediately more relevant and valuable to key decision-makers.
Align Metrics With Business Goals
Once you identify client core objectives, you can select and highlight metrics that directly connect to these priorities. Here's a framework for alignment.
| Business Objective | Primary Metrics | Secondary Metrics | Strategic Relevance |
|---|---|---|---|
| Market Share Expansion | • Share of Voice • Brand Awareness • New Customer Acquisition | • Competitor Benchmarking • Social Media Reach • Category Penetration | These metrics directly reflect growth in market presence and competitive positioning |
| Customer Retention Enhancement | • Customer Lifetime Value • Churn Rate • Repeat Purchase Rate | • Net Promoter Score • Customer Engagement Metrics • Post-purchase Interaction | Focus on relationship health and sustainability of customer base |
| Profitability Improvement | • Customer Acquisition Cost • Channel-specific ROI • Margin Contribution | • Conversion Rate by Segment • Average Order Value • Cost Per Acquisition Trend | Emphasize efficiency and effectiveness of marketing investment |
| Brand Authority Development | • Thought Leadership Engagement • Industry Citation Rate • Authority Backlink Growth | • Content Engagement Depth • Speaking Opportunity Generation • PR Placement Quality | Measure progress in establishing expertise and credibility |
| Product Launch Success | • New Product Revenue • Market Adoption Rate • Competitive Displacement | • Launch Campaign Engagement • Product-specific Conversion • Customer Feedback Metrics | Track both immediate traction and longer-term integration |
The key isn't just reporting these metrics. You need to explain their significance in relation to the client's specific business context. This transforms data from abstract numbers into meaningful business intelligence.
Customize Report Structure and Presentation
Effective customization goes beyond metrics selection. It encompasses information structure, presentation, and delivery based on client preferences and needs.
Client-Specific Information Architecture:
- Executive Stakeholders: Prioritize high-level KPIs and business impact metrics with minimal technical detail
- Marketing Directors: Balance strategic metrics with tactical performance indicators and optimization opportunities
- Technical Teams: Include deeper platform-specific metrics and more granular performance data
- Cross-functional Teams: Organize metrics by business function (sales, product, customer success) rather than by marketing channel
Presentation Format Customization:
- Visual Learners: Emphasize charts, graphs, and visual representations with minimal text
- Analytical Decision-Makers: Include more detailed data tables and statistical analysis
- Narrative Processors: Structure reports as cohesive stories with clear causal relationships
- Action-Oriented Executives: Lead with recommendations and required decisions rather than data
Delivery Method Optimization:
- Real-time Dashboard Users: Provide always-accessible live data with mobile optimization
- Meeting-Focused Clients: Create presentation-ready formats designed for discussion
- Distributed Teams: Ensure reports work across devices and include collaborative features
- Detail-Oriented Reviewers: Enable drill-down capabilities into supporting data
Implement Client Onboarding for Reporting Success
Solid reporting relationships require intentional foundation-building from the earliest client interactions. Effective onboarding establishes reporting expectations, processes, and success metrics before the first campaign launches.
Defining Reporting Parameters During Onboarding
Collaboratively establish clear reporting specifications with each new client:
- Reporting Scope Definition Identify essential metrics and dimensions for tracking. Establish optimal reporting frequency based on campaign velocity. Determine preferred delivery channels and formats.
- Objective Alignment Develop SMART goals through collaborative discussion. Document specific key performance indicators for tracking. Establish performance baselines and appropriate benchmarks.
- Reporting Methodology Introduction Review data sources and technology infrastructure. Explain quality assurance and data governance practices. Guide clients on interpreting and implementing insights.
Comprehensive Onboarding Checklist
| Onboarding Element | Key Components | Implementation Approach |
|---|---|---|
| Reporting Scope and Cadence | • Key metrics and dimensions • Reporting frequency • Delivery channels and formats | Collaborative workshop with stakeholder input |
| Objectives and Metrics Alignment | • SMART goal development • KPI identification • Baseline establishment | Data-driven discovery session with business leaders |
| Reporting Methodology Introduction | • Data sources and technology • Quality assurance protocols • Insight implementation guidance | Educational training session with practical examples |
| Stakeholder Mapping | • Decision-maker identification • Information needs by role • Approval workflow definition | Organizational assessment and interview process |
| Communication Framework | • Update frequency • Escalation procedures • Feedback mechanisms | Process documentation and workflow implementation |
Thorough onboarding establishes a solid foundation for reporting success that prevents misalignment, reduces revision cycles, and builds client confidence from the outset.
Transform Complex Information into Clear Insights Using Data Visualizations
The ability to present information clearly and compellingly is invaluable. But effective data visualization goes beyond creating pretty charts. It's about translating complex data into actionable insights that clients can easily grasp and act upon.
Let's talk about how to develop this crucial skill.
Select the Most Effective Visual Elements
The key to effective data visualization is choosing the right type of chart or graph for the story you're trying to tell. This involves selecting a client reporting tool with the capability to create diverse and impactful visualizations that resonate with your audience.
The key to effective data visualization is choosing the right type of chart or graph for the story you're trying to tell. This means selecting a client reporting tool that can create diverse and impactful visualizations that resonate with your audience.
Here's a quick guide:
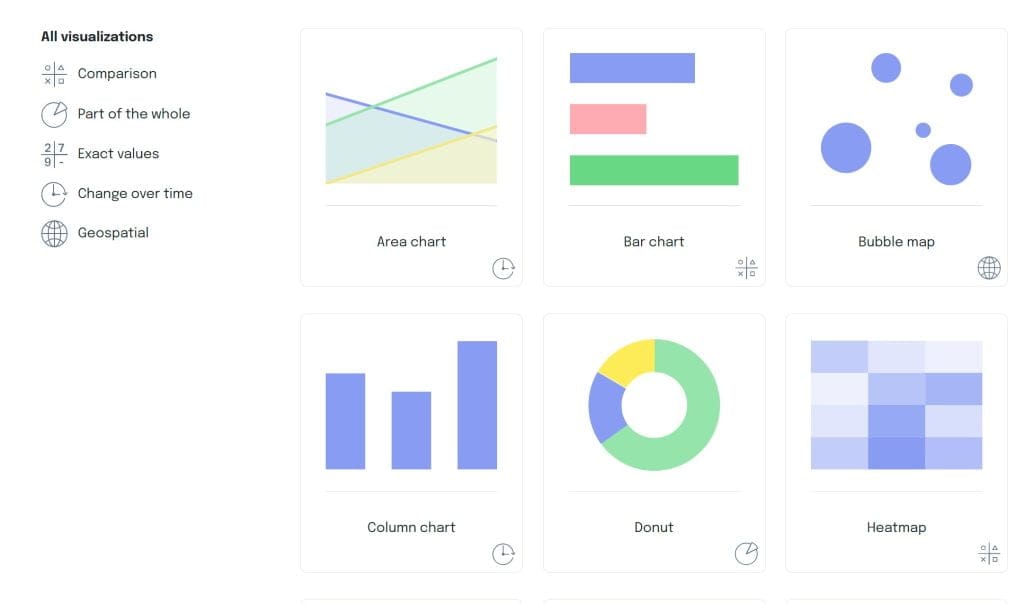
| Data Type | Recommended Visuals | Why It Works |
|---|---|---|
| Comparing Values | Bar Charts, Column Charts | Easy to compare different categories side by side |
| Showing Trends Over Time | Line Charts, Area Charts | Clearly illustrates changes and patterns over time |
| Displaying Composition | Pie Charts, Stacked Bar Charts | Shows how individual parts make up a whole |
| Revealing Relationships | Scatter Plots, Bubble Charts | Helps identify correlations between different variables |
The visualization selection process must prioritize the specific insight you want to communicate rather than visual novelty or complexity.
Core Principles for Effective Data Visualization
Several fundamental principles guide the creation of visualizations that communicate clearly and drive understanding.
1. Cognitive Simplification
Focus each visualization on a single key insight to reduce cognitive load. Charts cluttered with too many data points, series, or dimensions significantly harm comprehension. Research shows working memory typically processes 5-7 items simultaneously. This creates a natural limit for effective visualization.
Implementation Strategies:
- Break complex visualizations into multiple simpler charts
- Use progressive disclosure techniques for detailed exploration
- Employ highlighting to direct attention to key patterns
- Remove decorative elements that don't contribute to understanding
2. Strategic Color Application
Color serves multiple essential functions in data visualization. It groups, highlights, and conveys value. Effective color usage follows specific principles.
Implementation Strategies:
- Use contrasting colors to highlight key metrics or performance outliers
- Employ sequential color scales for continuous data (light to dark)
- Apply diverging color scales for data with natural midpoint (above/below target)
- Maintain consistent color mapping across all client reporting
- Ensure accessibility through color contrast and colorblind compatibility checks
3. Contextual Framing
Data without context lacks meaning and actionability. Effective visualizations incorporate relevant benchmarks, goals, historical comparison, or industry standards to provide interpretive framework.
Implementation Strategies:
- Include target lines or zones on performance charts
- Add historical comparison periods (year-over-year, previous quarter)
- Incorporate industry benchmarks when available
- Highlight significant events or campaign activities on time-series charts
- Use annotations to explain unusual patterns or outliers
4. Clear Labeling and Guidance
Well-designed visualizations require clear identification and explanatory elements to guarantee proper interpretation and focus attention on key insights.
Implementation Strategies:
- Use descriptive titles that state the main finding
- Label axes clearly with appropriate units
- Include concise annotations highlighting key patterns
- Provide brief methodology notes for complex calculations
- Ensure legends clearly distinguish between data series
5. Narrative Integration
Individual visualizations should connect to the broader story within the report. Build toward comprehensive understanding rather than existing as isolated information.
Implementation Strategies:
- Organize visualizations in logical sequence that builds understanding
- Connect insights between related visualizations
- Use consistent formatting across the report for cohesion
- Provide transitional text explaining relationships between visualizations
- Create visual hierarchy that guides attention appropriately
Advanced Techniques to Enhance Your Visuals
As you get more comfortable with basic charts and graphs, consider incorporating more advanced visualization techniques to make your reports stand out.
Heat Maps work great for showing patterns in complex datasets, like website user behavior or geographic performance data.
Stacked Bar Charts are ideal for visualizing customer journeys or sales processes. They show where different stages or categories contribute to the whole. You can use stacked bar charts to highlight where customer drop-offs occur in a sales funnel by comparing completed actions at each stage.
Tree Maps are useful for displaying hierarchical data or part-to-whole relationships in a way that makes it easy to see the relative size of components. This can be particularly effective in showing budget allocations or the distribution of various assets across categories.
Interactive Dashboards allow clients to explore data on their own, diving into areas of interest.
The goal isn't to show off your data viz skills. It's to make complex information easily digestible for your clients. Always prioritize clarity and relevance over flashiness.
How to Conquer Client Reporting Challenges Like a Pro
Client reporting can be tough, especially as data piles up and client needs change. Agencies have their work cut out for them, but with the right approach, these challenges become manageable.
The sheer volume and variety of data is one of the biggest pain points. The trick? Zero in on the data that matters most to your clients. Data integration tools can be a lifesaver here. They help you collect and normalize data without breaking a sweat. Advanced analytics are another secret weapon. They help you surface game-changing insights that might otherwise stay hidden.
Keeping your data honest is another must-tackle challenge. Even one small slip-up can torpedo your report's credibility and seriously dent client trust. The solution includes airtight data validation processes, regular data audits and cleansing, and crystal-clear documentation. It's not just about covering your bases. It's about being transparent with your clients every step of the way.
Keeping all your clients happy can feel like a juggling act. Each one brings different goals, preferences, and levels of tech savvy to the table. The key? Segment your clients based on shared traits. Create modular report components you can mix and match. Serve up insights at different levels of detail. That way, everyone gets what they need.
Create a Compelling Data Narrative That Turns Numbers into Action
Data without context is just noise. Our job as agency professionals isn't just to report numbers. We need to weave those numbers into a compelling narrative that drives action. This is where we truly earn our keep as strategic partners.
Become a Data Storytelling Pro
Data storytelling goes beyond just presenting facts and figures. It's about creating a narrative that engages your audience, highlights key insights, and points the way forward. Here's how to develop this crucial skill.
1. Start with the Big Picture
Begin your report with an executive summary that sets the stage. What were the main objectives for this period? What were the headline results? This gives context to all the detailed data that follows.
Build a compelling opening statement that distills the essence of your report and captures attention with unexpected insights or significant wins. Use this section to set the tone and direction for the entire report.
2. Structure Your Narrative
Just like any good story, your report should have a clear beginning, middle, and end. Consider this structure.
- Beginning: Recap of goals and strategy
- Middle: Detailed results and analysis
- End: Insights and recommendations for the future
Design your narrative arc to build tension around challenges, reveal key insights at the climax, and offer strategic recommendations as the resolution. This structure keeps your audience engaged throughout the report.
3. Highlight Key Takeaways
For each section of your report, clearly articulate the main takeaways. What does this data mean for the client's business? What actions should it drive?
Personalize these takeaways based on your audience's roles and interests. Address specific pain points or goals that resonate with them. Use client-specific terminology to increase relevance and engagement.
4. Use Comparisons Effectively
Data in isolation is often meaningless. Always provide context through comparisons to previous periods, goals, or industry benchmarks. Leverage the power of contrast by juxtaposing different data points to highlight significant changes or opportunities.
Compare performance across channels, time periods, or competitors to add depth to your analysis. Consider using visual aids like before-and-after comparisons for maximum impact.
5. Explain the 'Why' Behind the Data
Don't just report that website traffic increased by 20%. Explain what drove that increase. Was it a particular campaign? A change in SEO strategy? This insight is often more valuable than the number itself.
Humanize your data by translating abstract numbers into real-world implications for the client's business. Use customer stories or case studies to bring data to life and connect metrics to tangible outcomes like revenue growth or cost savings.
6. Create a Clear Call-to-Action
End each section with specific, actionable recommendations. Prioritize your suggestions based on potential impact and ease of implementation.
Provide a clear roadmap for turning insights into strategic initiatives. Give your clients a concrete path forward based on the data you've presented.
Transform Data into Actionable Insights
Every metric you report should tie back to your client's overarching business objectives. This is how you transform your agency from a service provider to a strategic partner.
Start each reporting section with a reminder of the relevant business goal. For example, "To support your objective of increasing market share in the 18-24 demographic, we focused on..."
Quantify the impact of activities in terms of business outcomes. Instead of just reporting a 20% increase in website traffic, calculate the additional revenue this likely generated based on average conversion rates and order values.
Offer Clear, Actionable Recommendations
AA report without recommendations is a missed opportunity. Your clients aren't just paying for a rearview mirror. They want a GPS for the road ahead.
- Prioritize your recommendations. If you're suggesting five different actions, rank them by potential impact and ease of implementation. This helps clients know where to focus their resources.
- Be specific and actionable. Instead of vague suggestions like "improve social media engagement," offer concrete steps like "Increase Instagram Story frequency to 3 per day, focusing on behind-the-scenes content that our audience data shows performs 50% better than product-focused posts."
- Include a proposed timeline and resource requirements for each recommendation. This level of detail shows you've thought through the practicalities of implementation.
Here's an example of how to structure actionable insights.
| Insight | Recommendation | Expected Impact | Timeline |
|---|---|---|---|
| Email open rates have declined by 15% over the past quarter | 1. Segment email list based on engagement levels 2. A/B test subject lines with personalization 3. Optimize send times based on user behavior | 20% increase in open rates within 2 months | Implement over next 4 weeks, measure results for 4 weeks after |
| Social media engagement is highest on Thursdays and Fridays | Shift 60% of social media budget to Thursday/Friday posts | 30% increase in engagement rate, 15% increase in click-throughs | Begin next week, review after 1 month |
Structuring your insights and recommendations this way gives a clear roadmap for improvement.
Conclusion
As we wrap up this deep dive into client reporting best practices, let's recap the key takeaways:
- Reporting is not just a necessary evil – it's a powerful tool for strengthening client relationships and demonstrating your value as a strategic partner.
- Customization is key. Tailor your reports to each client's specific goals, preferences, and pain points.
- Effective data visualization can transform complex data into clear, actionable insights.
- Storytelling brings your data to life. Structure your reports as narratives that engage and inform.
- Always tie your data back to business objectives and provide clear, actionable recommendations.
Great reporting is an ongoing process of refinement. Seek feedback from your clients and team, and don't be afraid to experiment with new formats or techniques.
Transform your client relationships through better reporting. Position your agency not as a vendor, but as an indispensable partner in your clients' success.
So, take these insights, apply them to your next report, and watch as your client relationships – and your agency's reputation – soar to new heights. Here's to clearer insights, stronger partnerships, and continued success. Check out Swydo's client reporting tool that 2,500+ marketing agencies use to impress their clients and keep them engaged.
Client Reporting Best Practices Audit
Evaluate your current reporting practices and get personalized recommendations for improvement. Check off the practices you currently implement.
Strategic Alignment
Data Quality & Visualization
Storytelling & Insights
Customization & Client Experience
Process & Optimization
0%
Best Practices Implementation Score
Personalized Recommendations
Client Reporting FAQ
Direct answers to the most searched questions about client reporting
Client reporting is the process of documenting and communicating marketing performance to clients through regular reports that show results, insights, and recommendations.
It includes performance metrics, data analysis, strategic insights, and actionable next steps that help clients understand their marketing investment's impact on business goals.
Monthly reports work best for most clients. Weekly reports for new campaigns or major launches. Quarterly for strategic overviews.
Match frequency to campaign pace and client preference. Fast-moving campaigns need weekly updates. Established campaigns can use monthly reporting with quarterly business reviews.
A good client report has clear executive summary, relevant metrics, data context, and specific recommendations.
- Executive summary with key takeaways
- Metrics tied to business objectives
- Context like benchmarks and comparisons
- Actionable recommendations with timelines
- Visual elements that enhance understanding
8-15 pages total with 1-2 page executive summary. Busy executives should get key insights in 3-5 minutes of reading.
Structure reports so decision-makers can quickly find essential information while providing detailed sections for team members who need tactical details.
Yes, customize reports for each client's business model, objectives, and decision-making style. Generic reports reduce perceived value.
Use client-specific terminology, focus on their priority metrics, and organize information based on how they consume data. This positions your agency as a strategic partner.
Include business-impact metrics like revenue attribution, customer acquisition cost, conversion rates, and customer lifetime value.
Avoid vanity metrics like impressions or followers unless they directly connect to business outcomes. Focus on metrics that influence client decision-making and demonstrate ROI.
ROI = (Revenue Generated - Marketing Spend) / Marketing Spend × 100
Track revenue attribution through conversion tracking, CRM integration, or call tracking. Include both direct revenue and influenced revenue when possible. Present ROI with context like industry benchmarks.
Vanity metrics are impressive-looking numbers that don't connect to business results. Examples include social media followers, page views, impressions, or email opens without conversion context.
Replace vanity metrics with actionable metrics like qualified leads, conversion rates, customer acquisition cost, or revenue per visitor that directly impact business growth.
CAC = Total Marketing Spend / Number of New Customers Acquired
Include all marketing costs: ad spend, agency fees, tool costs, and internal labor. Track by channel to identify most efficient acquisition sources. Compare CAC to customer lifetime value for profitability analysis.
Attribution is assigning credit for conversions to marketing touchpoints in the customer journey. It shows which channels contribute to sales.
Common models include first-click (credits first touchpoint), last-click (credits final touchpoint), and multi-touch (credits multiple touchpoints). Choose models that match client business cycles.
Google Data Studio (free), Tableau, Power BI, and agency-specific tools like AgencyAnalytics, DashThis, or Reportgarden.
Choose based on budget, technical skills, and integration needs. Start with free tools like Data Studio, upgrade to specialized platforms as requirements become more complex.
Yes, Google Data Studio is excellent for most agency reporting needs. It's free, connects to major marketing platforms, and creates professional-looking dashboards.
Limitations include slower performance with large datasets and limited customization compared to premium tools. Perfect for agencies starting with automated reporting or budget-conscious clients.
$0-$200+ per month depending on features and client volume. Free tools like Data Studio work well. Agency-specific tools range from $50-$200+ monthly.
Factor in setup time, learning curve, and client requirements when evaluating cost. Expensive tools may save enough time to justify the investment for larger agencies.
Yes, automate data collection and basic visualizations but add manual analysis, insights, and recommendations for strategic value.
Automation handles repetitive tasks like data pulls and chart updates. Human analysis provides context, identifies opportunities, and creates actionable recommendations that differentiate your agency.
Common reasons: too long, lacks clear insights, focuses on wrong metrics, or poor visual design.
Solutions: Lead with executive summary, use more visuals, focus on business impact metrics, and ask clients about their preferred format and information needs.
Be transparent, provide context, and present improvement plans. Address poor performance head-on with specific recovery strategies.
Include comparative data for perspective, explain contributing factors, and outline concrete steps for improvement with timelines. Clients value honesty and proactive problem-solving.
Immediately correct errors, explain what happened, and implement prevention measures. Data accuracy is critical for trust.
Send corrected reports promptly, document your quality assurance process, and consider adding data validation checks to prevent future errors. One major data error can damage client relationships.
Guide clients toward 5-7 key metrics that directly impact their business objectives. Too many metrics create confusion and dilute focus.
Create tiered reporting: executive summary with key metrics, detailed section with supporting data. Educate clients on why focusing on fewer, more meaningful metrics drives better decisions.
Acknowledge discrepancies, explain attribution differences, and use a single source of truth like Google Analytics or CRM data when possible.
Different platforms track differently due to attribution models, tracking methods, and data processing. Choose one primary data source and note variations as secondary information.
Connect data sources to reporting tools like Google Data Studio, Tableau, or agency platforms that automatically pull and refresh data.
Set up automated data connections, create template dashboards, schedule report delivery, but manually add insights, analysis, and recommendations for strategic value.
Yes, AI can identify trends, generate insights, and create report summaries. Tools like ChatGPT, Claude, or specialized marketing AI can analyze data patterns.
Use AI for data analysis, trend identification, and draft recommendations. Human oversight remains essential for strategic context, client-specific insights, and relationship management.
Automate: data collection, chart creation, basic calculations. Keep manual: insights, recommendations, strategic analysis.
Automation handles repetitive tasks efficiently. Human analysis provides strategic value through context, interpretation, and actionable recommendations that differentiate your agency from competitors.
1-4 weeks depending on data complexity and tool selection. Simple setups take days, complex multi-platform integrations take weeks.
Factor in data source connections, template creation, testing, and client feedback cycles. Initial setup investment saves significant time on ongoing reporting production.
No, automation enhances account management by handling data tasks so managers focus on strategy, insights, and client relationships.
Automated reports provide data foundation. Account managers add strategic analysis, identify opportunities, facilitate client discussions, and build relationships that drive business growth.
Ready to put all the client reporting best practices into action?
Start Your Free Trial Today