
Your client’s inbox is overflowing. Every agency promises exceptional results. But in 2026, empty promises don’t generate sufficient returns. They’re overwhelmed with metrics, bombarded with ‘vanity measurements’ that don’t translate to business growth.
They need to understand how your content marketing efforts impact their revenue and profitability. That’s where content marketing key performance indicators (KPIs) become essential. Tracking the appropriate metrics demonstrates the tangible value your content marketing strategy delivers. With numerous potential KPIs available, how do you identify the metrics that demonstrate real business impact?
This comprehensive guide reveals the essential content marketing performance metrics that move beyond vanity numbers and demonstrate how your content marketing initiatives drive your clients’ bottom-line results.
What’s the Big Deal About Content Marketing KPIs?
First, let’s establish a clear definition – KPIs aren’t just terminology for client presentations. They’re crucial performance indicators that reveal the effectiveness and impact of your content marketing strategy. The key distinction: all KPIs are metrics, but not all metrics qualify as KPIs.
Consider this analogy: metrics represent individual data points indicating specific activities (website traffic, social media engagement, or email open rates). KPIs are specific metrics directly aligned with your client’s business objectives that demonstrate how effectively you’re achieving what truly matters to their organization.
Similar to how medical professionals wouldn’t evaluate patient health based solely on appearance, you can’t assess content marketing success using surface-level data alone. KPIs provide a more comprehensive assessment.
For example, imagine your agency creates blog content that generates 10,000 page views. That appears impressive initially, and it represents a standard metric. However, if your client’s primary goal involves lead generation, and the post produces zero qualified leads, that view count (while a valid measurement) represents a poor KPI. A more appropriate KPI would measure “number of leads generated from the blog content.”
That demonstrates the significance of proper KPIs. They transcend vanity metrics to connect your content marketing efforts directly to your clients’ business objectives. They provide insights into effective tactics, underperforming content, and how to optimize your approach for improved outcomes.
Ultimately, effective content marketing KPIs enable your agency to:
- Demonstrate the concrete value of your content marketing services
- Justify content marketing budgets and secure ongoing investment
- Identify high-performing content to expand upon
- Diagnose underperforming content and optimize accordingly
- Align your content marketing strategy with clients’ evolving business goals
However, there’s an important consideration. No universal set of KPIs works for every client. The metrics you measure for B2B software companies differ significantly from those for DTC ecommerce brands.
Selecting appropriate KPIs requires deep understanding of each client’s unique business model and how content marketing contributes to their overall growth strategy. Standardized reporting approaches prove ineffective.
So how do you determine the right content marketing KPIs for each client? That’s what we’ll explore next.
Select Your Primary Content Marketing Goal
Recommended KPIs:
How to Select the Right KPIs for Different Clients
Let’s begin with a fundamental question: What’s the first step when selecting KPIs for a client? The correct answer is to examine their business objectives. Surprisingly, many agencies overlook this critical step.
Conduct thorough research before implementing KPI tracking. Selecting appropriate metrics begins with comprehensive understanding of your client’s business operations.
Ask these essential questions during initial discovery and ongoing client discussions:
- What are your primary business objectives? For instance, do you aim to increase market share, reduce customer churn, or launch new products/services?
- Who represents your target audience and what are their purchasing behaviors?
- What role does content marketing play in your overall marketing strategy?
- How do you currently measure marketing effectiveness?
- What are your top 3 priorities for content marketing in the upcoming quarter or year?
The responses to these questions guide your selection of relevant KPIs. Let’s examine some practical examples:
Scenario 1: B2B SaaS Client
Your client offers marketing automation software. Their objectives include generating qualified leads, nurturing prospects through complex sales cycles, and expanding usage within existing accounts.
Key Content Marketing KPIs:
- Marketing Qualified Leads (MQLs) generated through content
- Opportunity/pipeline influence attributed to content
- Content engagement by key decision-makers
- Product adoption/usage rates from content-driven sign-ups
Scenario 2: DTC Ecommerce Client
Your client represents a growing athleisure brand. They focus on social media presence, driving online sales, and building customer loyalty.
Key Content Marketing KPIs:
- Social media following & engagement on content posts
- Referral traffic & conversion rates from content
- Repeat purchase rate of content-acquired customers
- Subscriber growth & email engagement metrics
Notice the significant differences in these KPI selections. Applying identical generic metrics to both clients would provide inadequate measurement. Selecting KPIs requires customization for each business model.
Additionally, KPIs should evolve as your clients’ needs change. The metrics established at engagement initiation may require adjustment over time.
That’s why continuous client communication remains critical. Regular check-ins ensure alignment on objectives and allow KPI adjustments to consistently track what matters most.
Now that you understand how to select appropriate KPIs, let’s explore the most critical metrics for agencies to measure.
The KPIs You Need to Track (And Why They Matter)
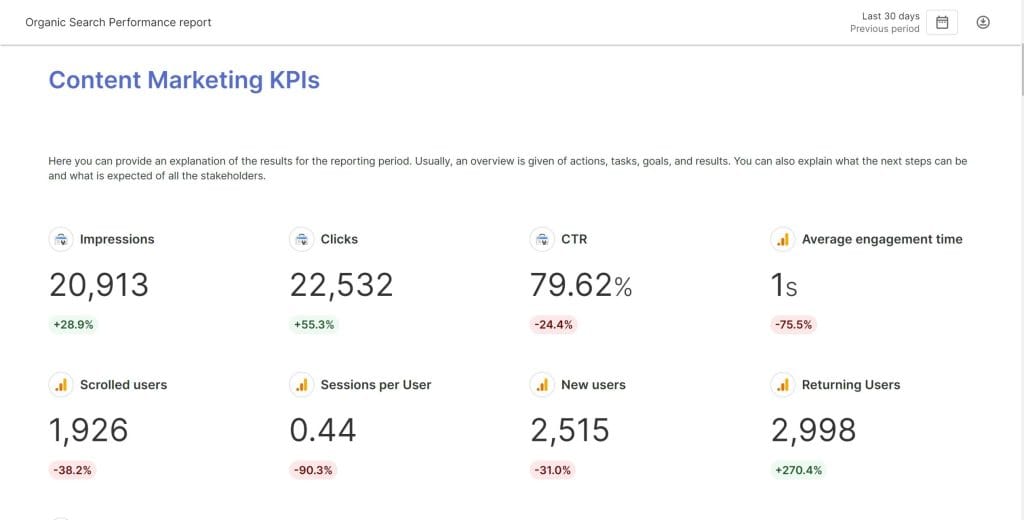
Content Marketing KPIs That Matter in 2024
Why It’s Important: Tracks how well your client’s brand is recognized in their market.
What Does It Measure: Organic traffic, search rankings, share of voice, brand mentions, and referral traffic.
How to Track: Use tools like Google Analytics for organic traffic, SEMrush for share of voice, and Brandwatch for mentions.
Best For: Showing reach and online visibility.
Common Pitfalls: Focusing only on quantity, not the sentiment or quality of mentions.
Advanced Tips: Analyze referral traffic sources and sentiment to prioritize partnerships and opportunities.
Why It’s Important: Reveals how much users care about and interact with your content.
What Does It Measure: Metrics like average engagement time, scroll depth, and social interactions.
How to Track: Use tools like Google Analytics for scroll depth and Hotjar for heatmaps.
Best For: Understanding user behavior and improving content quality.
Common Pitfalls: Relying on vanity metrics like likes without deeper analysis.
Advanced Tips: Set up custom events to track interactions like video plays or resource downloads.
Why It’s Important: Measures the effectiveness of content in turning visitors into potential customers.
What Does It Measure: Conversion rate, cost per lead, lead quality score, and email sign-ups.
How to Track: Use tools like Google Analytics for conversion paths and CRM systems for lead scoring.
Best For: Evaluating the ROI of lead-driven campaigns.
Common Pitfalls: Ignoring lead quality in favor of quantity.
Advanced Tips: Set up multi-touch attribution to understand how content assists in lead generation.
Why It’s Important: Directly ties content performance to client revenue.
What Does It Measure: Revenue attribution, sales cycle length, customer lifetime value (CLV), and return on content investment (ROCI).
How to Track: Use CRM software to monitor touchpoints and sales attribution tools like HubSpot or Salesforce.
Best For: Demonstrating the business impact of content.
Common Pitfalls: Focusing only on last-click attribution and ignoring assisted conversions.
Advanced Tips: Track assisted conversions and use predictive analytics to refine content strategies.
Alright, let’s get down to business. We’ll be discussing four essential content marketing KPIs: brand awareness, engagement, lead generation, and conversions. Get ready, because this is where it gets exciting.
Brand Awareness KPIs That Show Your Client’s Market Presence
Brand awareness measurement presents challenges. However, these reliable metrics help assess performance:
- Organic Traffic: This fundamental measurement tracks visitors finding your client’s website through search engines and provides a starting point for assessment.
- Search Engine Rankings: Monitor where your client’s content appears in search results for relevant keywords, as first-page positioning for target terms indicates effective optimization.
- Share of Voice: This metric quantifies your client’s ownership of online industry conversations. Utilize tools like Semrush, Brandwatch or Sprout Social to monitor mentions across digital platforms. Limited presence in relevant discussions indicates missed opportunities.
- Brand Mentions: Track who references your client online and, more importantly, what sentiment those mentions express. Quality outweighs quantity in this assessment.
- Referral Traffic: Identify which external sites direct visitors to your client, as this demonstrates content reach beyond search engines.
Advanced tip: Don’t simply count mentions. Analyze sentiment behind them. Hundreds of positive mentions deliver significantly more value than thousands of negative references.
Read more: The Ultimate Guide to Content Marketing
Engagement KPIs That Reveal Audience Interest and Interaction
Engagement metrics determine if audiences genuinely value your content. Key measurements include:
- Average Engagement Time: This metric tracks how long visitors actively interact with your content. Brief interactions suggest suboptimal content quality. This metric provides more accurate engagement assessment than traditional “time on page.”
- Scroll Depth: Track how far readers progress through content to determine whether introductions capture attention and content maintains interest throughout. While not a default measurement in most analytics platforms, establishing custom tracking delivers valuable insights.
- Social Media Interactions: Monitor whether your content generates conversations. Don’t limit tracking to shares; evaluate discussion quality. Monitor likes, comments, and shares across platforms for comprehensive social impact assessment.
- New vs Returning Users: Assess whether visitors return for additional content, as this indicates loyal audience development. Analyze behavior differences between new and returning visitors to refine content strategy.
- Pages per User: Track how many pages users view across sessions. This metric reveals overall site engagement and content effectiveness in encouraging further exploration.
- Professional recommendation: Implement heat mapping tools alongside analytics. They visualize exactly where users engage with pages and where interest diminishes, providing detailed content performance visualization.
Strategic consideration: Configure custom events in analytics to track specific interactions relevant to your content strategy. This might include video plays, resource downloads, or interactive element engagement. These custom metrics deliver deeper insights into audience preferences.s, resource downloads, or interactive element engagement. These custom metrics deliver deeper insights into audience preferences.
Lead Generation KPIs for Turning Readers into Potential Customers
For most clients, content must generate leads beyond providing information. Here’s how to measure lead generation effectiveness:
- Conversion Rate: Calculate what percentage of visitors take desired actions, including newsletter subscriptions, whitepaper downloads, or demo requests.
- Cost per Lead: Compare your content creation and promotion investment to lead generation results. Excessive spending for minimal leads indicates strategy adjustment requirements.
- Lead Quality Score: Lead quality varies significantly. Collaborate with your client’s sales team to score leads based on purchase likelihood.
- Content Attribution: Identify which specific content assets generate the most leads. Implement multi-touch attribution models to capture the complete picture beyond last-click analysis.
- Email Subscription Growth: If you utilize content for email list building, closely monitor new subscriber acquisition rates.
Game-changing approach: Implement conversion path analysis in Google Analytics. This reveals the content journey prospects follow before converting. You might discover unexpected content assets driving lead generation.
Read More: How to Create an Effective Content Marketing Funnel
Conversion KPIs That Demonstrate Real Business Impact
Ultimately, content must drive business results, and these KPIs quantify financial impact:
- Revenue Attribution: Calculate how much revenue you can attribute to specific content assets or campaigns, as this metric captures client attention immediately.
- Sales Cycle Duration: Determine whether your content accelerates deal closure by tracking whether leads engaging with content convert faster than those without content interaction.
- Customer Lifetime Value (CLV): Assess whether customers acquired through content demonstrate longer retention or higher spending, as this demonstrates long-term impact.
- Return on Content Investment (Content ROI): Compare revenue generated against content creation and promotion costs. Negative return signals strategy reconsideration requirements.
- Assisted Conversions: Don’t overlook content’s contribution when it doesn’t represent the final touchpoint before purchase but still plays crucial roles in the conversion process.
Advanced strategy: Use customer relationship management (CRM) systems to track content touchpoints throughout the entire sales process. This provides clearer visualization of content influence from initial awareness through final purchase.
Content Marketing KPI Funnel
The key thing to keep in mind with all these KPIs is that tracking them is just the beginning. The real value comes from the insights you glean and the optimizations you make as a result.
Analyze your content performance through these lenses to reveal what’s moving the needle, what’s falling flat, and where untapped opportunities lie. The agencies that will thrive in 2026 and beyond are those that can turn KPI data into strategic advantage.
To do that effectively, get in the habit of frequently reviewing and acting on your KPIs. Let’s talk about some best practices there.
Putting KPIs into Action (Without Losing Your Mind)
As content marketing expert Katherine Rundell at Do My Assignment and Big Assignments explains,
It’s important that for KPIs to function, this figure is accompanied by a methodology… any KPI cannot be a number in isolation – but a number surrounded by a context that gives it meaning… With KPIs that are explicitly linked to your desired outcomes, you can ensure you never lose sight of your marketing goals.
This means that simply tracking metrics isn’t enough; we need to understand what those numbers tell us about our content’s performance and how they relate to our overall goals.
Knowing which KPIs to track is just the start of your journey. The real challenge lies in using them effectively without losing your sanity in the process. Let’s break down how you can put these KPIs into action and get real results for your clients.
First up, resist the temptation to cherry-pick data. We get it – you want to impress your clients. But only reporting on KPIs that make you look good is a recipe for disaster. Instead, show the full picture, warts and all. When you encounter setbacks (and you will), use them as opportunities to improve your strategy. Your clients will appreciate your honesty, and you’ll build trust in the long run.
Raw numbers might look impressive, but they don’t tell the whole story. Context is king in the world of KPIs. When you’re presenting data to your clients, always provide the bigger picture. How do these KPIs compare to last quarter’s performance? What about industry benchmarks? Are you meeting, exceeding, or falling short of your client’s goals? This context helps your clients understand not just what’s happening, but why it matters.
Watch out for those sneaky vanity metrics. You know the ones – they sound important but don’t really move the needle for your client’s business. Before you include a KPI in your report, ask yourself, “How does this actually affect business goals?” If you can’t draw a clear line between the metric and your client’s bottom line, it might be time to reconsider its importance.
Businesses change quickly. Your KPIs need to keep pace. What mattered to your client last year might be old news now. Make it a habit to review and adjust your metrics regularly. Talk to your clients about their evolving goals and changing market conditions. This ongoing dialogue will help you stay on top of what really matters to their business.
While we’re all about data here, don’t forget the human element. Numbers are great, but they’re not the whole story. Customer feedback, insights from the sales team, and other qualitative information can add crucial color to your KPI analysis. These human insights can help explain the ‘why’ behind your numbers and provide valuable direction for your content strategy.
Lastly, beware of analysis paralysis. With so much data at your fingertips, it’s easy to get stuck in an endless cycle of number-crunching. Instead of getting lost in the data, focus on actionable insights. For every KPI you track, ask yourself, “What can we do differently based on these numbers?” This approach will keep your analysis focused and productive.
Implementing KPIs isn’t about perfection – it’s about progress. Start with these principles, adapt them to your agency’s needs, and you’ll be well on your way to using KPIs effectively. Your clients will notice the difference, and your content strategies will be stronger for it.
Content Type Performance Across KPIs
Advanced KPI Strategies to Set Your Agency Apart
Level up your game once you’ve nailed KPI tracking and reporting basics. Agencies that can deploy sophisticated, data-driven content strategies will be the ones leading the pack in 2026 and beyond.
Some advanced plays to consider for your agency:
| Strategy | Description | Tools |
|---|---|---|
| Predictive Analytics | Use historical data to forecast future content performance. This strategy helps you anticipate what will work before it’s published. | Google Analytics 4, HubSpot, Tableau |
| AI-Powered Content Analysis | Tools like MarketMuse or Frase analyze your content against top performers in your niche, offering AI-driven suggestions to enhance your content. | MarketMuse, Frase, Clearscope |
| Custom Data Dashboards | Build real-time dashboards pulling data from various sources to provide clients with instant access to their KPIs. | Looker Studio, Tableau, Swydo |
| Competitive Content Gap Analysis | Analyze competitor content to identify opportunities and gaps in your own strategy. This approach helps you stay one step ahead of the competition. | SEMrush, Ahrefs, BuzzSumo |
| Micro-Conversions | Track smaller actions, such as video views or tool interactions, that eventually lead to larger conversions. This gives insight into the buyer’s journey. | Google Analytics 4, Hotjar, Crazy Egg |
| Content Decay Analysis | Identify when high-performing content begins to decline in effectiveness, signaling when it’s time to refresh or repurpose it. | Ahrefs, SEMrush, Google Analytics 4 |
Tools to Track and Optimize KPIs
The right tools are essential for effective KPI tracking. Here are a few that will help:
Google Analytics 4 (GA4): GA4 is critical for monitoring user behavior across your website. Whether tracking traffic, time on page, or conversions, this tool provides detailed data on how visitors engage with your content and move through the customer journey.
SEO Tools (Ahrefs, Semrush): SEO is a major factor in driving organic traffic. Use these tools to track keyword rankings, backlinks, and SEO performance. Monitoring these metrics helps you keep content optimized for search engines.
Looker Studio: For detailed, customized data visualization, Looker Studio is an excellent tool. It pulls data from multiple platforms into one place, making it easier to present a full view of content performance.
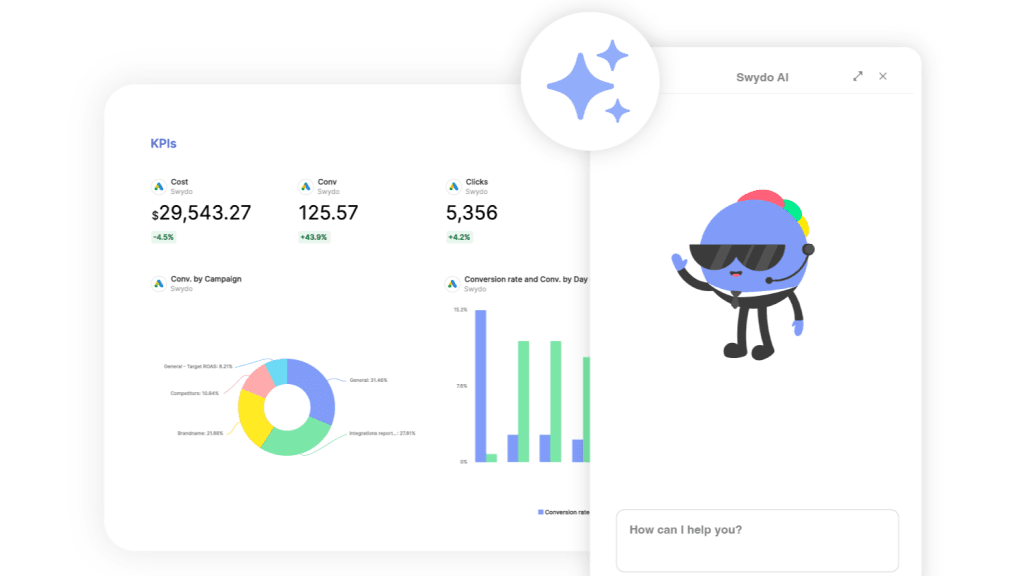
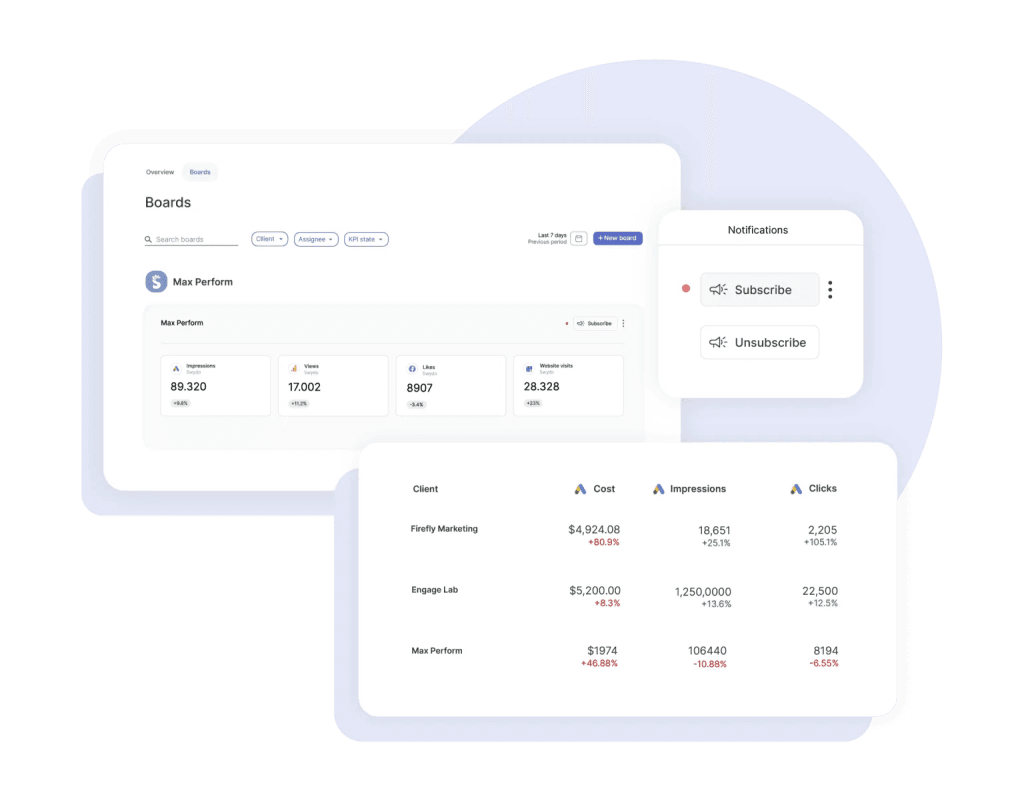
Swydo: Swydo offers more than just data tracking. With real-time alerts and automatic reporting, it simplifies performance monitoring. Set up custom alerts to respond quickly to drops or spikes in key metrics without having to constantly check reports.
Conclusion
We’ve covered extensive ground regarding content marketing KPIs. The fundamental takeaway: Content marketing KPIs extend beyond client value demonstration. They continuously improve your agency’s performance.
Effective KPIs tell compelling stories. They demonstrate how your content transforms strangers into leads, leads into customers, and customers into brand advocates. Master these performance indicators, and your agency becomes an indispensable partner for clients seeking measurable business growth.
Key Takeaways
- Track multiple KPIs across the marketing funnel for comprehensive performance assessment
- Align KPIs with specific business objectives and content marketing strategy
- Regularly monitor and analyze trends to optimize content strategy
- Leverage KPI insights to guide future content creation and distribution
Enhance your content marketing strategies by implementing these insights for maximum effectiveness.
Content Marketing KPIs FAQ
Quick answers to your most common content marketing metrics questions
A KPI (Key Performance Indicator) in content marketing is a measurable value that shows how effectively your content achieves specific business goals. Unlike regular metrics that just track activity, KPIs directly connect to outcomes that matter to your business—like lead generation, sales, or brand awareness.
A metric is any data point you can measure (like page views or social likes). A KPI is a specific metric tied to a business goal. For example, “10,000 page views” is a metric, but if your goal is lead generation and those views generated zero leads, it’s not a meaningful KPI. A better KPI would be “leads generated from content” because it directly measures business impact.
Track 5-8 KPIs that cover different stages of your marketing funnel. This gives you a complete picture without drowning in data. Focus on one or two KPIs for each stage: awareness (like organic traffic), engagement (like time on page), lead generation (like conversion rate), and conversions (like revenue attributed to content).
Vanity metrics are numbers that look impressive but don’t connect to real business results. Examples include total page views without context, social media follower counts, or email list size. While these can indicate reach, they don’t tell you if content is actually driving leads, sales, or customer actions that matter to your bottom line.
For B2B, focus on Marketing Qualified Leads (MQLs), sales pipeline influence, content engagement by decision-makers, and sales cycle length. B2B buying cycles are longer, so track how content assists conversions throughout the journey, not just at the final touchpoint. Customer lifetime value (CLV) from content-acquired customers is also crucial.
Use this formula: [(Revenue from Content – Cost of Content) ÷ Cost of Content] × 100 = ROI%. For example, if you spent $10,000 on content and generated $40,000 in revenue, your ROI is 300%. Include all costs: staff time, tools, promotion, and creation expenses. Track revenue using attribution models that show which content influenced sales.
Any ROI above 100% means you’re profitable (making more than you spent). Most successful content marketing programs achieve 300-400% ROI or higher. However, content marketing is a long-term investment—it can take 9-18 months to break even before seeing strong returns. Remember that quality content continues generating value for years, increasing total ROI over time.
Expect 6-12 months for initial results and 12-18 months for substantial ROI. Content marketing is a long game—search engines need time to index and rank content, audiences need time to discover and trust your brand, and leads need time to move through your funnel. However, once established, content continues generating returns for years with minimal additional investment.
Include all expenses: staff salaries (calculate hourly rates × time spent), freelancer/agency fees, content tools and software, design and video production, paid promotion and distribution, and overhead costs. Don’t forget hidden costs like management time, training, and technology subscriptions. Accurate cost tracking is essential for meaningful ROI calculations.
Use multi-touch attribution that tracks every content interaction in the customer journey. Set up UTM parameters on all links, use Google Analytics conversion paths, and integrate your CRM to see which content touches customers before they buy. Look beyond last-click attribution—content often assists conversions without being the final touchpoint. Track both first-touch (awareness) and assisted conversions.
Bounce rate is the percentage of visitors who leave your website after viewing only one page without taking any action. A bounce rate below 40% is excellent, 40-60% is average, and above 60% needs improvement. However, context matters—a blog post where readers find their answer and leave might have a high bounce rate but still be successful. Focus on whether visitors are achieving their goals.
Conversion rate is the percentage of visitors who complete a desired action (like filling out a form, downloading a resource, or making a purchase). Calculate it by dividing conversions by total visitors, then multiply by 100. For example, if 100 people visit your landing page and 5 download your ebook, your conversion rate is 5%. This shows how effectively your content drives action.
“Time on page” measures total duration, including inactive time when users leave tabs open. “Engagement time” (used in Google Analytics 4) only counts active interaction—scrolling, clicking, typing. Engagement time is more accurate for measuring genuine interest. High engagement time means users are actively consuming your content, not just leaving a tab open.
It varies by industry and content type. For landing pages, 2-5% is average, while 10%+ is excellent. For blog-to-lead conversions, 1-3% is typical. Email opt-in rates of 2-5% are good. However, focus on your specific goals and industry benchmarks. More important than hitting a “good” number is improving your rate over time and ensuring leads are high-quality.
Customer Lifetime Value is the total revenue a customer generates throughout their relationship with your business. Calculate it as: Average Order Value × Purchase Frequency × Customer Lifespan. For content marketing, track CLV to see if content-acquired customers are more valuable long-term than customers from other channels. This shows content’s true business impact beyond initial conversion.
Scroll depth measures how far down a page visitors scroll, usually shown as a percentage (25%, 50%, 75%, 100%). It reveals if people are reading your full content or leaving after the intro. Track it using Google Analytics 4 events or tools like Hotjar. If most users only scroll 25%, your intro isn’t engaging enough or your content is too long.
Essential tools: Google Analytics 4 (traffic and conversions), SEMrush or Ahrefs (SEO and rankings), CRM software like HubSpot or Salesforce (lead tracking and attribution), and visualization tools like Looker Studio or Tableau (dashboards). For deeper insights, add Hotjar (engagement heatmaps) and marketing automation platforms (lead scoring). Start with Google Analytics and add tools as needed.
Check weekly for quick insights and spotting issues early. Report monthly to track trends and make tactical adjustments. Review quarterly for strategic decisions and major strategy shifts. Daily monitoring isn’t necessary and can lead to overreacting to normal fluctuations. Set up automated alerts for significant drops or spikes so you’re notified immediately of urgent issues.
Google Analytics 4 (GA4) is the latest version of Google Analytics, replacing Universal Analytics. Yes, you need it—it’s now the only option. GA4 tracks user journeys across devices and platforms, focuses on events rather than pageviews, and uses AI for predictive insights. It’s essential for tracking content performance, user behavior, conversions, and engagement metrics.
Use Looker Studio (free) or Tableau. Connect your data sources (Google Analytics, social media, CRM). Display 5-8 key metrics organized by funnel stage: awareness (traffic, rankings), engagement (time on page, scroll depth), leads (conversion rate, MQLs), and revenue (sales, ROI). Update automatically and share with stakeholders. Keep it simple—one screen, clear visuals, focused on metrics that drive decisions.
Include: Executive summary (top 3-5 insights), KPI performance vs. goals (with trends), top-performing content pieces, insights and recommendations, and action items. Show both successes and challenges. Use visuals (charts, graphs) for easy scanning. Connect metrics to business impact—don’t just report numbers, explain what they mean and what you’ll do differently based on the data.
Start with your current baseline performance, then set goals for 10-20% improvement per quarter. Research industry benchmarks to understand what’s typical for your sector. Factor in your resources, content maturity, and business stage. New programs need longer timelines. Review and adjust goals quarterly—content marketing compounds over time, so expectations should increase as you build momentum and authority.
Lead with business impact, not activity. Start with revenue generated, leads acquired, or cost savings achieved. Use simple visuals and tell a story—show the journey from awareness to conversion. Compare against goals and previous periods. Be honest about what’s not working and explain your plan to improve. Executives care about ROI and business growth, not vanity metrics or technical details.
Track the right content KPIs and prove your value to clients.
Start Your Free Trial Today