
If you’re reading this, chances are you’ve hit a wall with Databox. Maybe you’re frustrated with system outages, tired of paying extra for white-labeling, or you’ve finally had enough of customer support that takes forever to respond. You’re in the right place.
Agencies start with Databox because it looks powerful, then leave 6-18 months later because the reality doesn’t match the promise. The good news? The market has caught up, and there are alternatives that actually work better for most agencies—often at half the cost.
This won’t be one of those listicles that just copies feature lists from vendor websites. You’ll learn exactly what makes each alternative worth your consideration, who each tool actually serves, and how to pick the right one based on your real-world situation. By the end, you’ll know which tool fits your agency.
Why Agencies Are Moving Away From Databox
Let me be direct: Databox isn’t a bad tool, but it’s becoming the wrong tool for most marketing agencies.
Here’s what shows up consistently when you dig into user experiences.
Reliability and technical issues appear across review platforms. User feedback on G2, Capterra, and other platforms includes reports of metrics breaking, data sync issues, and templates that stop working unexpectedly. The frequency and severity of these issues varies by user, but the pattern appears often enough to warrant attention.
Think about it—when your client presentation happens tomorrow and your metrics aren’t updating correctly, that creates more than just an inconvenience. It threatens your business relationship directly. Can you afford that risk with your top clients?
Before you make any decision, check recent reviews yourself on G2 and Capterra. Filter by date to see what users report in the last 3-6 months. User experiences vary significantly, and what matters is whether the issues people report align with your specific use case.
Customer support quality receives mixed feedback. User reviews across platforms show inconsistent support experiences. Some users report helpful and responsive support, while others describe delays and frustration. The experience seems to depend on the type of issue, timing, and possibly which support tier you’re on.
When you’re paying hundreds per month for a tool, you deserve responsive support. How long can you wait when a client report needs to go out today? Check Trustpilot as well—you’ll see more positive support experiences there, which suggests the reality is more nuanced than any single review platform shows.
The pricing structure includes multiple add-ons. According to Databox’s official pricing page, the Professional plan starts at $159/month with 3 data sources included. White-labeling requires an additional $250/month add-on package. Each data source beyond your plan limits costs $5.60. The Growth plan at $399/month and Premium at $799/month add more capacity but still charge for extras.
Your tools should get cheaper per client as you scale, yet these add-ons stack up quickly. Are you really saving money when you’re paying $250/month just to remove their branding from your reports?
Data accuracy concerns appear in user feedback. Reviews across platforms mention situations where reported metrics don’t match source platforms. The causes vary—integration issues, API changes, calculation differences—but the result is the same: you’re explaining discrepancies to clients.
When a client asks why your report shows 147 conversions but Google shows 152, you can’t explain the discrepancy even though the problem stems from your tool rather than your work. How many times can you have that conversation before your client questions your competence?
Do your own research before deciding. Don’t take my word for it or anyone else’s. Spend 30 minutes reading recent reviews:
- G2 Databox Reviews – Filter by most recent
- Capterra Databox Reviews – Sort by date
- Trustpilot Databox Reviews – Check the last 6 months
Look for patterns in the types of issues people report. More importantly, see if those issues would affect your specific workflow. A problem that’s dealbreaker for one agency might be irrelevant to yours.
What to Look for in a Databox Alternative
Before we get into specific tools, let’s establish what actually matters. I’ve helped agencies choose reporting platforms, and the agencies that make good decisions focus on seven criteria.
Integration quality beats integration quantity. A tool with 500 integrations sounds impressive until you realize only 6 of them matter to your clients. We understand perfectly well that integration count doesn’t help if the ones you need keep breaking.
Look for fully-managed integrations where the vendor maintains the connection. Third-party partner integrations break when APIs change, and you’re the one who has to explain to your client why their report didn’t run.
AI features are becoming more important. Modern reporting tools now incorporate AI for automated insights, report generation, and anomaly detection. While not every agency needs these features today, they’re becoming more common as the technology matures and proves its value in reducing manual work.
Do you want to spend hours each week writing report summaries, or would you rather focus on strategy?
White-labeling should come included. Your clients shouldn’t see another company’s branding on reports they’re paying you to create. Any tool that charges extra for this basic feature makes agencies pay twice for what should be standard.
Think about how it looks when your client opens a report and sees “Powered by Databox” at the bottom. Does that reinforce your expertise or make you look like a middleman?
Unlimited users matter more than you think. Per-user pricing models mean you pay more as your team grows. That makes no sense. Your reporting tool should support collaboration instead of penalizing it.
How many times have you avoided giving someone access because you didn’t want to pay for another seat?
Data refresh frequency matters. Daily updates might be acceptable for some agencies, but clients increasingly expect to see performance updates within hours. Check what data refresh rates each tool offers and whether it matches your client expectations.
When a client logs in at 2pm to check their campaign performance, do they see this morning’s data or yesterday’s?
Customer support quality predicts long-term satisfaction. Every tool breaks from time to time. The difference between a minor annoyance and a major crisis is whether you can get help quickly.
During your evaluation, actually contact support and time the response. If they’re slow during the sales process, they’ll be worse after you’ve paid.
Total cost of ownership includes time savings. A tool that costs more monthly but saves you significant time weekly is often cheaper than a low-cost tool that requires extensive manual work. Calculate the value of time saved based on your billable rate to understand true cost.
If you’re spending 10 hours a week on reporting at $150/hour, that’s $1,500 in time cost. Could a better tool cut that in half?
The 7 Best Databox Alternatives and Who They Actually Serve
AgencyAnalytics for Comprehensive Integrations at Strong Value
AgencyAnalytics positions itself as a value-focused option by including extensive integrations and unlimited users on all plans.
Why agencies appreciate this platform: You get unlimited clients, unlimited users, unlimited dashboards, and unlimited reports on every plan. Pricing is based on active campaigns you’re managing rather than per-user or per-seat models.
For a small team managing multiple clients, this pricing structure can be more predictable than alternatives. You’re not constantly calculating whether adding a new team member makes financial sense.
The platform also includes time tracking and task management features.
The white-label capabilities: You can fully customize with your logo, colors, and custom domain (reports.youragency.com). The level of white-labeling included at base pricing tiers is more comprehensive than what many competitors charge extra for.
How the pricing works:
| Plan | Monthly Cost | Campaigns Included | Best For |
|---|---|---|---|
| Freelancer | Starts around $79 | Up to 5 | Solo consultants or very small agencies |
| Agency | Starts around $239 | Up to 25 | Small to mid-sized agencies |
| Enterprise | Custom | 25+ | Larger agencies with complex needs |
A “campaign” represents one client service. If you manage SEO plus PPC for a client, that counts as two campaigns. So if you have 10 clients and you manage both SEO and PPC for each, you’re managing 20 campaigns total.
Who should choose this tool: Small to mid-sized agencies (2-25 employees) focused on SEO, PPC, and social media who want strong value per dollar. If you’re managing a defined number of campaigns and your clients mostly use mainstream platforms (Google, Facebook, LinkedIn, Twitter, Instagram), this offers solid features at accessible pricing.
Are you currently paying for separate rank tracking tools? This could replace them.
What to consider before committing: The platform focuses on mainstream integrations, so verify that all platforms you need are supported before you commit. If your clients use niche platforms, check the integration list first. Some advanced features like API access may be available only on higher-tier plans.
Check the reviews yourself: Look at recent feedback on G2 and Capterra to see what current users say about their experience.
Swydo for Predictable Per-Source Pricing
Swydo takes a different approach to pricing—you pay per data source instead of per user or per client.
How the pricing model works: The base plan starts at $69/month and includes 10 data sources, unlimited users, unlimited clients, and unlimited reports. More sources follow sliding scale pricing.
A “data source” is one platform account: one Google Ads account, one Facebook page, or one GA4 property.
Here’s an example: Let’s say you have 15 clients. Each client uses Google Ads, Facebook, and GA4. That’s 45 data sources total. The base covers 10 sources, and you’d pay for the additional 35 at their per-source rate.
Once you understand your total source count, the scaling becomes predictable. Do your clients all use the same platforms, or does every client want something different?
The features built for agencies: Swydo includes features built with agency workflows in mind. Monitoring all your clients in one single overview dashboard, goal tracking, customizable templates, automated data source health checks and more.
Think about how much time you spend each month making the same edits to 20 different client reports. What if you could make the change once? Or accidentally send out a report with a data error connection?
What you need to know about integrations: Swydo’s platform offers 30+ native integrations. This represents a smaller list than some competitors. Missing platforms include:
- Amazon Ads
- Google DV360
- Some marketing automation tools
If your clients use platforms outside their supported list, you’ll need workarounds like Google Sheets imports. That adds manual work back into your process.
Who should choose this platform: Agencies that manage 10-100 clients with consistent service packages. The per-source pricing model works well when you can predict your data source needs.
Do you offer the same service package to every client, or does each client get a custom combination of platforms?
What to watch out for: The smaller integration library (30+ platforms) means you need to verify all your required platforms are supported. AI-powered features currently available for automated insights or report generation.
Check the reviews yourself: See what users say on G2 and Capterra before making your decision.
Funnel for Data Flexibility and Warehouse Integration
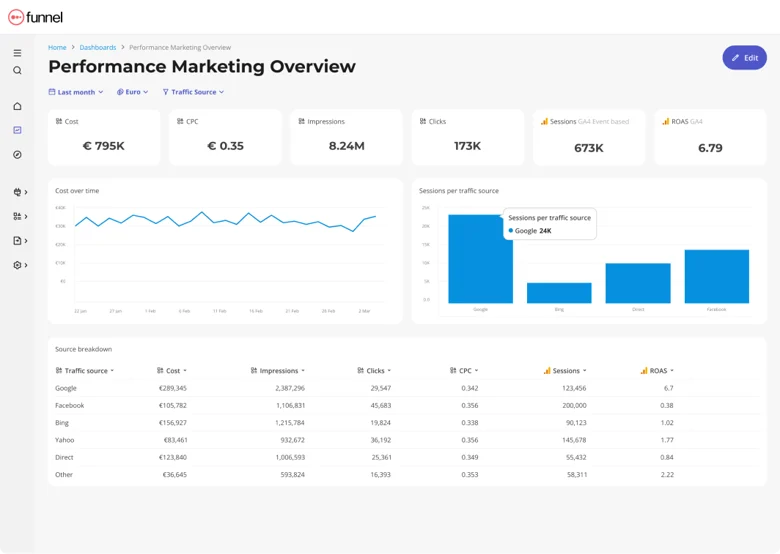
Funnel takes a different approach by positioning itself as a data hub that collects marketing data and lets you send it wherever you need it.
What makes this different: According to Funnel’s documentation, most tools are visualization platforms that connect to data sources and display dashboards. Funnel collects from 590+ sources, normalizes the data, and lets you export it to BI tools (Tableau, Power BI, Looker), data warehouses (BigQuery, Snowflake, Redshift), spreadsheets (Google Sheets, Excel), or their built-in dashboards.
The significance here: You’re not locked into one visualization tool. You can use Funnel to collect data, then visualize it in your preferred BI platform today and switch tools later while keeping your historical data. Funnel emphasizes that unlike “walled garden” approaches, their platform lets you export raw data freely.
Are you worried about migrating to a new tool and losing all your historical data? This solves that problem.
The free plan worth mentioning: Funnel offers a free tier with 4 data sources (connectors), unlimited dashboards, and unlimited users, with the ability to export to Google Sheets. For new agencies just starting out, this provides a legitimate entry point.
You can start free and upgrade when you’re ready. No credit card required upfront.
How they approach pricing: Usage-based pricing that scales with your data complexity and volume through a “flexpoints” system. Plans vary based on your specific needs, so you’ll need to discuss pricing with their sales team to get an accurate quote for your situation.
Who should choose this platform:
- Agencies with technical teams who want to build custom analytics beyond basic reporting
- Agencies planning long-term who want to avoid vendor lock-in
- Agencies serving enterprise clients who require data in specific formats or warehouses
If you have data analysts or someone comfortable working with data, Funnel provides flexibility. Do you have someone on your team who knows SQL or wants to build custom data pipelines?
Who should skip this option: Small agencies without technical staff might find the flexibility overwhelming. If all you need is straightforward client reports and PDFs, simpler tools accomplish that faster.
Check the reviews yourself: Read current user experiences on G2 and Capterra to see what actual users report.
DashThis for Speed and Simplicity
DashThis focuses on simplicity—connect data sources, drag widgets onto dashboards, and send reports to clients quickly.
The speed advantage worth noting: According to DashThis, their platform is designed for fast setup. Many agencies can create their first client dashboard within minutes rather than hours.
For agencies who bill hourly, time saved on setup multiplied across clients adds real value. If you’re spending 2 hours setting up each new client dashboard, and you onboard 5 clients per month, that’s 10 hours you could bill elsewhere.
What comes with the platform:
- Pre-built integrations covering core platforms agencies use daily
- Pre-built templates for common report types (SEO, PPC, social media, email marketing, web analytics)
- Unlimited users on all plans
- Automated scheduled reports
How the pricing breaks down:
| Plan | Monthly Cost | Dashboards Included | Per Dashboard Cost |
|---|---|---|---|
| Individual | $49 | 3 | ~$16.33 |
| Professional | $149 | 10 | ~$14.90 |
| Business | $289 | 25 | ~$11.56 |
| Enterprise | Custom | Custom | Negotiable |
Based on their pricing structure, a “dashboard” represents one client report. So if you have 15 clients, you need 15 dashboards. This creates what some call a “tier jump challenge”—if you need 30 dashboards, you’d need to move beyond the Business tier, potentially paying for capacity you don’t fully use.
Who should choose this tool: New agencies or freelancers (1-5 people) who manage under 20 clients and need something working quickly. Agencies with non-technical teams who need straightforward functionality without extensive training.
Are you frustrated with tools that take weeks to learn? This one aims to get you productive on day one.
What to consider first: Customization options are more limited compared to enterprise-focused tools. As agencies grow beyond 20-30 clients, the per-dashboard pricing model may become less cost-effective than alternatives offering unlimited clients.
Do the math—if you have 30 clients at roughly $10-15 per dashboard, compare that to tools with unlimited client tiers.
Check the reviews yourself: See what actual users report on G2 and Capterra.
Whatagraph for AI-Powered Reporting and Agency Scalability
Whatagraph is a reporting tool built specifically for marketing agencies, with features designed around multi-client management and automation.
Why agencies make the switch: Whatagraph IQ, their AI engine, helps generate client reports faster than manual creation. The platform includes 55+ fully-managed integrations covering platforms agencies commonly use: Google Ads, Meta platforms, LinkedIn Ads, TikTok, GA4, Search Console, Mailchimp, HubSpot, and social media platforms.
According to their platform documentation, these connectors are maintained by dedicated engineers. The platform advertises approximately 30-minute data refresh for most integrations, though specific connectors like Google Sheets may refresh on different schedules. That means when something breaks, it’s their problem to fix, not yours.
How the pricing works:
| Plan | Monthly Cost | Data Sources | Users | Clients | White-Labeling |
|---|---|---|---|---|---|
| Start | $229 | 20 | Unlimited | Unlimited | Included |
| Boost | $579 | 60 | Unlimited | Unlimited | Included |
| Max | Custom | 100+ | Unlimited | Unlimited | Included |
Based on their current pricing structure, no per-user charges and no expensive white-labeling add-on. You’re paying for data sources, which scales with your actual business growth.
Who should choose this platform: Mid-sized agencies (10-50 employees) who manage 15-100 clients and value time savings with reliable, fully-managed integrations. Agencies focused on paid advertising, social media, and SEO will find it purpose-built for their workflow.
If you need white-labeled reports that you can send directly to clients without editing, this tool is designed for that use case. How much time do you currently spend removing competitor branding from your reports?
Who should skip this option: Very small agencies (1-5 people, under 10 clients) might find the $286/month entry point high when starting out. Agencies that need niche integrations like Amazon Ads should verify connector availability first.
Are you willing to pay more monthly if it saves you 10+ hours per week on report creation?
Check the reviews yourself: Read what users say on G2 and Capterra to see actual user experiences.
Looker Studio as a Free Option With Important Caveats
Looker Studio (formerly Google Data Studio) is Google’s free data visualization tool. The word “free” is compelling, but there’s important context.
What comes included at no cost:
- Unlimited dashboards
- Unlimited users
- Unlimited reports
- Native integration with the Google ecosystem (Google Ads, Google Analytics 4, Search Console, Google Sheets, BigQuery, YouTube Analytics)
For agencies that manage clients exclusively within Google platforms, this is genuinely free and capable.
The important catch to understand: Only Google platforms connect natively for free. To connect Facebook, Instagram, LinkedIn, TikTok, or other non-Google platforms, you need third-party connector services like Supermetrics, which adds monthly costs ranging from tens to hundreds of dollars depending on your data sources and volume.
So “free” quickly becomes not-free once you add the platforms your clients actually use. Are all your clients really Google-only?
The feature limitations to know:
| Feature | Looker Studio | Paid Alternatives |
|---|---|---|
| White-labeling | Limited customization (vendor branding present) | Usually fully customizable |
| PDF export | Available but limited (only exports visible content on screen) | Full PDF export standard |
| Customer support | Community forums only | Direct vendor support |
| Multi-platform integrations | Requires paid third-party tools | Usually included |
While Looker Studio does allow PDF downloads, the export functionality is limited—it only captures what’s visible on screen, which means large data tables get cut off and complex visualizations may not render completely. For comprehensive, audit-ready client reports, this limitation often requires workarounds.
Who should choose this platform: Agencies exclusively managing Google ecosystem campaigns (Google Ads, GA4, Search Console) where the free integrations cover 100% of client needs. Agencies just starting with zero budget who can work within the limitations.
Are you comfortable with limited PDF export capabilities? Do your clients have Google accounts to view live dashboard links?
Who should avoid this option: Agencies that need multi-platform reporting across Google, Facebook, LinkedIn, and other channels. Agencies whose clients expect professional white-labeled PDF reports without limitations. Anyone who needs guaranteed vendor support when technical issues arise.
When something breaks at 11pm before a morning client meeting, who do you call?
Improvado for Enterprise Agencies and Complex Data Needs
Improvado operates at enterprise scale. This is marketing intelligence for agencies managing Fortune 500 clients or large organizations with sophisticated data governance requirements.
What makes this enterprise-focused: According to Improvado, their platform offers 500+ data connectors maintained by their engineering team. Features include:
- AI Agent for natural language queries (available as an add-on)
- Advanced data governance with role-based access control
- Marketing-specific data transformations that understand attribution models and cross-channel analytics
- SOC 2 compliance and other certifications
What to know about implementation: This isn’t a self-serve tool you set up in a day. Implementation involves working with their team for proper configuration and onboarding, with dedicated customer success support. You’re implementing a data infrastructure rather than just a dashboard tool.
Do you have weeks or months to dedicate to implementation, or do you need something working this week?
How they approach pricing: Custom pricing based on your data sources, complexity, and specific requirements through their Growth, Advanced, and Enterprise tiers. This is positioned for larger agencies or enterprise brands with substantial marketing budgets who need sophisticated analytics capabilities.
Who should choose this platform:
- Large agencies (50-500+ employees) managing enterprise clients with complex data requirements
- Agencies that need to connect dozens of marketing platforms and normalize data across all of them
- Organizations with strict compliance requirements (healthcare, finance) where certifications matter
Are your clients asking for SOC 2 compliance reports? Do you need HIPAA-compliant data handling?
Who should skip this option: Small to mid-sized agencies where the complexity and cost exceed practical needs. If you’re a boutique agency, simpler tools will serve you better at lower cost and faster implementation.
Check the reviews yourself: See what enterprise users report on G2 and Capterra.
How to Actually Choose the Right Tool for Your Agency
Forget feature comparison matrices for a minute. Here’s the framework I walk agencies through when they’re evaluating options.
1. Start with your actual client platform usage. Open a spreadsheet right now. List every client, then list what platforms you manage for each client. Count total data sources.
If 90% of your clients use the same 6-8 platforms, you don’t need a tool with 500 integrations. You need a tool where those 6-8 connectors are rock-solid reliable. This single exercise eliminates half your options immediately.
What platforms are you actually connecting to every day?
2. Calculate your true cost per client managed. Take the monthly tool cost and divide by your client count. Then add the time cost.
If a tool requires significant time per client monthly and your billable rate is $150/hour, factor that lost productivity into your total cost calculation. A tool with higher monthly fees but faster workflows may actually cost less per client than a cheaper tool that requires more manual work.
Here’s a simple formula:
True Monthly Cost = (Tool Subscription Cost + (Hours Spent × Hourly Rate)) ÷ Number of Clients
Which number matters more to you—the subscription price or your total time investment?
3. Run real trials with real data. Don’t just click around demo environments. Connect your actual data sources, build a complete report for one real client, and see how long it takes.
Can you replicate it for client #2 quickly, or does it take substantial time again? That scaling factor matters significantly.
Time yourself. Write down how many minutes each step takes. You’ll be surprised where the time goes.
4. Test customer support during trials. Intentionally submit 2-3 support questions during your trial period. Time the responses. Rate the helpfulness.
If you’re getting quick, helpful responses during the trial, you’ll probably get good support as a customer. If responses are slow or unhelpful during the evaluation phase, that’s what you’ll experience ongoing.
What happens when you submit a ticket at 8am? Do you get a response by noon, or three days later?
5. Consider your team’s technical skill level honestly. Your agency might have people who can work with code and technical configurations, or you might have marketing specialists who prefer straightforward interfaces.
Some tools require technical expertise for customization. Others are designed for non-technical users. Choosing wrong here leads to a tool that nobody uses effectively.
Can your team handle SQL queries, or do they need drag-and-drop simplicity?
6. Factor in your growth trajectory. Will you have 5 clients or 50 clients in 12 months? Different pricing models scale differently.
Per-client pricing becomes expensive as you scale. Per-user pricing becomes expensive as teams grow. Per-data-source models are predictable if your service packages are consistent.
Think about where you’re headed instead of just where you are today. Are you planning to double your client roster this year?
7. Verify the must-haves absolutely work. White-labeling, PDF export, specific integrations, data refresh rates—whatever you consider non-negotiable, test it during the trial.
Don’t assume features work because the marketing page claims them. Test everything that matters to your workflow.
Make a checklist. Check off each requirement as you verify it works. What’s your dealbreaker feature?
8. Read reviews before you commit. Spend 30 minutes on each tool you’re seriously considering:
- Check G2 and filter reviews by most recent (last 3-6 months)
- Look at Capterra and sort by date
- Read Trustpilot for additional perspective
- Pay attention to reviews from agencies similar to yours in size and focus
Don’t just read the ratings—read what people actually say. Look for patterns in complaints. One person having an issue might be an outlier. Ten people reporting the same problem is a pattern worth noting.
The Truth About Making the Switch
Making the switch to a new reporting tool requires effort, and there’s no way around that. But I’ve also watched agencies waste months tolerating problems that cost them time, money, and sometimes clients.
The agencies that successfully switch follow a simple pattern: they pick one new client or one small internal dashboard as the test case, build it completely in the new tool, and compare it honestly against their current process.
If the new tool performs genuinely better (faster, easier, better results), they migrate gradually, one or a few clients per week. If the new tool doesn’t actually improve their workflow, they cancel the trial and evaluate something else.
You’re not searching for the “best” tool in some abstract sense. You’re searching for the tool that solves your specific problems better than what you’re using now. What’s your biggest frustration with your current tool right now?
For most agencies I work with, strong options include AgencyAnalytics if you want solid integrations at accessible pricing, Swydo if predictable per-source pricing fits your service model, or Whatagraph if you value comprehensive features and AI capabilities. These three address common agency needs effectively.
But your agency might be different. Maybe you need enterprise governance (Improvado). Maybe you’re exclusively in the Google ecosystem (Looker Studio). Maybe you need maximum data flexibility (Funnel).
The framework above will guide you to the right answer for your situation. What matters most to you—price, features, or time savings?
Start with a trial, build one real client report, and see which one makes you think “this works better for us.” That’s your answer.
Databox Alternatives FAQ
Common questions about switching from Databox to better reporting tools
The best Databox alternative depends on your agency size and needs. AgencyAnalytics is ideal for small to mid-sized agencies needing strong value with unlimited users and built-in SEO tools. Whatagraph works best for agencies wanting AI-powered reporting and 30-minute data refresh rates. Swydo suits agencies with predictable data source needs who want simple per-source pricing. For enterprise needs with complex data requirements, Improvado offers the most comprehensive solution.
Agencies are leaving Databox primarily due to reliability issues, expensive white-labeling add-ons, and customer support concerns. Many users report data sync problems, metrics breaking unexpectedly, and templates stopping work without warning. The $250/month white-labeling fee adds significant cost to what should be a standard agency feature. Additionally, mixed reviews about support response times make agencies question whether they can rely on help when critical client reports need to go out.
Databox can work for agencies but has significant limitations. The platform offers solid features when everything works correctly, but reliability concerns and add-on pricing structure make it less ideal for most agencies. The $250/month white-labeling cost and per-data-source fees stack up quickly as you scale. Many agencies find better value with alternatives that include white-labeling by default, offer more predictable pricing, and provide consistently reliable integrations.
Focus on seven key criteria: integration quality over quantity (reliable connections to platforms you actually use), included white-labeling without extra fees, unlimited users to avoid collaboration penalties, data refresh frequency matching client expectations, responsive customer support you can rely on during emergencies, total cost including time savings, and a pricing model that scales favorably as you grow. Test with real client data during trials to verify the tool actually fits your workflow.
Start by choosing 1-3 pilot clients, then run parallel reporting for 2-4 weeks with both tools. Build complete reports in your new tool while continuing Databox delivery. Compare data accuracy between both platforms. Once verified, switch your pilot clients fully and gather feedback. Gradually migrate 3-5 clients per week rather than moving everyone at once. This staged approach lets you catch problems early before they affect all clients. Most agencies complete migration in 2-4 weeks total.
AgencyAnalytics offers better value for most agencies with unlimited users, unlimited clients, and unlimited dashboards on all plans—no per-user penalties as you grow. White-labeling comes included versus Databox’s $250/month add-on. AgencyAnalytics also includes built-in SEO tools like rank tracking, site audits, and backlink monitoring, eliminating separate tool subscriptions. Pricing starts around $79/month for freelancers versus Databox’s $159/month, making AgencyAnalytics more cost-effective for small to mid-sized agencies managing mainstream platforms.
Whatagraph is purpose-built for agencies with included white-labeling, unlimited users, and AI-powered report generation through Whatagraph IQ. It offers 30-minute data refresh versus Databox’s longer intervals, and 55+ fully-managed integrations maintained by dedicated engineers. Whatagraph starts at $229/month but includes everything agencies need without add-ons. Choose Whatagraph if you value AI automation, faster data updates, and want to avoid Databox’s escalating add-on costs. The higher base price often costs less than Databox once you add white-labeling and extra data sources.
DashThis excels for small agencies (1-5 people, under 20 clients) needing speed and simplicity. You can create professional dashboards in minutes rather than hours with pre-built templates and straightforward drag-and-drop interface. It includes unlimited users on all plans. DashThis starts at $49 for 3 dashboards versus Databox’s $159 minimum. However, per-dashboard pricing becomes less favorable above 25 clients. Choose DashThis if you need something working immediately without extensive training, but plan to evaluate other options as you scale past 20-30 clients.
Looker Studio is completely free with unlimited dashboards and users, but only for Google ecosystem platforms. You get native connections to Google Ads, GA4, Search Console, and Google Sheets without cost. However, connecting non-Google platforms (Facebook, LinkedIn, TikTok) requires paid third-party connectors like Supermetrics, eliminating the cost advantage. Looker Studio also has limited PDF export (only captures visible screen content) and no direct vendor support—just community forums. Choose Looker Studio only if 100% of your client reporting uses Google platforms exclusively.
Swydo uses per-data-source pricing ($69/month for 10 sources) with unlimited users, unlimited clients, and unlimited reports. This differs from Databox’s base pricing plus add-ons approach. Swydo’s template system lets you create one report and assign it to multiple clients—when you update the template, all client reports update automatically. However, Swydo offers only 30+ integrations versus Databox’s broader list. Choose Swydo if your clients use consistent platform packages and you want predictable scaling costs based on data sources rather than clients or users.
Databox starts at $159/month for the Professional plan with 3 data sources included. Additional data sources cost $5.60 each. White-labeling requires a separate $250/month add-on package. The Growth plan costs $399/month and Premium is $799/month. Real costs escalate quickly once you add white-labeling and extra data sources—a typical agency setup often runs $400-650/month. Alternatives like AgencyAnalytics ($79-239/month) and Swydo ($69/month) include white-labeling by default, making them more cost-effective despite potentially lower base prices.
Databox treats white-labeling as a premium feature, charging $250/month on top of base subscription costs. This pricing philosophy differs from modern agency-focused tools that include white-labeling as standard. For agencies, white-labeling isn’t optional—clients expect reports without third-party branding. Most Databox alternatives (AgencyAnalytics, Whatagraph, Swydo, DashThis) include full white-label capabilities in base pricing, recognizing this as an essential agency requirement rather than a premium add-on.
Looker Studio is completely free for Google ecosystem reporting with unlimited dashboards and users. DashThis offers the lowest paid entry at $49/month for 3 dashboards with unlimited users. Funnel provides a free tier with 4 data sources and unlimited users. Swydo starts around $69/month. However, “cheapest” isn’t always best—calculate total cost including your time. A tool costing $200/month but saving 10 hours weekly is cheaper than a $50/month tool requiring extensive manual work.
Pricing models vary significantly. Per-user pricing (rare in modern tools) penalizes team growth. Per-client pricing works for standard service packages but gets expensive at scale. Per-data-source pricing (like Swydo) is predictable when clients use consistent platforms. Campaign-based pricing (like AgencyAnalytics) scales with services delivered. Many modern tools offer unlimited users and clients with pricing based on data sources or features instead. Choose based on your growth pattern—if adding team members, avoid per-user models. If client count is growing fast, evaluate how costs scale at 2x your current size.
Yes, Looker Studio (Google Data Studio) is completely free with unlimited dashboards, unlimited users, and native Google platform integrations. However, it only connects free to Google Ads, GA4, Search Console, and Google Sheets. Non-Google platforms require paid third-party connectors like Supermetrics ($20-100+/month), eliminating the free advantage. Funnel offers a limited free tier with 4 data sources. While free options exist, most agencies quickly need multi-platform reporting, white-labeled PDFs, and vendor support—features requiring paid tools. Free tools work for Google-only agencies or very early-stage businesses.
Most reporting tools automatically pull historical data when you connect integrations—typically 12-24 months depending on the platform. Your data lives in the original sources (Google Ads, Facebook, GA4), not in Databox itself. When you connect these sources to a new tool, charts and trends repopulate automatically. However, custom calculations, annotations, and notes you created inside Databox won’t transfer. Document your important custom metrics and formulas before switching so you can recreate them. Export key historical reports as PDFs for reference during transition.
List every platform you currently manage for clients: Google Ads, Facebook/Meta Ads, LinkedIn Ads, GA4, Search Console, Instagram, TikTok, email platforms, CRM systems. Most agencies use 6-12 core platforms consistently. A tool with 500 integrations doesn’t help if the 6 you need keep breaking. Prioritize fully-managed integrations maintained by the vendor versus third-party connectors that break when APIs change. Verify during trials that your critical platforms connect reliably and pull accurate data. Integration quality beats quantity every time.
Daily updates are minimum acceptable; hourly or near-real-time is increasingly expected. When clients check dashboards at 2pm, they want current data, not yesterday’s numbers. Tools like Whatagraph offer 30-minute refresh rates for most platforms. However, refresh needs vary by report type—monthly PDF summaries don’t need real-time data, but live dashboards benefit significantly from frequent updates. Match refresh frequency to how your clients actually use reports. If they access dashboards multiple times daily, prioritize faster refresh rates. If they only review monthly summaries, daily updates suffice.
When you cancel Databox, you lose access to all dashboards, scheduled reports stop sending, and historical data inside the platform becomes inaccessible. Your actual data remains in original platforms (Google Ads, Facebook, etc.), but any custom calculations, annotations, or configurations you built in Databox disappear. This is why running parallel reporting during migration is critical—it ensures continuous client reporting while you transition. Export important historical reports as PDFs before canceling, and document all custom metrics and formulas so you can recreate them in your new tool.
It depends on the tool. DashThis and AgencyAnalytics are designed for non-technical marketing teams with drag-and-drop interfaces and pre-built templates—you can create reports without coding. Funnel and Improvado require more technical knowledge for custom data transformations and warehouse integrations. Looker Studio sits in the middle—basic reports are straightforward, but advanced customization needs technical skills. Choose based on your team’s capabilities. If your team is purely marketing-focused, prioritize tools designed for non-technical users. If you have data analysts or technical staff, more flexible tools like Funnel provide advantages.
Yes, most modern tools automate data collection, dashboard updates, and scheduled PDF delivery. Tools with AI features like Whatagraph IQ also automate report summaries and insight generation. Set up templates once, schedule delivery (weekly, monthly), and reports generate automatically. However, some manual work often remains valuable—reviewing for anomalies before client delivery, adding context about specific campaigns, or customizing commentary for important updates. Full automation is possible but many agencies prefer automated data collection with selective manual review before delivery to maintain quality and catch unexpected issues.
Connect your actual data sources and build one complete client report from start to finish. Time how long each step takes. Verify data accuracy by comparing metrics to source platforms. Test PDF export quality and formatting. Schedule automated delivery and confirm reports send correctly. Submit 2-3 support questions and time response. Try creating a second client report to see if templates truly speed up replication. Test on mobile devices if clients will access dashboards that way. Check if team members with different skill levels can use it effectively. This real-world testing reveals how the tool actually performs versus marketing claims.
Create client reports in minutes, not hours, with predictable per-source pricing.
Start Your Free Trial Today