
If you manage many Meta Ads accounts, raw data is not enough. You need real-time insights that tell a story — fast. And that starts with having your Facebook Ads data piped cleanly into Looker Studio. While Looker Studio is great for building client-ready dashboards, it doesn’t speak Meta Ads natively. You’ll need a translator — aka a third-party connector.
This guide walks you through getting Facebook Ads data into Looker Studio. You’ll learn:
- Which tools actually work
- How to automate data updates and stop wasting hours every week
- All about free and paid connectors — the good, the bad, and the tricky
- Which metrics matter most and where people often get stuck
By the end, you’ll have a pipeline that runs itself. Imagine sending out fresh reports Monday morning without lifting a finger.
What You’ll Need to Connect Facebook Ads
Here’s your pre-flight checklist before syncing Meta Ads data into Looker Studio:
- Create or log in to your Looker Studio account — it’s free with any Google login. (Check out our full Looker Studio beginners guide)
- Have at least an ad account analyst role for the Facebook Ads accounts you want to report on.
- Get a third-party data connector or integration tool — Looker Studio doesn’t offer a native Facebook Ads connector.
How to Connect to Looker Studio
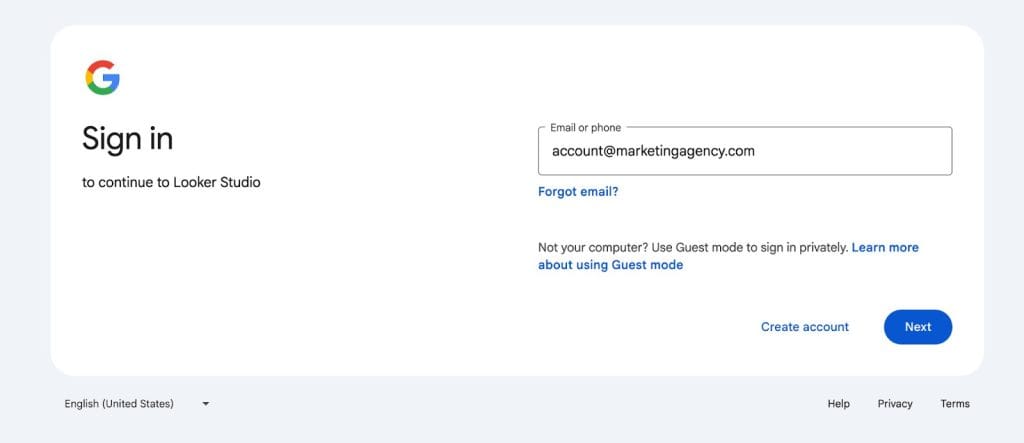
To access Google’s Looker Studio:
- Sign in to your Google account
- Visit Looker Studio and click Use It for Free
- Authenticate with Google single sign-on (SSO)
Check Your Facebook Ads Role
Make sure you have the right permissions to pull performance data:
- Log in to Facebook and open Meta Ads Manager
- Choose the correct ad account from the dropdown at the top
- If it’s not listed, click See more ad accounts
- Click the Settings gear icon to open account settings
- Re-enter your Facebook password if prompted
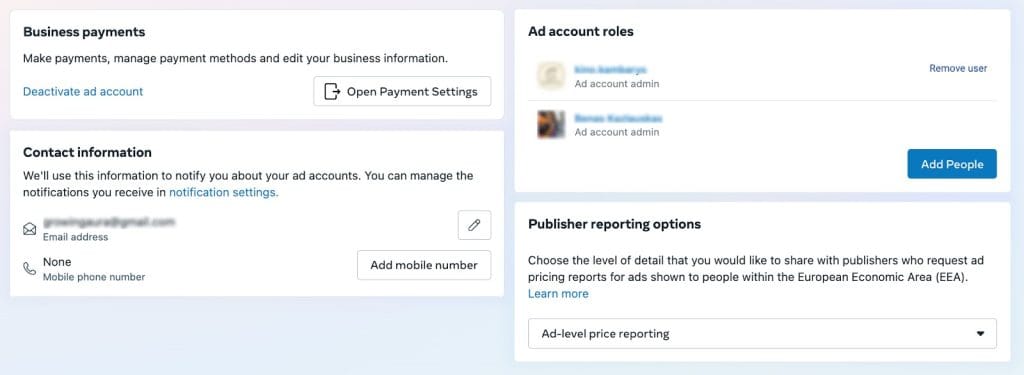
- Scroll to the ad account roles section
- Find your name in the list to view your assigned role

Viewing and managing Meta ad account roles
There are three main roles:
- Admin: Full control of the Facebook ad account. Manage campaigns, access billing and payment methods, add or remove users, and change account settings
- Advertiser: Create and manage ads, adjust budgets, and view campaign performance. Cannot access billing info, change account settings, or change permissions
- Analyst: View ad performance data and generate reports. Cannot create or edit ads, access billing, or user permissions
How to Connect a Facebook Ads Data Connector
Now it’s time to choose a third-party data connector that supports Facebook Ads reporting and sync it with your agency’s Looker Studio account
- Go to Looker Studio and click Create, then Report
- In the draft report, select Add data
- In the Add data to report window, choose your data connector option
- Check out the best Looker Studio connectors
Option 1: Google Sheets
This is the free way to get Facebook Ads data into Looker Studio. But plan to spend a few hours each week manually updating your Google Sheets with fresh data.
- Export your ad reports as CSV from Meta Ads Manager
- Open Google Sheets, import the CSV, and format the data
- In Looker Studio, go to the data connector window, search for and select Google Sheets
- Pick your spreadsheet and worksheet
- Choose fields like ad name, date, impressions, clicks, and conversions
- Click Create report to add the data to your client report
You’ll need to repeat these steps regularly to keep the report up to date.

Option 2: Third-Party Data Connector
Most third-party connectors that link Facebook Ads to Looker Studio require a paid subscription. But many offer free trials or limited free tiers. This option saves serious time by eliminating manual refreshes.
After picking the connector that fits your agency’s budget and needs:
- In Looker Studio, click Add data, then search for your connector, such as Windsor.ai or Power My Analytics
- Authorize with your Facebook and Google accounts
- Select your ad account, pick metrics and dimensions, and set how often the data refreshes
- Click Create report to link your Facebook Ads data
This method automates data syncing so you can focus on analysis, not busywork.

Available Facebook Ads Connectors
Because Looker Studio doesn’t speak Facebook out of the box, marketing agencies must use third-party connectors and integrations. Here’s a quick overview of popular options — free, paid, and manual workarounds. Start with a free solution or trial, then upgrade as your needs grow.
| Free or Trial Facebook Ads Connectors for Looker Studio | ||
|---|---|---|
| Connector Name | Key Features | Pricing |
| Google Sheets | Tweakable, manual CSV import, works with calculated fields | Free |
| Windsor.ai | 500+ metrics, 30-day trial, flexible data sync | Free plan available |
| Coupler.io | Auto refresh, templates, Google Sheets sync | Free plan available |
| TapClicks | Free connector, 14-day trial, simple setup | Free trial available |
| Dataddo | Custom refresh and field mapping, 14-day trial | Free plan available |
| Paid Facebook Ads Connectors With Advanced Features | ||
|---|---|---|
| Connector Name | Key Features | Pricing |
| Power My Analytics | Email support, onboarding, data warehouse sync | From $14.95/month |
| Dataslayer.ai | Pre-made templates, live chat support | From $34.99/month |
| Supermetrics | Custom fields, AI blending, multi-source reports | From $47/month |
The smartest way to pick a Facebook Ads connector for your agency? Test drive a few options before committing.
Before choosing your Facebook Ads connector:
- Run real tests using large data sets
- Track if any metrics are dropped or incomplete
- Compare cost per account — high volume = higher costs
- Validate how fast data refreshes
- Look for easy setup — no technical heavy lifting
- Contact support to see how responsive they are
Most connectors offer free trials, so test out 2-3 options with large-scale demo data or client accounts. See which one handles your data volume, delivers clean reports, and doesn’t require hours for the initial setup.
Facebook Ads Metrics and Dimensions for Agencies
When you build performance reports for clients, you’re not just crunching numbers. You’re delivering insights that help them make smarter business decisions. Focus on metrics and dimensions that tie directly to what clients care about — leads, sales, or brand awareness.

Core Metrics That Actually Matter
Cover the whole funnel — from getting eyes on ads to turning clicks into customers. These are the numbers that make Facebook Ads dashboards worth checking.
Awareness and engagement metrics focus on how many people saw the ads and interacted with them.
| Awareness and Engagement Metrics | ||
|---|---|---|
| Metric | What It Shows | How It Helps Your Clients |
| Impressions | How many times ads showed up on users’ screens | Good for tracking brand awareness |
| Reach | How many different people saw the ad | Avoids double-counting; shows real audience size |
| Link clicks | People who clicked through to website or landing page | Main traffic driver, indicating interest |
| Click-through rate (CTR) | Percentage of impressions that led to clicks | Reveals if creative and targeting are effective |
| Post engagement | Likes, comments, shares, other interactions | Important for clients focused on awareness and buzz |
Cost and conversion metrics show costs and how ad spend translates into results.
| Cost and Conversion Metrics | ||
|---|---|---|
| Metric | What It Shows | How It Helps Your Clients |
| CPC (cost per click) | Average cost per link click | Measures if traffic costs are reasonable |
| CPM (cost per 1,000 impressions) | Cost to show ad 1,000 times | Flags expensive placements and budget efficiency |
| Amount spent | Total spend over selected period | Basic budget tracking |
| Results | Actual conversions like sales, leads, sign-ups | Connects ads to measurable business outcomes |
| Cost per result | Average cost for each conversion | Indicates campaign ROI |
| Conversion value | Total revenue or value of tracked conversions | Measures real revenue or lead impact |
| ROAS (Return on ad spend) | Revenue generated per dollar spent | Key profitability metric |
| CPA (Cost per Acquisition) | Cost to get one conversion | Shows campaign efficiency in meeting business goals |
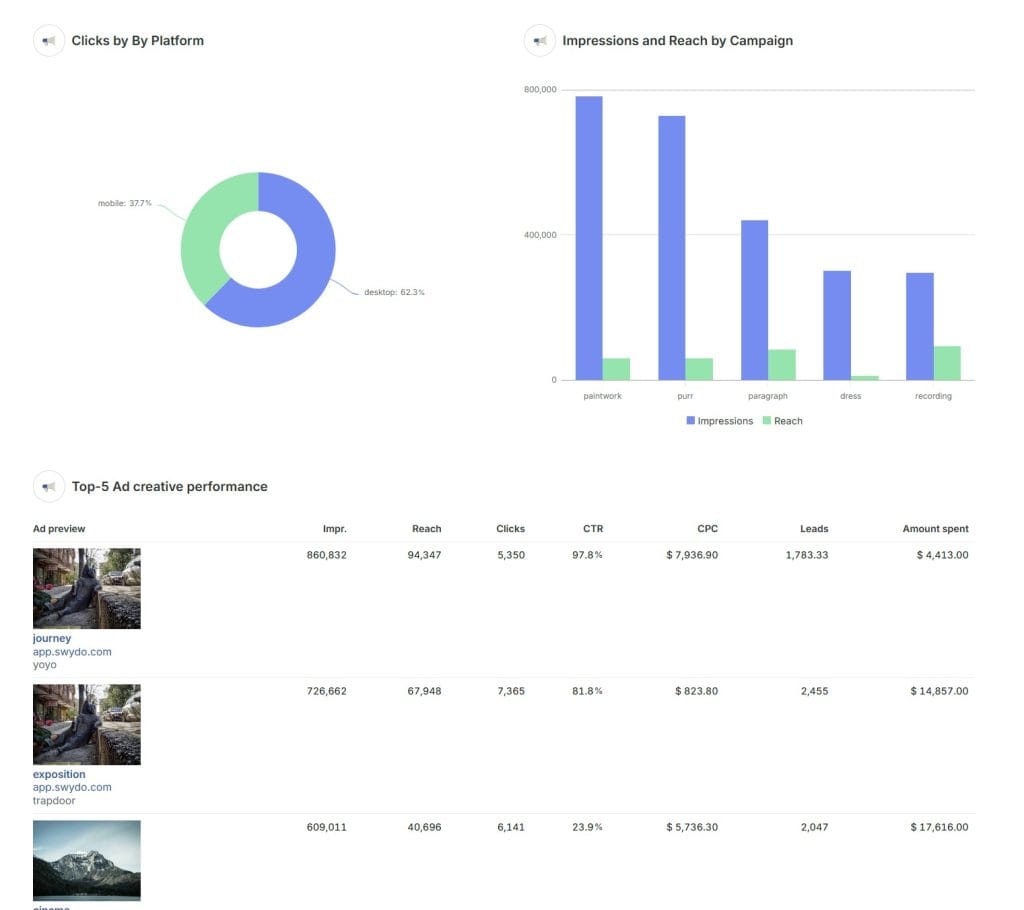
Once you’ve pulled in Facebook Ads data, the next step is turning it into something clients can easily understand. Here’s a quick guide to key KPIs and the best Looker Studio widgets to show them clearly and effectively.
| Facebook Ads KPIs and Recommended Widgets | ||
|---|---|---|
| KPI Type | Recommended Widget | Purpose |
| Impressions, Reach | Scorecards or Bar Charts | Track awareness and exposure of campaigns |
| Clicks, CTR, CPC | Time-series Chart | Analyze engagement and ad effectiveness over time |
| Conversions, CPA, ROAS | Bar Chart or Scorecard | Show direct ROI from ad efforts |
| Amount Spent, CPM | Bullet Chart | Monitor ad spend and efficiency |
| Post Engagement | Table or Bar Chart | Display user interaction metrics for engagement insights |
| Conversion Value | Scorecard or Time-series Chart | Tie ad results to revenue impact |
Keep in mind that most third-party connectors, especially free ones, don’t include calculated fields like CTR, CPA, or ROAS out of the box. If your marketing agency isn’t using calculated fields yet, this is an easy way to add advanced Facebook Ads metrics to your client reports.
You can create these directly in Looker Studio using simple formulas:
Common Facebook Ads Calculated Fields
- CTR (%): (Link clicks / Impressions) * 100
- CPA: Amount spent / Conversions
- ROAS: Conversion value / Amount spent
Key Facebook Ads Dimensions
Dimensions help you slice and dice your ad performance to figure out what’s actually working, whether it’s your creative, how audiences respond, or how key metrics change over time..
| Essential Facebook Ads Dimensions for Client Reports | ||
|---|---|---|
| Dimension | What It Shows | How It Helps |
| Campaign name | The name of your ad campaign | Easy navigation among multiple ad campaigns |
| Ad set name | A label assigned to a group of ads within a campaign | Helps analyze different ads within a specific campaign |
| Ad name | Each specific ad version you’re testing or running | Reveals which images, copy, or CTA buttons users respond to most |
| Publisher platform | Where your ad showed up – Facebook, Instagram, or Messenger | Shows which platform performs best |
| Device platform | Shows if people saw your ad on mobile or desktop | Helps spot better-performing device types and need for platform-specific visuals |
| Age range | Age of people who saw the ads | Shows which age groups are most likely to engage with or buy from the client |
| Gender | Analyzes which gender saw or responded to your ads better. | Helps you focus your targeting on who is responding |
| Country, Region | Where in the world your audience is located | Lets you see which locations perform best and adjust budgets accordingly. |
| Date, Week | When a specific activity, such as clicks or conversions, happened | Helps spot trends, seasonal patterns, and whether you’re on track with spending |
How to Automate Facebook Ads Data in Looker Studio
Manual Facebook Ads reporting eats up hours with repetitive data pulls and formatting. The good news? You can automate all of it — and you’ve got a few solid options.
Step 1: Schedule Facebook Ads Data Pulls With a Connector
To send Facebook Ads data to Looker Studio, you’ll need a third-party connector. These tools support scheduled refreshes, so your reports update automatically — hourly, daily, or on a custom schedule.

Depending on the third-party connector you choose:
- Log in to your connector and connect your Facebook Ads account
- Choose a destination, such as Google Sheets or BigQuery, to sync data with Looker Studio
- Find the Schedule or Automation option in your connector
- Set your preferred refresh frequency — hourly, every 6 hours, or daily
- For daily or weekly refreshes, choose a specific update time (e.g., 3 a.m.)
- Save your settings — your data will now update automatically
Pro tip: Schedule your Looker Studio data refresh to match when clients view their reports. If clients check dashboards on Monday mornings, set the refresh for early Monday — say, 2 a.m. That way, when you send reports to 15 clients later that day, everything’s up to date before your team wakes up.
Step 2: Enable Looker Studio’s Auto-Refresh
Once your data source is updating on schedule, follow these steps to keep your Looker Studio report in sync:
- Open your Looker Studio report
- Go to Resource → Manage added data sources
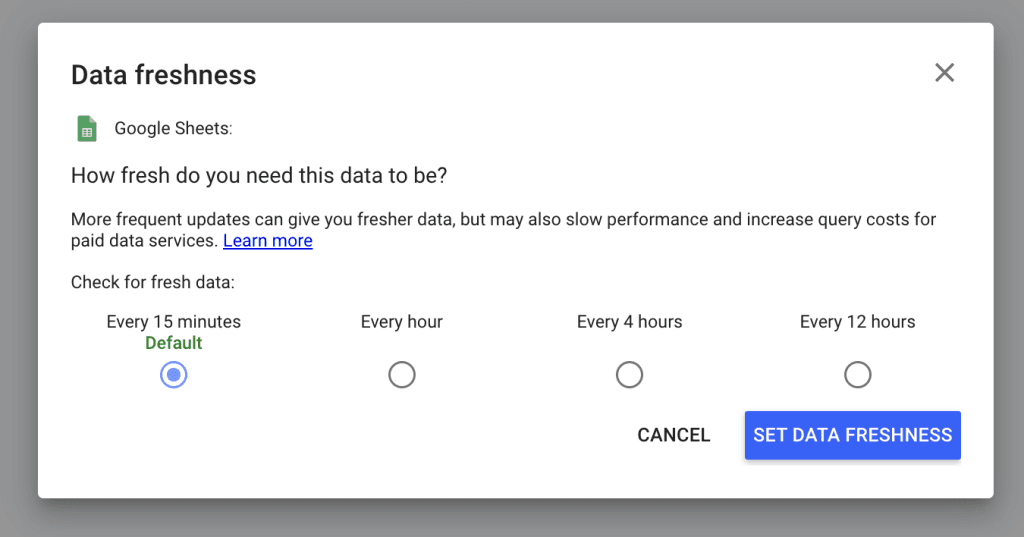
- Click EDIT next to your data source
- Select Data freshness in the top menu
- Choose the refresh interval that matches your update needs
Step 3: Automate Facebook Data Into BigQuery
For larger accounts — or to improve dashboard speed — use Google’s BigQuery to store your Facebook Ads data. Use BigQuery Data Transfer Service to schedule daily automatic imports.
Data Transfer Service supports three main reports from Facebook Ads:
Ads — Raw ad-level configuration data
AdInsights — Aggregated performance metrics
AdInsightsActions — Action-level breakdown (clicks, installs, views)
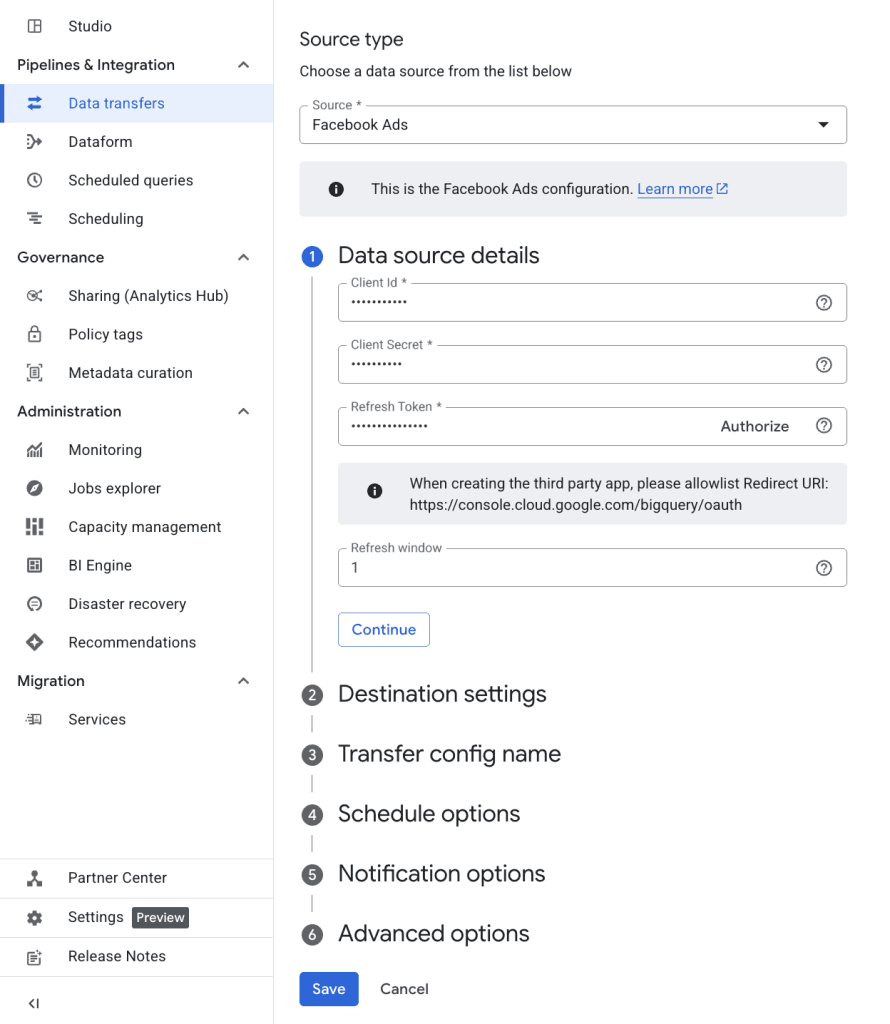
Here’s how to set up automated data transfer to BigQuery:
- Open Google Cloud Console → BigQuery → Transfers → Create Transfer
- Select Facebook Ads as source and authorize using App ID, App Secret and long‑lived access token
- Choose the report to import (e.g., AdInsights) and select only needed fields
- Set schedule to daily and pick import time
- Choose or create a BigQuery dataset to store the data
- Run the first transfer manually to confirm successful loading
Complete the final steps in Looker Studio:
- In Looker Studio create new data source linked to your BigQuery table
- Enable auto-refresh so reports always show latest data
- Set a recurring reminder every 60 days — or automate secure token refresh — to avoid data disruptions
Best Practices and Common Challenges
With your automated Facebook Ads integration running smoothly, you’ll want to prepare for ongoing maintenance and potential issues that could pop up down the road.
Token Expiry and Reauthentication
Facebook access tokens expire every 60 days. When they do, your connector stops pulling the most recent data. Make sure to:
- Set a recurring reminder to refresh Facebook access token every two months
- Watch for connector warnings — look for “No data” errors or email alerts
- Update the token in your Facebook Ads data source promptly
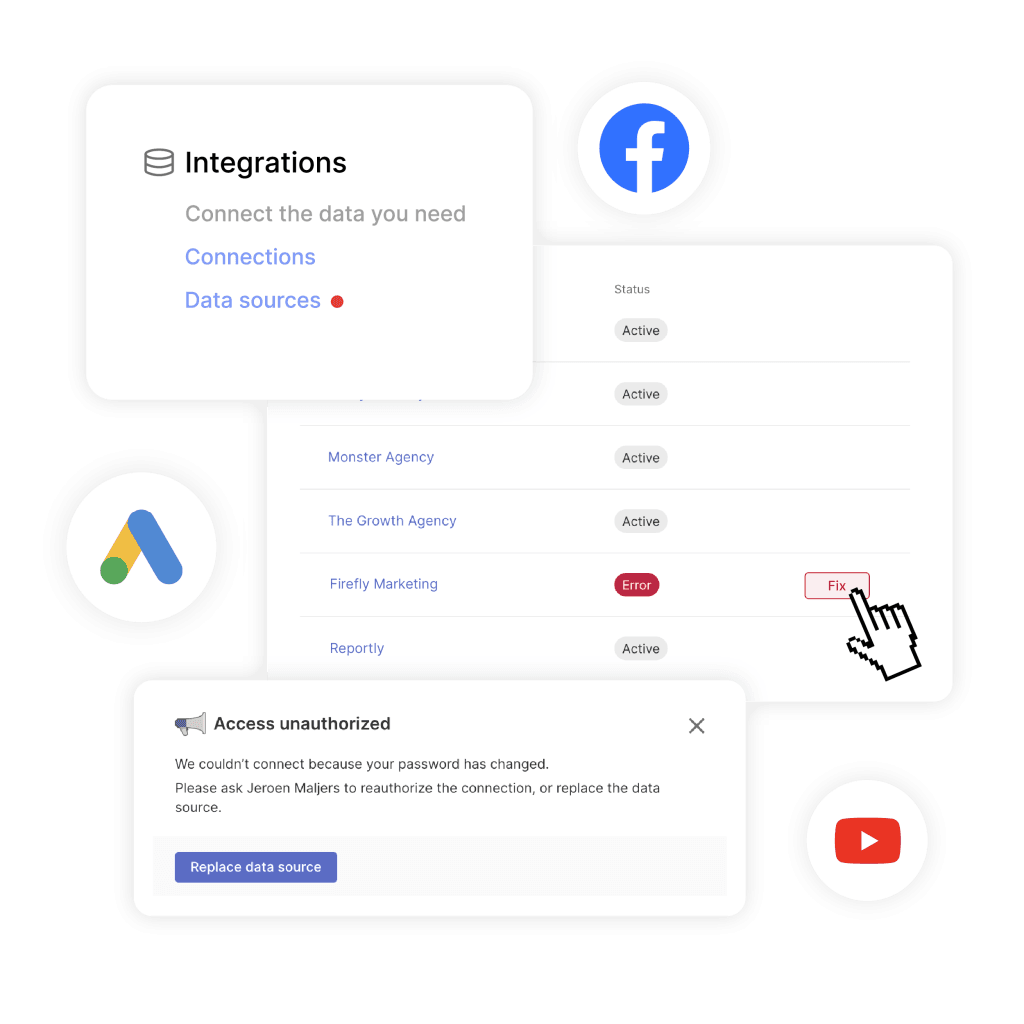
Permissions and Account Access Errors
Permission issues cause most automated Facebook Ads reporting failures. When data stops flowing:
- Confirm the user connecting the data source has correct permissions in Meta Business Manager
- Verify Instagram accounts are linked to Facebook Pages if Instagram metrics are included
- Make sure ad accounts are active and not flagged or restricted by Meta
Data Freshness vs. Caching
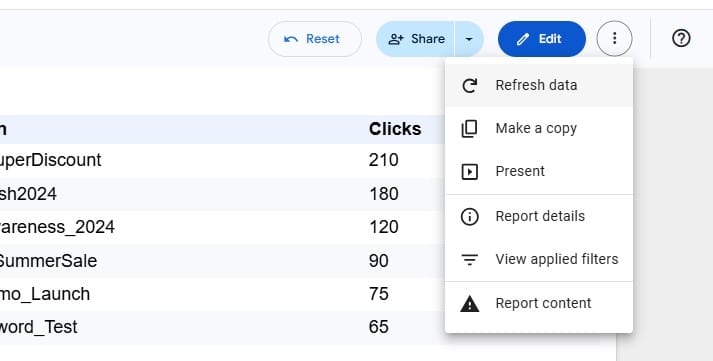
Even if your data source updates daily, Looker Studio may still show cached results.
Verify your data is current and refresh it in Looker Studio:
- Look for the last refresh date/ time at bottom left side of screen
- Hover over charts to view last updated timestamp (Pro version)
- Adjust refresh rate in connector settings when data appears stale
- Click Refresh data to update visuals instantly when needed
Data Types and Field Formatting
If metrics like ROAS or CPA aren’t showing the actual numbers, the issue might be incorrect field types.
In Looker Studio:
- Navigate to Resource → Manage added data sources → Edit your Facebook Ads source
- Ensure fields like Spend or Impressions are formatted as Number, not Text
- Set CTR and similar metrics to Decimal or Percent format
- Save and refresh your report to apply changes
Other Ways to Report Facebook Ads Performance
Facebook Ads reporting gets messy fast. Looker Studio is powerful, but it takes manual setup, custom metrics, and regular upkeep. If that’s slowing you down, here are a few alternatives that might suit your workflow better.
Use Platforms Made for Agencies
Reporting platforms like Swydo offer a powerful way to connect directly to Facebook Ads — along with Google Ads, LinkedIn Ads, TikTok Ads, and 30+ other integrations — without the hassle of external connectors. Swydo’s intuitive interface helps you streamline reporting so you can focus on insights and strategy, not manual data work.
With Swydo, you can:
- Build client-ready templates quickly
- Set up automated delivery schedules to keep reports flowing on time
- Add personalized insights and comments to give reports context
- Save time with a drag-and-drop report builder that’s easy to use
- Track key metrics like return on ad spend (ROAS), click-through rate (CTR), and cost per acquisition (CPA)
- Cut down on manual work and reduce errors with pre-made templates and automation
This combo of ease and powerful features makes Swydo a smart choice for agencies looking to improve efficiency without sacrificing quality.
Read our Looker Studio vs Swydo comparison for more information.
Go Old School With Spreadsheets
Manual reporting using Google Sheets or Excel still makes sense for small agencies with just a few clients or a need for highly customized reports that automated tools can’t handle.
To get the most from spreadsheets:
- Export your Facebook Ads data directly from Ads Manager, then organize it into clean tables.
- Break down performance by campaign type, audience, or time period.
- Create charts and graphs tailored to highlight the metrics that matter most for each client — whether that’s cost per acquisition, return on ad spend, or reach.
It takes more time and doesn’t run itself, but you control every detail. Want to compare this month’s performance to the same period last year? Easy. Need to combine Facebook data with offline sales numbers? No problem. You format everything exactly the way your clients want to see it.
Make Facebook Ads Reporting Work for You — Not the Other Way Around
Facebook Ads reporting doesn’t have to eat up your whole week. You’ve got options — whether it’s the flexibility of Looker Studio, a specialized platform like Swydo, or good old spreadsheets. The secret is choosing what actually works for your team and clients.
Here’s the truth: manual reporting kills productivity and leaves plenty of room for mistakes. Automated tools save you hours every week. They let you focus on strategy instead of endless data entry. Plus, they help you scale your work without hiring more people.
Whether you lean on Looker Studio’s powerful customization, a plug-and-play platform, or your own trusted spreadsheet system, your choice depends on your agency’s size, tech skills, and client needs.
Pick your approach, set it up once, then get back to what you do best — growing your clients’ businesses.
If you haven’t tried Swydo yet, you can test it free for 14 days — no risk. It might just change your mind about how simple client reporting can be.
Facebook Ads to Looker Studio FAQ
Direct answers to the most searched questions about Facebook Ads reporting
No. Looker Studio doesn’t have a native Facebook Ads connector. You need a third-party connector or manual CSV imports through Google Sheets.
Free to $47+ per month. Manual Google Sheets method is free but time-consuming. Third-party connectors range from free trials to $47+/month for professional features. Most agencies start with free trials before upgrading.
Analyst role minimum. This allows viewing ad performance data and generating reports. Check your role in Meta Ads Manager > Settings > Ad account roles section.
2-4 hours with a connector, 30+ minutes weekly with manual method. Third-party connectors require initial setup but automate ongoing updates. Manual CSV exports are quick to start but need constant maintenance.
Only with manual work. The Google Sheets method is free but requires weekly CSV exports and data formatting. All automated solutions use paid third-party connectors, though many offer free trials.
Depends on your needs. Windsor.ai and Coupler.io offer good free plans for testing. Supermetrics and Power My Analytics provide advanced features for agencies. Test 2-3 options during free trials to find the best fit.
Google Sheets method only. All automated connectors require payment for full features. However, Windsor.ai, Coupler.io, and TapClicks offer free tiers with limited data refreshes and account connections.
Only for large datasets. Google Sheets works fine for most agencies. Use BigQuery if you have 50,000+ rows of data, need faster dashboard performance, or want advanced analytics capabilities.
Yes, with paid connectors. Most free plans limit you to 1-3 accounts. Paid connectors allow unlimited accounts and can blend data from multiple Facebook ad accounts into single reports.
Data stops updating after 60 days. Set calendar reminders to refresh tokens every 30-45 days. Most connectors will email you when tokens are about to expire, but proactive renewal prevents reporting gaps.
Focus on business impact metrics: Conversions, ROAS, CPA, CTR, and Amount Spent. Add awareness metrics (Impressions, Reach) for brand campaigns. Avoid vanity metrics that don’t connect to business goals.
Create calculated fields in Looker Studio. Go to Resource > Manage added data sources > Edit > Add Field. Use formulas: ROAS = Conversion Value ÷ Amount Spent, CPA = Amount Spent ÷ Conversions.
Different attribution windows or field formatting. Ensure you’re comparing the same date ranges and attribution settings (1-day click vs 7-day view). Check that currency fields are formatted as “Number” in Looker Studio.
Daily for most agencies. Schedule updates for early morning (2-3 AM) so data is fresh when viewed. Hourly updates are only needed for active campaign optimization or high-spend periods.
Yes, automatically included. Instagram ads managed through Meta Ads Manager appear in the same data feed. Use the “Publisher Platform” dimension to separate Facebook and Instagram performance in your reports.
Campaign Name, Ad Set Name, Date, and Device Platform are essential. Add Age Range, Gender, and Country for audience insights. Publisher Platform shows Facebook vs Instagram performance.
Check three things: Expired access tokens, incorrect account permissions, or connector errors. Look for the “last updated” timestamp in your report and verify your Facebook account access in the connector settings.
Re-authorize your Facebook account. Go to your connector dashboard, disconnect and reconnect your Facebook account. Ensure you have proper permissions and that your Facebook Business Manager access hasn’t changed.
Data caching or connector schedule issues. Click the refresh icon in Looker Studio, check your connector’s update schedule, and verify the “Data freshness” settings in Resource > Manage added data sources.
Yes, with scheduled email delivery. In your Looker Studio report, click Share > Schedule email delivery. Set recipients, frequency (daily/weekly/monthly), and delivery time for automated PDF reports.
Have a backup plan ready. Keep CSV export templates prepared for emergency manual reporting. Set up monitoring alerts, maintain connector health dashboards, and establish relationships with multiple connector providers.
Optimize data frequency and account limits. Use daily instead of hourly refreshes, connect only active ad accounts, limit historical data imports, and choose connectors with flat-rate pricing instead of per-account fees for agencies with many clients.
Skip the connector headaches and automate your Facebook Ads reporting today.
Start Your Free Trial Today