
Marketing agencies know the struggle of creating personalized reports for each client. Different businesses need different metrics. Looker Studio’s filters are a game-changer here. They let you tailor each report to show only the relevant data your specific clients care about. No more generic reports that miss the mark.
And if you’re still using that pre-made template from Looker’s report gallery, cluttered with all the irrelevant data points, the filters will soon change how you report the performance.
What to Know About Filters in Looker Studio?
Filters in Looker Studio serve as mechanisms to control the data displayed in your reports. They help you to include or exclude specific data points based on defined criteria, ensuring that your visualizations are both relevant and insightful.
Types of Filters
Editor Filters vs. Viewer Controls
When working with Looker Studio, it’s crucial to understand the two main types of filters based on who uses them:
Editor Filters are set up by report creators (that’s you) and are embedded into the report structure. Your clients can’t modify these. Editor filters are perfect for:
- Setting baseline data parameters that shouldn’t change
- Filtering out irrelevant or sensitive client information
- Creating views that should stay consistent no matter who’s looking
Viewer Controls are the interactive elements that your clients can use to filter data on their own. These give your clients the power to:
- Look at data from angles that matter to them
- Focus on aspects relevant to their specific goals
- Customize their view without affecting other users’ experience
- Test “what if” scenarios with their data
Knowing which to use ensures you’re giving clients just the right amount of flexibility while maintaining control over your reports.
Include vs. Exclude Filters
Another key filter concept you need to master is the difference between include and exclude logic:
Include Filters (also called “show only” filters) display only data that matches your criteria. Use these when you know exactly what your client wants to see, like:
- Only showing traffic from specific campaigns
- Displaying data for a particular product category
- Focusing on users from certain geographic locations
Exclude Filters remove data that matches your criteria while keeping everything else. These are great when you want to clean up reports by eliminating:
- Internal traffic from website analytics
- Test transactions from revenue reports
- Irrelevant search queries that skew the data
Both approaches can achieve similar results, but picking the right one depends on which is more efficient for your client’s data.
What’s a Filter in Looker Studio
Filters in Looker Studio serve as mechanisms to control the data displayed in your reports. They help you to include or exclude specific data points based on defined criteria, ensuring that your visualizations are both relevant and insightful. There are a few types of filters available that most marketing agencies using Looker Studio apply.
Chart-level Filters
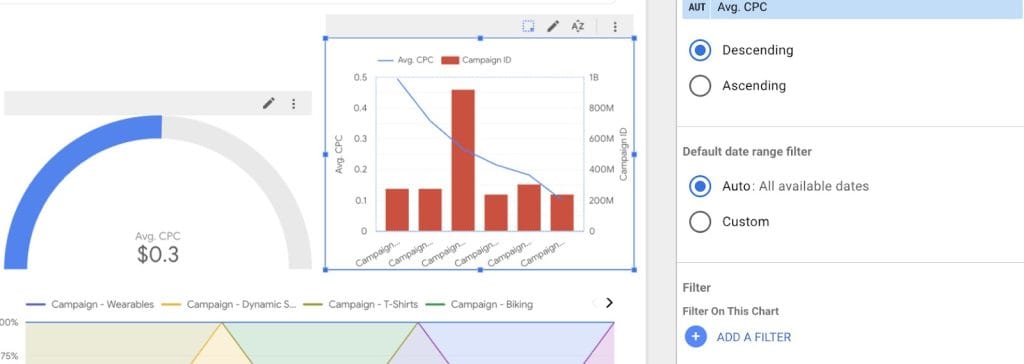
Chart-level filters are applied to individual charts, helping users to add or remove data points from a specific widget (or a chart). For marketing agencies, this means you can highlight specific metrics, like a single campaign’s performance within a broader dashboard.
Page-level Filters
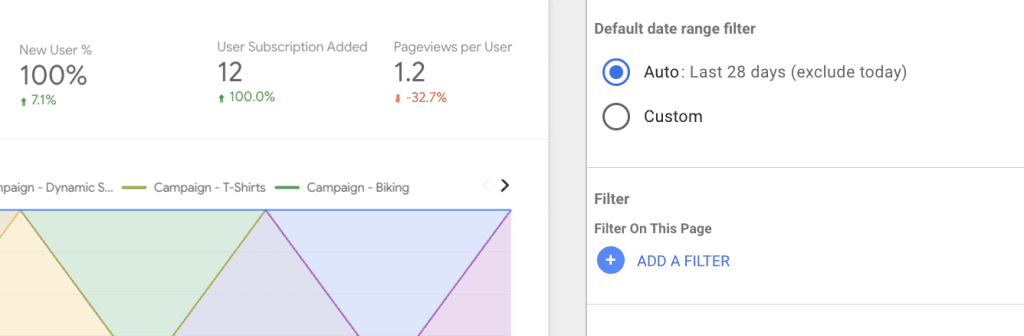
Page-level filters affect all charts on a specific page, making them ideal for segmenting data by categories like region or device type. Agencies can use these filters to create separate pages for different channels or countries, ensuring that all visualizations on a page match the selected category.
Report-level Filters
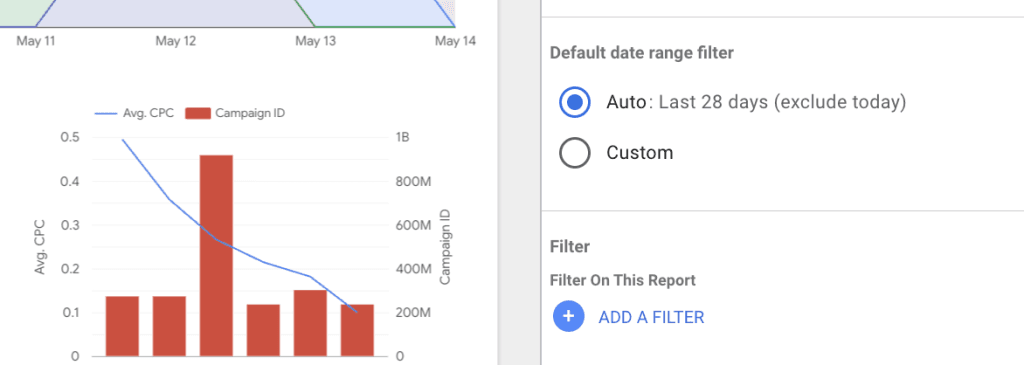
Report-level filters impact every chart across the entire report, filtering or hiding specific data points. Agencies often apply these filters to exclude internal traffic or focus on a specific date range across all pages, guaranteeing the most accurate performance reporting.
Group Filters
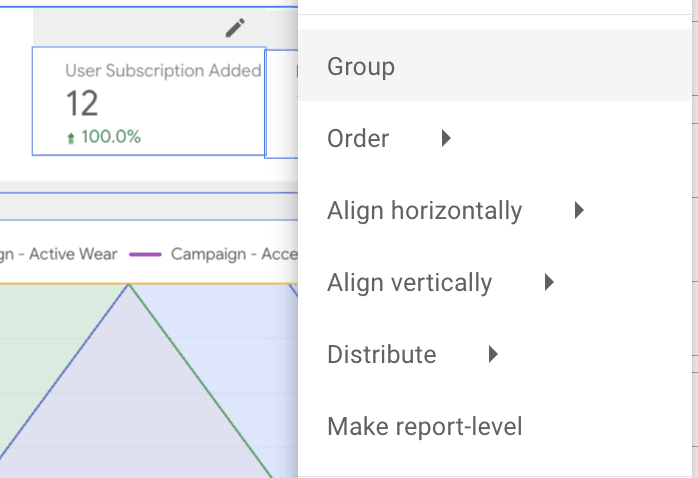
Group filters are applied to a set of selected charts, creating filtering across multiple visualizations. When presenting multiple charts that analyze different aspects of a single campaign, agencies can use group filters to allow clients to adjust parameters like date range or geographic location across all related charts.
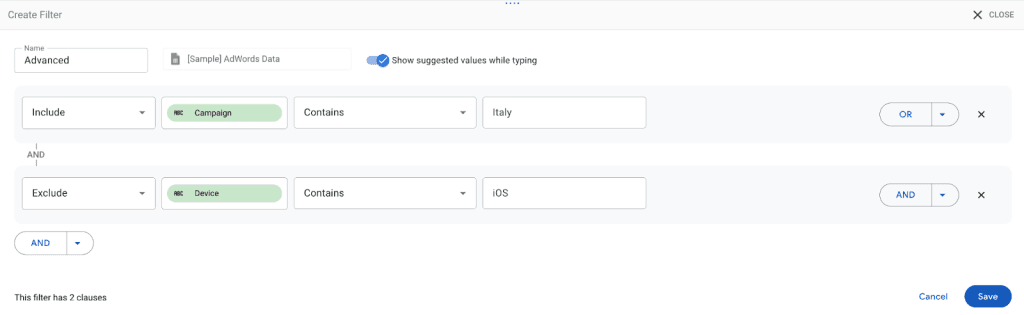
Advanced Filter
Advanced filters offer more complex filtering options, including regular expressions and conditional logic. Agencies can segment search queries by intent (e.g., informational, transactional) to analyze user behavior and tweak their performance marketing strategies accordingly.
Preset Filter
Preset filters are buttons that apply predefined filters when clicked, streamlining the user experience. Marketers working with performance reporting can create buttons for common views, like “top converting campaigns”, helping clients quickly access key insights without manual filtering.
Cross-Filtering
Cross-filtering in Looker Studio helps users to interact with one chart and apply that interaction as a filter to other charts in the report. For example, clicking on a specific campaign in a chart can filter related charts to display detailed metrics for that campaign.
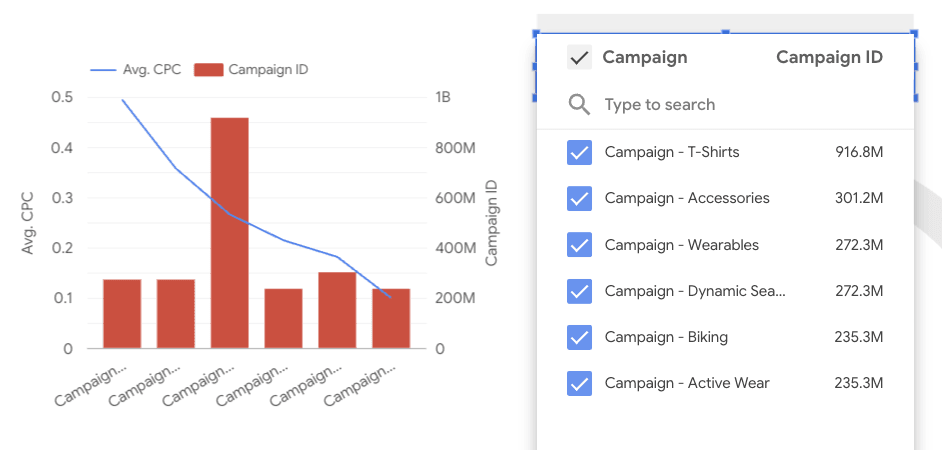
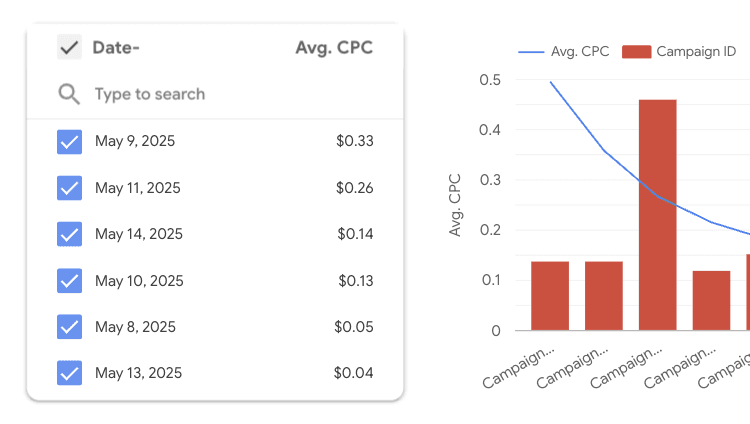
Drop-down List Filter
A drop-down list filter is a compact menu from which Looker users can select one or multiple values. It’s great for dimensions with numerous values, such as campaign names or countries. Marketers can choose specific campaigns to view performance metrics, focusing on areas of interest without being overwhelmed by a range of irrelevant data points from other performance channels.
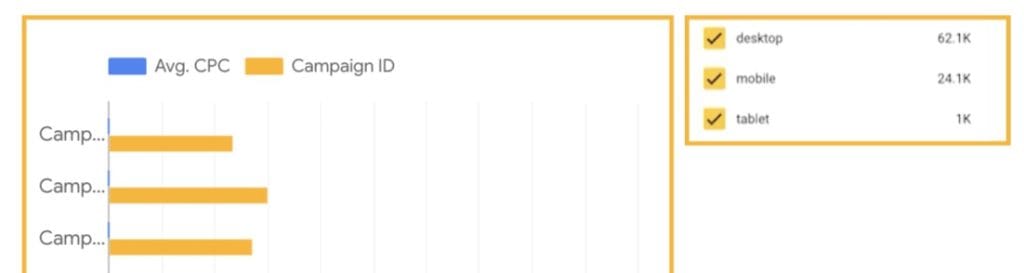
Fixed-size List Filter
This filter displays a static list of values, suitable for dimensions with a limited number of options. Agencies can use fixed-size lists for binary dimensions like device type (mobile or desktop) to let clients quickly toggle between views.
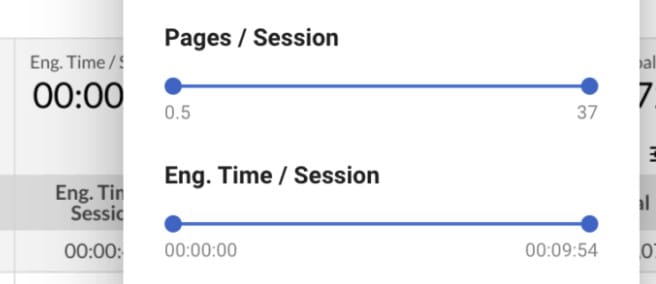
Slider Filter
Sliders help users to filter data within a numerical range, such as dates or revenue figures. Marketers can adjust the revenue range to focus on high-performing products or services within a specific financial bracket and build campaigns with higher ROI.
Checkbox Filter
Checkbox filters are handy for binary dimensions, enabling users to toggle between two states. When building reports for clients, agencies can include or exclude branded traffic in their reports to evaluate the impact of brand recognition on performance.
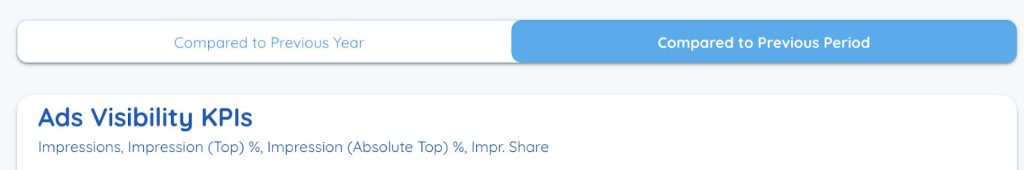
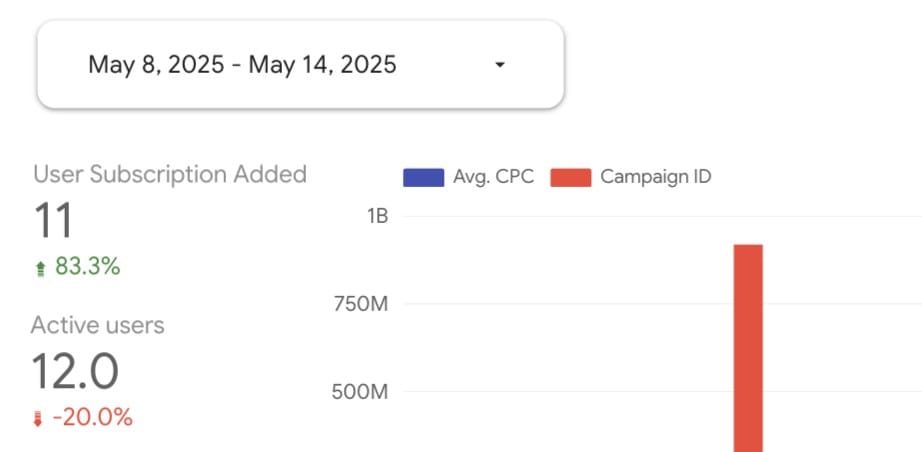
Date Range Control Filters
This filter lets users select the period for the data displayed, offering flexibility in year-over-year or month-over-month analysis. Marketers can compare performance across different time frames and identify potential traffic or revenue spikes during high-demand seasons.
Input Box Filter
An input box allows users to type in specific values to filter data. It’s useful when the exact value is known and quick access is needed. Agencies can help clients search for particular landing pages or product names to assess individual performance metrics.
How to Set Up Filters in Looker Studio
Great for analyzing the metrics that are important for the marketer or a client, filters in Looker Studio let you cut through the thousands of data rows without an endless scroll. Here’s how to set up all of the filters mentioned above.
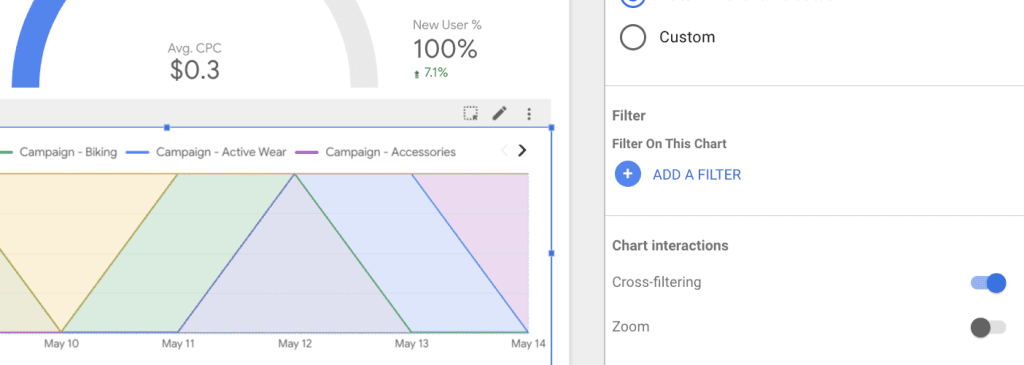
To Apply a Chart-level Filter
- Select the chart you want to filter.
- In the Properties panel on the right, click the SETUP tab.
- Scroll down to the Filter section.
- Click ADD A FILTER.
- Choose an existing filter or click Create a Filter to define new conditions.
- Configure the filter conditions, for example, Include – Campaign – Equals – Campaign Test.
- Click Save, and the filter will then be applied to the selected chart.
To Apply a Page-level Filter
- Navigate to the selected page in your Looker Studio report.
- From the top menu, select Page, then Current page settings.
- In the Properties panel on the right, click the SETUP tab.
- Scroll down to the Filter section.
- Click ADD A FILTER.
- Choose an existing filter or click Create a Filter to set up a new one.
- Configure the filter conditions as needed.
- Click Save. The filter will then be applied to the whole page.
To Apply a Report-level Filter
- From the top menu, select File, then Report settings.
- In the Properties panel on the right, click the SETUP tab.
- Scroll down to the Filter section.
- Click ADD A FILTER.
- Pick an existing filter or define a new one by selecting Create a Filter.
- Configure the filter conditions as needed.
- Click Save, and the changes will be applied to the whole report.
To Apply a Group Filter
- Hold down the Shift key and select the widgets you want to group.
- Right-click on one of the selected charts and choose Group.
- With the group selected, go to the Properties panel on the right.
- Click the SETUP tab.
- Scroll down to the Filter section.
- Click ADD A FILTER.
- Choose an existing filter or click Create a Filter to define new conditions.
- Configure the filter conditions as needed.
- Click Save to apply the filter for the selected group of charts and widgets.
To Apply Advanced Filters
- Select the chart, page, or report where you want to apply the filter.
- In the Properties panel on the right, click the SETUP tab.
- Scroll down to the Filter section.
- Click ADD A FILTER.
- Click Create a Filter.
- Configure the filter conditions using advanced options.
- Click Save to apply the filter.
To Apply a Preset (Button-based) Filter
- In the top menu, select Insert and then Button.
- Select where you want to place a button.
- In the right-side Properties tab, select the SETUP tab.
- Under Button Action Type, select Filter.
- Under the Control field, click Add field.
- Create a custom field that defines your filter condition. For example, CONTAINS_TEXT(Country, “US”). The filter only shows the data that includes the US tag.
- Once you create the custom field, the button will automatically apply this filter.
- Configure whether the filter is applied when the button is toggled on or off.
- Optionally, you can also group multiple buttons for an easier switch between different filters.
To Apply Cross-filtering
- First, check whether all charts you want to include in cross-filtering come from the same data connector and have the same fields.
- Pick a chart you want to enable cross-filtering.
- In the right-side Properties panel, select the SETUP tab.
- Scroll down to the Chart Interactions section.
- Toggle the Cross-filtering option to On.
What are Filter Controls
Filter controls allow report viewers to interact with the data dynamically. These controls can be added to your agency’s report, helping users filter data based on their preferences.
Drop-down List Filter
A drop-down list filter is a compact menu from which Looker users can select one or multiple values. It’s great for dimensions with numerous values, such as campaign names or countries. Marketers can choose specific campaigns to view performance metrics, focusing on areas of interest without being overwhelmed by a range of irrelevant data points from other performance channels.
- Drop-down list allows users to select from a list of available values.
- Fixed-size list displays all filter options simultaneously.
- Input box helps with the manual entry of filter criteria.
- Slider simplifies the adjustment of numeric ranges dynamically.
- Checkbox filter allows you to select or remove any of the set data points from the report.
- Date range control allows you to set a custom data parameter for a specific widget or a report.
To Apply a Drop-down Filter
- From the top menu, select Insert, and then Drop-down list.
- Click on the report canvas to place the control.
- In the Properties panel on the right, click the SETUP tab.
- Under the Control field, pick the dimension you want to filter by, for example, Campaign Name.
- Customize the control’s appearance and settings as needed.
Fixed-size List Filter
This filter displays a static list of values, suitable for dimensions with a limited number of options. Agencies can use fixed-size lists for binary dimensions like device type (mobile or desktop) to let clients quickly toggle between views.
- From the top menu, select Insert and click Fixed-size list.
- Click on the report canvas to place the control.
- In the Properties panel on the right, click the SETUP tab.
- In the Control field tab, choose the dimension you want to filter, like Device Type.
- Tweak the list to your reporting needs.
Input Box Filter
An input box allows users to type in specific values to filter data. It’s useful when the exact value is known and quick access is needed. Agencies can help clients search for particular landing pages or product names to assess individual performance metrics.
- From the top menu, select Insert and choose Input box.
- Click on the report canvas to place the filter.
- In the Properties panel on the right, click the SETUP tab.
- Under the Control field, select the dimension you want to filter by, for example, Landing Pages.
Slider Filter
Sliders help users to filter data within a numerical range, such as dates or revenue figures. Marketers can adjust the revenue range to focus on high-performing products or services within a specific financial bracket and build campaigns with higher ROI.
- In the top menu, select Insert and choose Slider.
- Select the report canvas to place the filter.
- In the Properties panel on the right, click the SETUP tab.
- In the Control field tab, select the numeric dimension you want to filter, like Revenue.
Checkbox Filter
Checkbox filters are handy for binary dimensions, enabling users to toggle between two states. When building reports for clients, agencies can include or exclude branded traffic in their reports to evaluate the impact of brand recognition on performance.
- From the top menu, select Insert and then Checkbox.
- Click on the report canvas to place the control.
- In the Properties panel on the right, click the SETUP tab.
- Under the Control field, select the Boolean dimension you want to filter, like Referral Traffic.
- Tweak the filter to your reporting needs.
Checkbox filters are perfect for quick toggling between:
- Including/excluding internal traffic data
- Showing/hiding specific marketing channels
- Switching between organic and paid traffic views
- Toggling year-over-year comparison data
- Filtering by conversion status (converted vs not converted)
For reports with multiple checkbox options, maintain a clean layout by grouping related checkboxes together and using clear labels.
Date Range Control Filter
This filter lets users select the period for the data displayed, offering flexibility in year-over-year or month-over-month analysis. Marketers can compare performance across different time frames and identify potential traffic or revenue spikes during high-demand seasons.
- From the top menu, select Insert, then click on Date range control.
- Click on the report canvas to place the control.
- In the Properties panel on the right, click the SETUP tab.
- In the Control field, choose the date dimension.
Advanced Filtering Techniques
When in search of more advanced data manipulation options, Looker Studio has some handy features under its sleeve.
Regular Expressions (RegEx)
Regular expressions help marketing agencies to filter data based on complex patterns, like separating campaign names that follow specific naming conventions or distinguishing between branded and non-branded search terms.
To set up RegEx:
- Enter Edit mode in your report.
- Select the chart or control you want to filter.
- In the Properties panel on the right, click the SETUP tab.
- Click ADD A FILTER, and then CREATE A FILTER.
- Then, add the information, like:
- Name.
- Values to include or exclude.
- Fields.
- Condition (choose Matches (RegExp).
- Value (enter your regular expression pattern, like ^/products/.* to match specific URLs).
- Click Save to apply the regular expression filter.
Useful RegEx patterns for marketing reports:
- ^brand|brand$ – Find terms starting or ending with “brand”
- utm_source=email – Filter email campaign traffic
- ^((?!internal).)*$ – Exclude anything with “internal”
- \.pdf$|\.doc$ – Find PDF or DOC downloads
Multiple Conditions
These filters help agencies to combine several filter criteria, simplifying the creation of nuanced reports that, for example, focus on users from a specific city who engaged with a specific campaign type.
To apply multiple condition filtering in your report:
- Enter Edit mode in your report.
- Select the chart or control you want to apply the filter to.
- In the right-side Properties tab, click the SETUP tab.
- Click ADD A FILTER, then CREATE A FILTER.
- Continue with the filter setup:
- Name.
- Data to include and exclude.
- Fields.
- Condition (choose the appropriate condition, like Equals or Contains).
- Value.
- To add another condition, click Add another condition.
- Choose AND or OR logic.
- Repeat step 5 for the new condition or step 6 for additional conditions as needed.
- Click Save to apply the filter on the selected widget or report.
Cascading Filters
Cascading filters allow agencies to build an advanced filtering system where the selection in one filter, like country, dynamically affects the options available in another filter, like city.
To add this dynamic filtering:
- Enter Edit mode in your report.
- Add the primary filter control, for example, Country, by selecting Insert, then a Drop-down list.
- Place it in your report.
- In the right-side Properties panel, under SETUP, set the Control field to the primary dimension.
- Add the secondary filter control, for example, City, by selecting Insert, and then a Drop-down list.
- Add it to your report.
- In the Properties panel, under SETUP, set the Control field to the secondary dimension.
Filter Inheritance
Filter inheritance helps agencies see how filters applied at different levels interact. So, when used, the filtering logic will be the same in all your selected widgets, pages, or throughout the report.
This setting is enabled by default and can be toggled off by a report editor. To check the filter inheritance:
- Select the component or a report.
- In the Properties panel, under SETUP, locate the Filter section.
- Toggle on or off Inherit filters from parent components.
Strategic use of inheritance can create powerful reporting setups where some charts respond to filters while others stay fixed as reference points.
How to Troubleshoot Common Filter Issues
Every Looker Studio power user knows that once you add a filter or two to a report, there might be some performance issues. Luckily, we’ve got some fito help to minimize the laggy performance to a minimum.
Performance Lag
Complex filters can slow down report loading times. To avoid looking at the loading screen for too long, simplify your report by reducing the number of charts and filters per page. Consider splitting data sources across different pages and minimizing the use of calculated fields.
Quick fixes for sluggish reports:
- Sample your data during the design phase
- Apply date filters at the data source level
- Use the “Limit rows” option in data sources
- Simplify complex RegEx when possible
- Try date controls instead of date filters
If you see “This report might be temporarily unavailable” when loading, your filters might be too complex – try simplifying them.
Missing or Null Values
Null values can cause filters or widgets to break, and you’ll be left with the “Chart configuration error” message. To avoid this, check whether your data source handles nulls appropriately.
You can create filters that exclude null values or use calculated fields to replace them with default values. For example, the IFNULL function can switch null values with a specified default value:
IFNULL(dimension, "Default value")
Other ways to handle those pesky nulls:
- Create a calculated field that merges dimensions to eliminate nulls
- Use CASE statements to transform NULLs into meaningful categories
- Clean your data before it hits Looker Studio
- Use “Is NULL” filters to isolate and fix records with missing data
Incompatible Data Sources
Some filters may not work across blended data sources in Looker Studio, especially if the data sources lack common data points.
Check the fields used for blending and make sure they’re compatible with the filter. You can also create separate charts for each data source if the issue persists.
Common fixes for data source compatibility headaches:
- Make sure join keys match in type across sources
- Create calculated fields to standardize formats
- Use separate pages for different data sources
- Try Community Connectors that pre-blend data
Filter Limitations
Filter controls are designed to work with a single dimension at a time. If you need to filter by multiple dimensions, you’ll have to add separate controls for each one.
Alternatively, you can create a calculated field that combines multiple dimensions into one, helping you to filter based on that combined field.
For example, you might use a formula like CONCAT(Country, ” – “, City) to merge two similar dimensions into a single field.
Other filter limitations to keep in mind:
- Maximum 50 filter controls per report
- Filters can’t directly filter metrics (only dimensions)
- Some filters won’t work with complex aggregations
- Cross-filtering doesn’t work between blended data sources
- Preset filter buttons can’t use conditional formatting
Read our complete Looker Studio limitations and how to overcome them.
Alternatively, you can sign up for a free trial with Swydo, and automated marketing reporting software.
Read our Looker vs Swydo comparison and see why thousands of marketing agencies are switching over.
Tips on How to Build Looker Studio Filters
While there’s a range of filtering options available in Looker Studio, remember that they’re available to help you make data-backed decisions faster, not to add unnecessary complexity to your reports.
Use Clear Filter Names
Assign easy-to-understand names to your filters. Instead of naming your filters Filter123, switch to names, like Device Category = Mobile or Event Label = Add To Cart. Clear naming will help the team members and clients quickly understand the data being presented and use the filters more conveniently.
Cut the Number of Filters
While filters are powerful, overusing them can overwhelm both the viewers and the report itself. Focus on the most impactful filters that align with your client’s objectives, and when creating a new filter, make sure you can’t tweak the existing one.
Test Filters Across Various Scenarios
Before finalizing your reports and sending them to your clients, test filters to check whether they work across different pages.
Do a final check for performance issues, verify whether the filters return expected data points, and test them with blended data sources.
Offer Guidance for Clients
Interactive filters help clients to explore data on their own. With your performance report, attach a brief tutorial on how to use the available filtering options.
Best Practices for Looker Studio Filters
| Category | Best Practice | Why It Matters |
|---|---|---|
| Filter Naming | Use descriptive names like “Device = Mobile” instead of “Filter1” | Makes filters instantly recognizable for both your team and clients |
| Filter Quantity | Limit to 3-5 key filters per page | Prevents overwhelming clients and improves report performance |
| Filter Placement | Position frequently used filters at the top of the report | Improves usability by making important controls easily accessible |
| Filter Grouping | Group related filters together (e.g., all location filters) | Creates logical organization that’s easier for clients to navigate |
| Default Values | Set sensible default filter values | Ensures reports load with the most relevant view first |
| Documentation | Include brief filter instructions in the report | Helps clients understand how to use filters effectively |
| Performance | Apply date filters at data source level when possible | Significantly improves report loading times |
| Testing | Test filters with various data scenarios before sharing | Prevents unexpected errors when clients use the report |
| Consistency | Use the same filter types across similar reports | Creates a familiar experience for clients across all their reports |
| Visual Cues | Add color coding or icons to different filter types | Makes it easier to distinguish between different filter functions |
| Filter Reset | Include a “Reset Filters” button for complex reports | Allows clients to easily return to default view when needed |
| Mobile Optimization | Test filter usability on mobile devices | Ensures reports remain functional on all devices |
| Filter Controls | Match filter type to data complexity (dropdown for many options, checkbox for binary) | Improves user experience by using the most appropriate control type |
| Maintenance | Regularly audit and remove unused filters | Keeps reports clean and improves performance |
| Client Training | Provide a quick demo of filter functionality | Ensures clients can get maximum value from interactive features |
Bottom Line
Mastering filters in Looker Studio will help your team tidy up your client’s reports. Test out different filters, transform overwhelming loads of data into clear narratives that highlight the best-performing campaigns, and present what really matters to your clients.
Get started with simple chart-level filtering options, like filtering by campaign name or device type. These allow you to focus on specific data points within individual widgets, making it easier to analyze performance metrics for particular segments. As you become more comfortable, explore page-level filters to apply consistent filtering rules across multiple charts on a single page, or report-level filters to promote consistency throughout the entire report.
Looker Studio Filters FAQ
Quick answers to the most searched questions about Looker Studio filtering
Filters in Looker Studio control which data appears in your reports by including or excluding specific data points based on conditions you set. They help you show only relevant information to your audience.
Select your chart, go to the Properties panel on the right, click the SETUP tab, scroll to the Filter section, click ADD A FILTER, then either choose an existing filter or click “Create a Filter” to make a new one.
Chart filters affect only one specific chart, while page filters affect every chart on that page. Use chart filters for specific data points and page filters when you want consistent filtering across multiple charts.
Yes, all filtering features in Looker Studio are completely free. You can create unlimited filters, use all filter types, and apply them to any number of charts or reports without any cost.
Yes, filters work perfectly with Google Analytics data. You can filter by dimensions like traffic source, campaign, device type, geography, and any other GA dimension available in your reports.
Go to Insert > Drop-down list, click where you want to place it, then in the Properties panel under SETUP, choose the dimension you want to filter by in the Control field. Your dropdown will show all available values for that dimension.
Insert a Date range control from the toolbar, place it on your report, then in Properties > SETUP > Control field, select your date dimension. Users can then select custom date ranges to filter all connected charts.
Yes, when creating a filter, click “Add another condition” to combine multiple criteria using AND or OR logic. This lets you create complex filters like showing only mobile users from specific countries.
Create a report-level filter that excludes your internal IP addresses or domains. Set the condition to “Exclude” and use “Contains” with your internal IP range or company domain name.
Include filters show only data that matches your criteria, while exclude filters hide data that matches and show everything else. Use include when you know exactly what to show, exclude when it’s easier to remove unwanted data.
Use filter controls like dropdowns, checkboxes, or date pickers instead of editor filters. These appear as interactive elements on your report that viewers can use to filter data themselves without editing the report.
Too many complex filters can slow performance. Limit filters to 3-5 per page, apply date filters at the data source level, use “Limit rows” in data sources, and avoid complex regular expressions.
Verify the filter is applied at the right level (chart, page, or report), check that field names match exactly, ensure there’s no conflicting filters, and confirm your data source contains the values you’re filtering for.
Create filters that exclude null values, or use calculated fields with IFNULL functions to replace nulls with default values. You can also create “Is NULL” filters to isolate and fix missing data.
Filters may fail across blended sources if join keys don’t match or common fields are incompatible. Ensure join fields have the same data types and consider using separate charts for each data source if blending issues persist.
You cannot directly copy filters between reports. You’ll need to recreate them manually or use report templates. However, you can copy entire charts with their filters, then modify as needed.
Limit to 3-5 filters per page to avoid overwhelming users and maintain performance. Focus on the most important filters that align with your audience’s key questions and objectives.
Use editor filters for baseline data that shouldn’t change (like excluding test data) and viewer controls for interactive filtering that users should control (like date ranges or campaign selection).
Group related filters together, place frequently used filters at the top, use clear descriptive names, and consider adding a “Reset Filters” button for complex reports with many filter options.
Use dropdown filters instead of fixed lists for mobile, minimize the number of filter controls, ensure filter buttons are large enough for touch interaction, and test your reports on mobile devices.
Use regex for pattern matching like filtering campaign names with specific formats, separating branded vs non-branded terms, or excluding URLs with certain patterns. Keep patterns simple to avoid performance issues.
For filter controls, set default values in the Properties panel under SETUP > Default value. For editor filters, the conditions you set become the default. This ensures reports load with the most relevant view first.
Create professional client dashboards in minutes, not hours.
Start Your Free Trial Today