
If you’re still hammering Ctrl+C and Ctrl+V on Instagram campaign data at 11 p.m. the night before a client meeting, something’s broken. Every marketing agency knows this grind you’re buried in Facebook Ads Manager exports while clients wait impatiently for real-time performance updates, and you’re losing time trying to get it all into a neat and pretty report.
Meta makes Instagram reporting clunky compared with Google’s plug-and-play integrations. But you’ve got options. In this guide, we’ll break down the connectors worth your time, the reporting platforms that actually deliver, and the Instagram Ads metrics that carry weight (spoiler: not likes).
Connect Instagram Ads to Looker Studio
Before you jump into Instagram Ads reporting, cover these basics:
- Get Facebook Ads Manager access. You’ll need at least Advertiser permissions for the ad accounts you manage. Every Instagram ad runs through Facebook’s platform, so this is your master key.
- Set up a Looker Studio account. It’s free with any Google account. If you don’t have one, create it now.
- Choose a connector or storage solution. Instagram doesn’t plug into Looker Studio natively, so you’ll need either a third-party connector or a storage option for your Facebook Ads Manager data.
How to Set Up Looker Studio
If you’re coming from another reporting platform, here’s how to set up Looker Studio:
- Go to the Looker Studio website.
- Click Use it for free.
- Sign in with your Google account (or create one if you don’t have one yet).
- Follow the on-screen prompts to finish setup.
Once you’re done, you’re ready to build your first report.
Check Facebook Ads Manager Permissions
Once your Looker Studio account is ready, you need to ensure access to your client data in Facebook Ads Manager. Permission issues are the number one reason people get stuck here.
Facebook Ads Manager has a few permission levels:
- Admin unlocks full control over budgets, ads, billing, and reporting. This is what most agencies give their campaign managers.
- Advertiser role can create and manage campaigns, see reports, edit ads, but can’t tweak the billing or account settings.
- Analyst has read-only access to campaign data and reports. They see everything, but can’t change anything.
To check or change permissions:
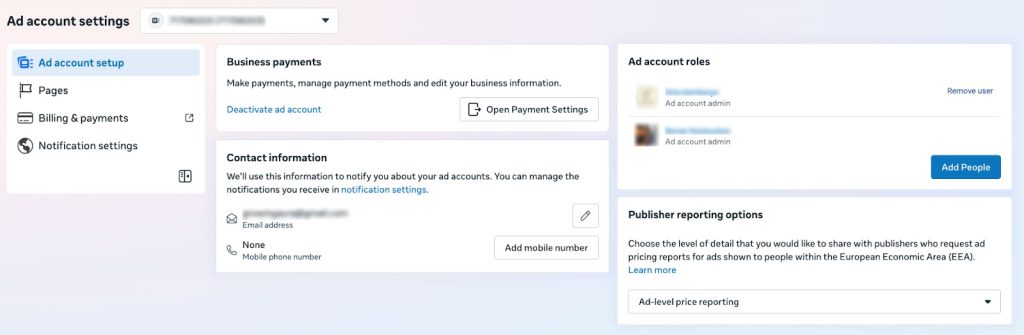
- Log in to Meta Ads Manager and select the advertising account. If you don’t see the right ad account, click See more ad accounts.
- In the ad account, press the gear icon or Settings. You might need to re-enter your Facebook password for verification.
- Scroll down to the Ad account section and find your name.
You’ll see your role for the specific ad account. For example:
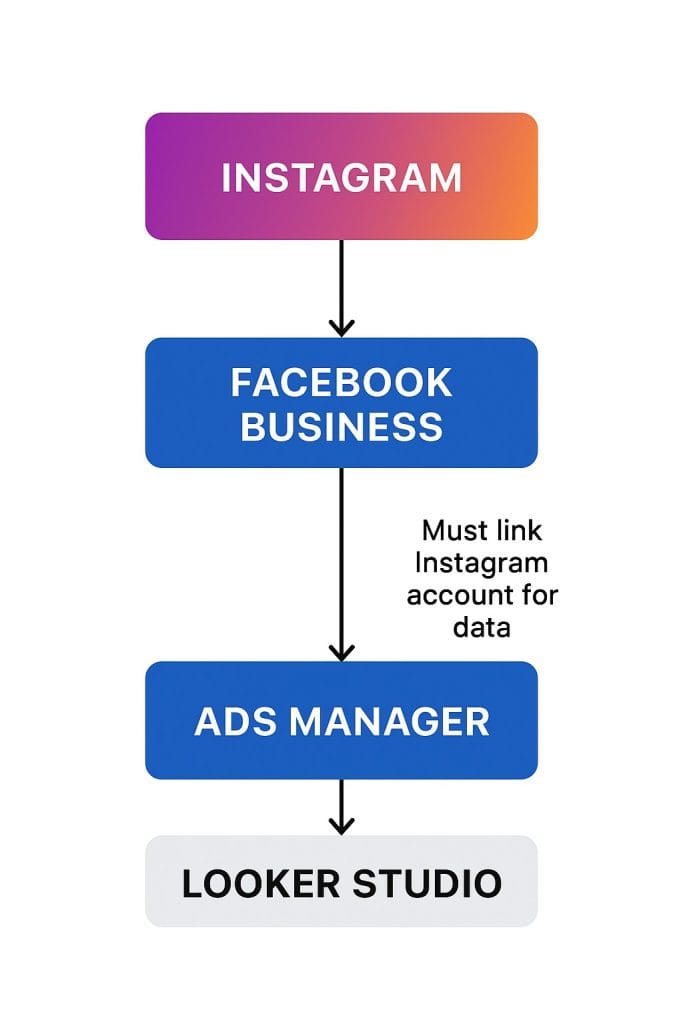
Quick Reminder: Ads Manager ≠ Business Account.
You need a Facebook Business Account to pull Instagram ads.
- You can have Ads Manager without Business Manager, but not vice versa.
- People often try to pull Instagram ad metrics into Ads Manager without linking an Instagram account to a Business Manager. Result: Ads either don’t appear in the interface, or data is incomplete — leading to confusion.
- To see Instagram Ads data in Ads Manager, you must link your Instagram account through a Business Manager.
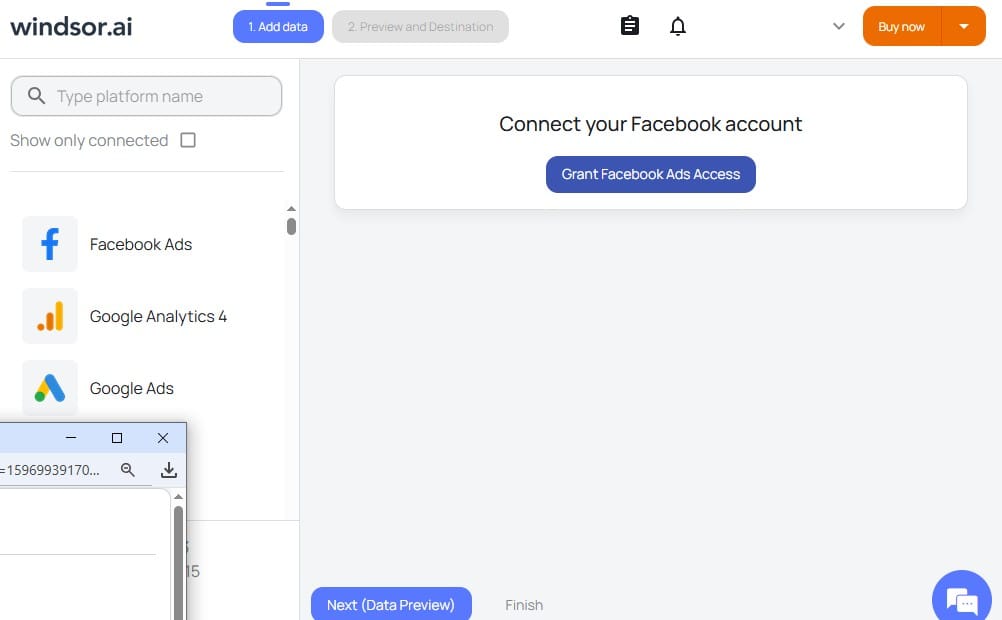
How to Connect Instagram Ads Data to Looker Studio
Instagram doesn’t have a direct connection to Looker Studio, which creates a challenge agencies must solve before building reports. Unlike Google’s ecosystem, where properties link together seamlessly, pulling Instagram data into Looker Studio requires a few extra steps.
Luckily, you have a couple of options: one is free but requires some manual work, while the other is automated but will ask your agency to commit to a monthly budget.
Option 1: Manual CSV Export
This is the most basic to get IG Ads data into Looker Studio. It’s free, but it can eat up a lot of time, especially when you’re working with dozens of clients.
To manually export Instagram data from Meta Ads Manager:
- Log in to Meta Ads Manager for the ad account.
- Go to Ads Manager or directly to Reports (the interface may show Reports, Custom Reports, or Ads Reporting).
- Select the campaigns, ad sets, or ads you want to include.
- Apply filters: set the start and end dates, choose only Instagram campaigns, and select relevant metrics.
- (Optional) Add breakdowns by day, placement, or device.
Headsup: This process gets messy with multiple clients. If you forget a filter or a date range, your Looker Studio charts won’t match client KPIs — a rookie mistake that hurts trust fast.
Once you’ve got your files:
- Upload them to Google Sheets.
- Clean up the data — remove wonky formatting, extra columns, or unwanted data points.
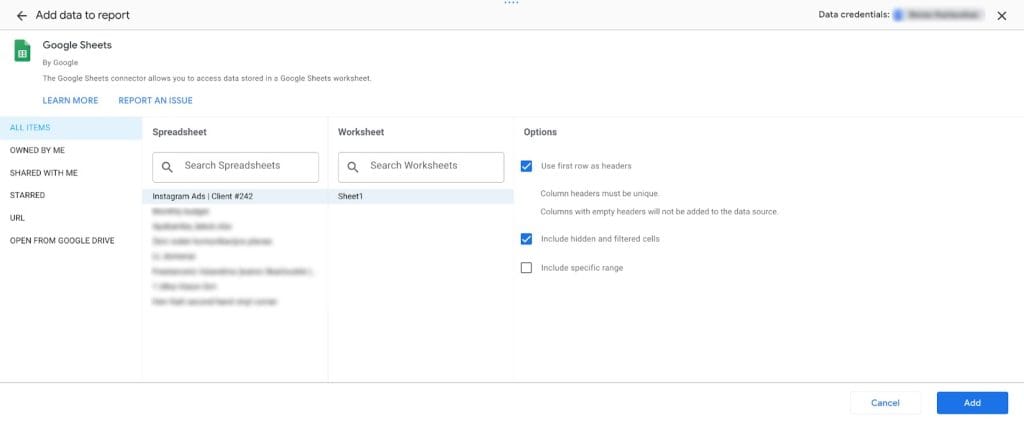
Connect Google Sheets to Looker Studio:
- Open Looker Studio and hit Create, then Report.
- Click Add data in your new report.
- In the data connector marketplace, find the Google Sheets connector.
- In the authorization window, select the sheet with the Instagram ads data.
- Choose your metrics and dimensions, then click Add.
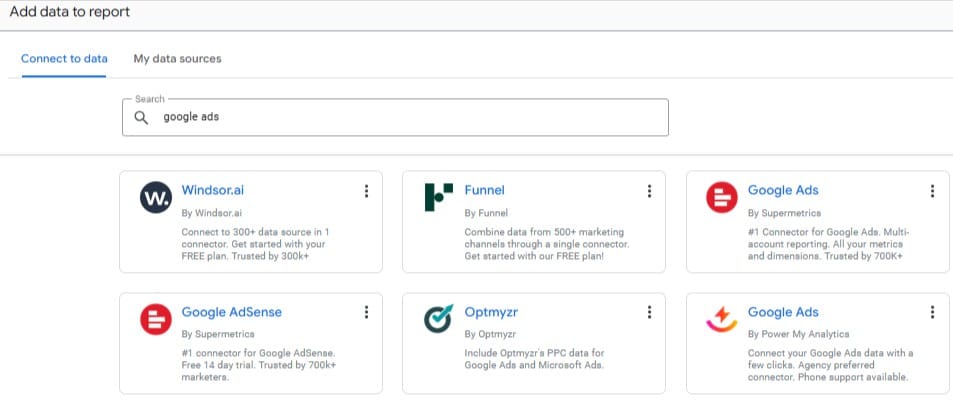
Option 2: Third-party Connectors
Third-party connectors do the heavy lifting for you — they pull your Instagram data and push it straight into Looker Studio automatically. No manual exports, no CSVs, or broken tables due to that extra column in the sheet.
Depending on the data connector you’ve chosen, the setup might vary a bit, but the main steps are the same:
- In Looker Studio, click Add data and then search for your connector.
- To authorize your connector, log in to the platform.
- You might also need to verify your Meta and Google accounts.
- Choose the ad account, metrics, dimensions, and set the data-refresh schedule.
- Click the Add to Report button to pull Instagram Ads data into Looker Studio.
Best Instagram Ads Connectors
Not all connectors are the same, and some have very different features. Some are expensive, some are buggy, and some are missing key features marketing agencies need. Here’s the breakdown of what’s actually worth your time and money:
Budget-Friendly Instagram Connectors
| Connector | Key Features | Pricing |
|---|---|---|
| Google Sheets | Flexible, supports advanced calculations, manual but customizable | Free |
| Windsor.ai | No-code setup, wide metrics coverage, refreshes in minutes | Free plan; paid from $23/mo |
| Porter Metrics | Pre-built templates, easy setup, multi-connector subscription | Free plan; paid from $15/mo |
| Reporting Ninja | Simple cross-channel reporting, pre-made templates | From $20/mo |
Enterprise Instagram Connectors
| Connector | Key Features | Pricing |
|---|---|---|
| Funnel.io | Advanced custom metrics, attribution, currency conversion | From $600/mo; custom pricing |
| NinjaCat | AI-powered features, cloud storage, white-labeling | From $1,500/mo; custom pricing |
| Dataddo | 300+ connectors, auto-syncing, no-code setup | From $129/mo; free plan avail |
Windsor.ai and Funnel.io are two popular third-party connectors for Meta accounts
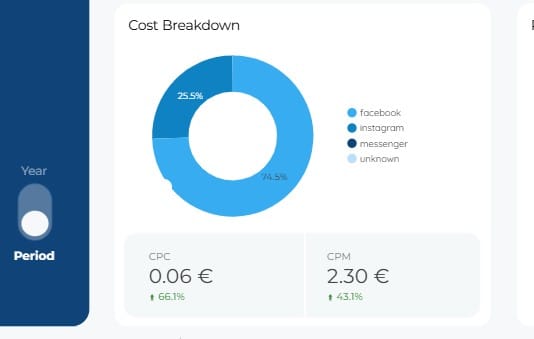
Handy Instagram Ads Dimensions
Instagram’s visual posts and social features give you tracking tools other platforms can only try to copy. By following the right dimensions, you can see which audiences, ad types, and placements actually drive results for each client.
Campaign Structure Dimensions
These show how each layer of your Instagram campaigns — from overall campaign to individual ad sets and creatives — is performing, so you can see what’s actually working and where to focus your efforts.
| Dimension | What It Shows | How It Helps Your Clients |
|---|---|---|
| Campaign name | Performance across different Instagram campaigns | Shows which campaign strategies work |
| Ad set name | Individual audience and targeting performance | Shows which audiences convert most |
| Ad name | Individual creative performance | Identifies which messages and visuals resonate |
| Objective | Performance by campaign goal (awareness, traffic, conversions) | Shows which Instagram goals drive the best ROI |
Creative and Format Dimensions
Instagram offers a wide mix of ad formats — from single images to carousels to Reels — but not every format works the same for every audience. Tracking which creative types actually capture attention and drive action lets you stop guessing and start putting your ad dollars where they count.
| Dimension | What It Shows | How It Helps Your Clients |
|---|---|---|
| Ad format | Single image vs. carousel vs. video vs. collection performance | Shows which creative formats work best |
| Creative type | Static vs. video vs. carousel breakdown | Helps optimize ad creatives and use only the best-performing types |
| Call-to-action | Performance by CTA button, like Learn more or Shop now | Shows which CTAs convert users best |
| Ad placement | Feed vs. Stories vs. Reels vs. Explore performance | Shows where on Instagram’s platform ads perform best |
Audience Demographics
These dimensions don’t just spit out numbers — they show you who is paying attention and actually reacting to your ads. Without them, you’re just guessing which audiences matter and which ones are wasting your client’s budget.
| Dimension | What It Shows | How It Helps Your Clients |
|---|---|---|
| Age | Performance by age groups, for example, 18-24 years old | Shows which age ranges engage most with ads |
| Gender | Male vs. female performance | Informs creative and targeting decisions for gender-specific ads |
| Location | Geographic performance breakdown | Highlights high-performing regions for budget allocation |
| Language | Performance by audience language | Helps optimize campaigns for multilingual or international markets |
Device and Technical Dimensions
Technical dimensions reveal how your Instagram audience engages with ads across devices, placements, and formats to show what works best and help optimize campaigns.
| Dimension | What It Shows | How It Helps |
|---|---|---|
| Device type | Mobile vs. desktop (though Instagram is mostly mobile) | Helps optimize creatives for mobile usage |
| Platform | Instagram vs. Facebook performance for cross-platform campaigns | Shows where to allocate budget between platforms |
| Publisher platform | Breakdown by Meta property (Instagram, Facebook, Messenger) | Optimizes placement mix across Meta’s ecosystem |
Time-based Dimensions
Time-based dimensions show when your audience is actually paying attention. It’s not just about who sees your ads, but whether they see them at the right moment to click, sign up, or buy.
| Dimension | What It Shows | How It Helps |
|---|---|---|
| Date | Daily ad performance trends | Identifies trends and helps adjust campaigns in real time |
| Day of week | Which days generate the best Instagram engagement | Guides scheduling to focus on the most responsive days |
| Hour | When Instagram audiences respond best | Fine-tunes delivery for peak user activity |
| Month | Seasonal performance trends | Helps plan budgets and campaigns around seasonal spikes |
How to Automate Instagram Ads Reporting in Looker Studio
Nobody ever started a marketing agency just to spend hours fixing broken spreadsheets. If you’re still pulling numbers from Ads Manager by hand, you’re wasting time you could spend on strategy or performance optimization. To start saving time, follow these steps:
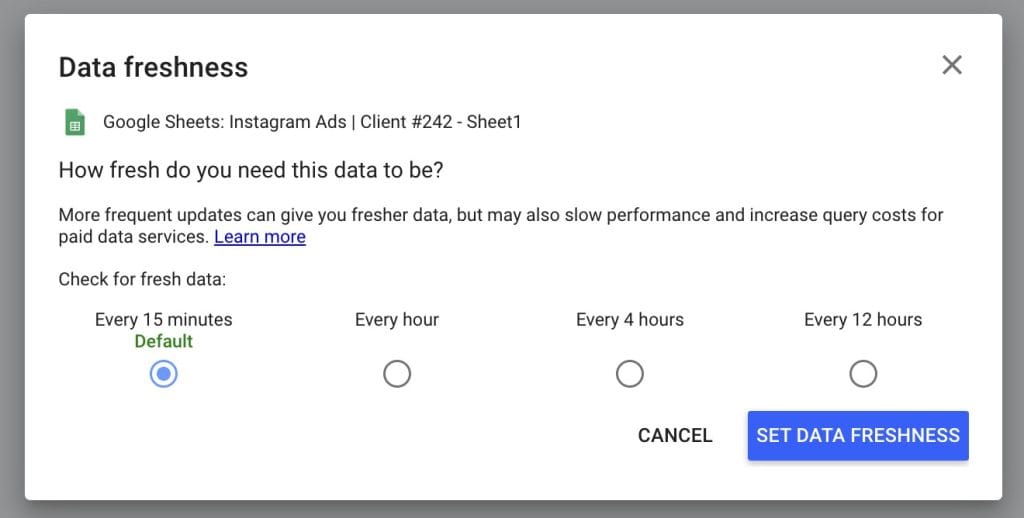
Step 1: Automate Data Refreshes
Get your Looker Studio reports to update automatically so you’re not manually refreshing data every all the time.
- Open your Instagram report in Looker Studio.
- Select Resource from the top menu, then click Manage added data sources.
- Find your Instagram connector and click Edit.
- Scroll to Data freshness settings.
- Set your refresh frequency. For time-sensitive campaigns, choose 15 minutes. To save resources, select 12 hours.
- Click Set data freshness and save.
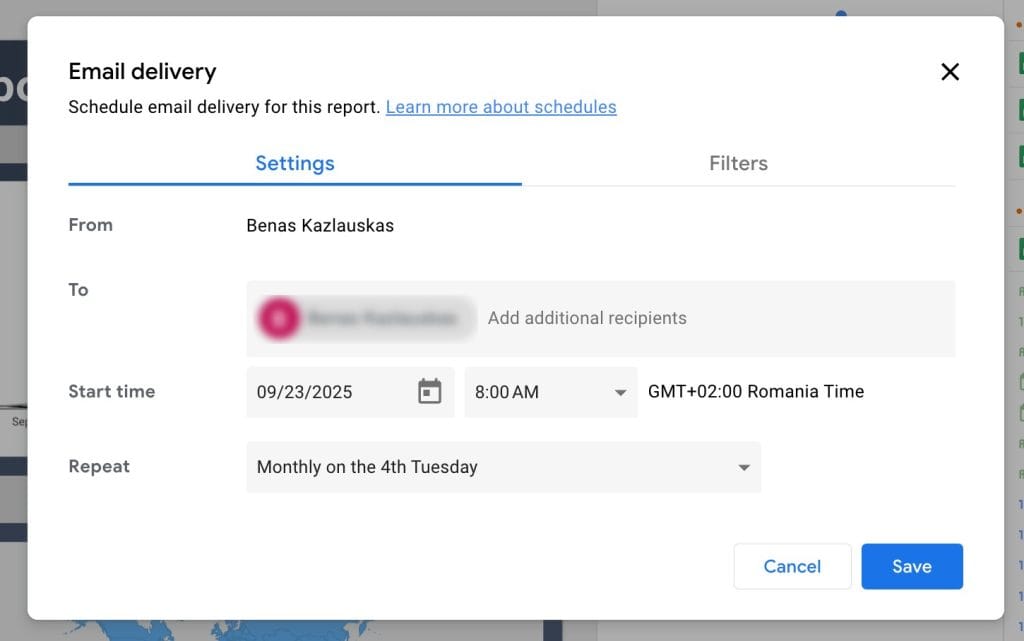
Step 2: Schedule Report Delivery
Set up automated delivery and let Looker do the work. Your client will automatically get their reports straight to their email inbox.
- Choose the report that you want to send automatically.
- Click the arrow button next to Share, then select the Schedule delivery icon.
- Choose a date and preferred time you want to start sending your performance reports.
- Tweak the Repeat options to adjust delivery frequency.
- Enter all the emails that need to get the report.
- Click Schedule, and your report will go out automatically at the set time.
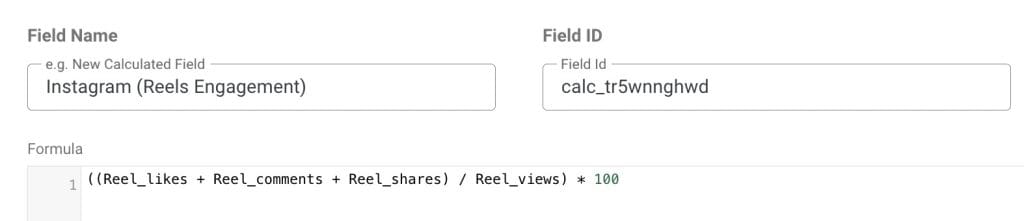
Step 3: Use Calculated Fields
Most connectors give you only basic metrics. When clients want zero in on more granular data like Reels engagement rates, calculated fields are your friend.
Here’s an example:
- Open your client report in Looker Studio.
- In the top menu, click Resource → Manage added data sources.
- Find the Instagram Ads data source and click Edit.
- In the upper right, click + Add a Field.
- Name your field (e.g., Reels Engagement Rate).
- Enter the formula: (Reel_likes + Reel_comments + Reel_shares) / Reel_views * 100
- Click Save, then Done.
Tip: Use this version when some Reels might have zero views. Without it, Looker Studio would throw an error:
CASE

  WHEN Reel_views = 0 THEN 0

  ELSE (Reel_likes + Reel_comments + Reel_shares) / Reel_views * 100

END
This ensures the engagement rate returns 0 instead of causing an error.
Also set the Type to Percent for charts.
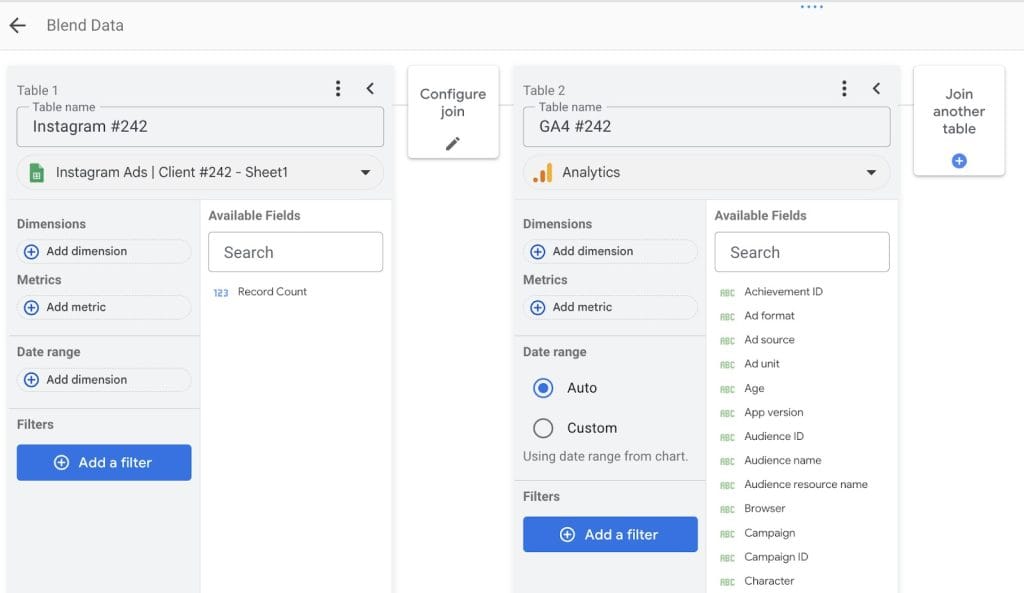
Step 4: Automate Cross-channel Reporting
Combine Instagram data with data from Google Ads, TikTok, LinkedIn Ads, and other platforms to show complete performance without manual data merge.
- Open your report in Looker Studio.
- Click Resource → Manage added data sources.
- If needed, click + Add a Data Source to add other platforms.
- Ensure your metrics align across platforms.
Click Manage blends → + Add a Blend. - Pick your primary source (for example, Instagram).
Choose your alignment dimension (for example, Date) and add all relevant metrics. - Click Join another table to add another platform.
- Repeat Step 8 for any additional platforms you want to include.
- Click Save.
How to Fix Common Instagram Integration Errors
Since Google leaves Instagram integration to third-party data connectors, you might run into mismatched fields, broken connections, or missing metrics. Fix these issues with a few quick checks and adjustments.
Missing or Incomplete Data
When your connector stops working or Facebook’s API faces clitches, you’ll see gaps in your data. Instagram data can take 24-48 hours to finalize, but you can check a few things while waiting for data to refresh.
Start by checking your data connector:
- Log into your connector’s dashboard.
- Try refreshing data manually to see if there’s an issue.
- If data is still outdated, disconnect your Instagram account from the connector and reconnect it.
If everything’s set on your third-party connector’s side, then move to the Looker Studio side:
- Open your report.
- Click Resource > Manage added data sources.
- Find your Instagram connector, click Remove, then reconnect it.
- Wait for data to load and verify the latest numbers.
Authorization and Permission Errors
Authorization and permission errors usually happen when Facebook permissions change or Instagram Business accounts disconnect.
First of all, check for authentication issues:
Check for authentication issues:
- Log in to your connector’s platform.
- Disconnect your Facebook account and reauthorize it.
- If the report still shows issues, verify that your ad account permissions on Meta haven’t changed. You need at least an Advertiser or Admin role.
- Make sure the ad account is connected to the Instagram account you’re running ads from.
- Clear your browser cache and reauthenticate your connector.
Timeouts and Slow Loading
Looker Studio is infamous for its crashes and laggy performance when working with bigger datasets. To speed things up:
- Limit reports to 60–90 days of data.
- Review metrics and blended data sources, removing fields that aren’t used or reported frequently.
- Split large reports into separate pages — for example, create tabs for Stories campaigns, Reels performance, and a general overview.
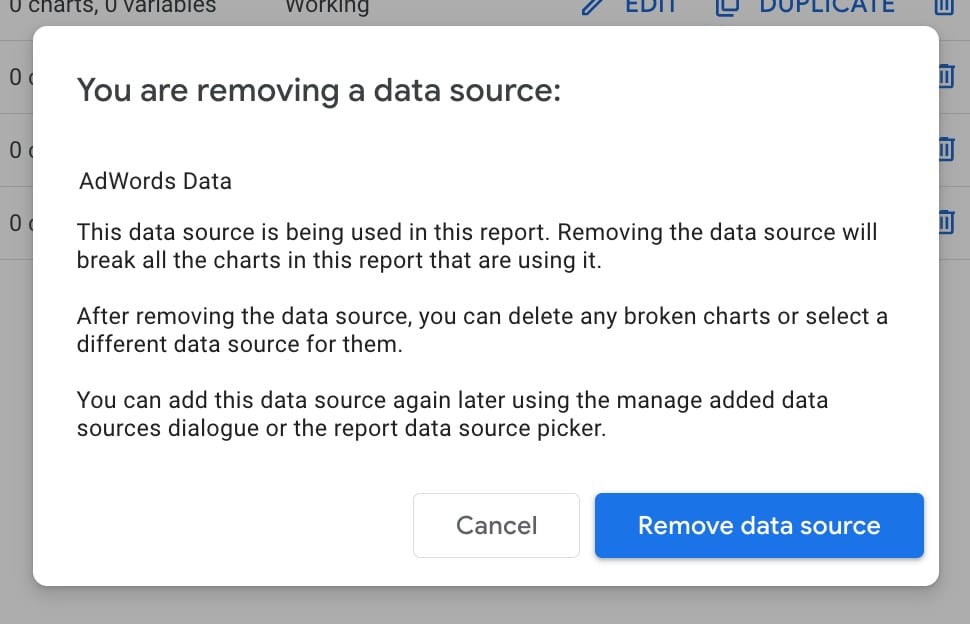
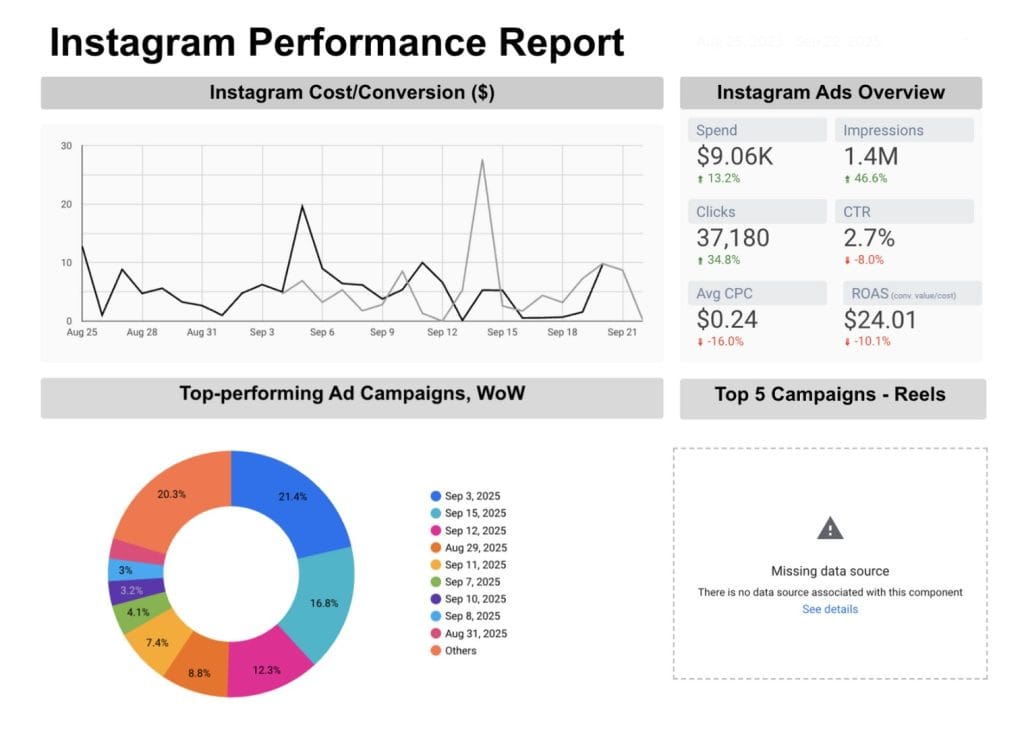
Missing Data Source Error
Your report is working fine, then it suddenly shows a Missing data source error. This means Looker Studio can’t find the data feeding your charts.
The easiest way to fix this issue is by reconnecting your data source:
- Open your report.
- Go to Resource > Manage added data sources.
- Find the broken source and click Edit.
- Click Edit Connection or Reconnect.
- Re-authenticate your Instagram connection.
- If the data structure has changed, click Refresh Fields, then Apply.
- Ensure the source is connected to all widgets in the report.
- For multiple affected charts, select them (Ctrl+Shift) and assign the source to all at once.
Alternatives to Instagram Ads and Looker Studio Reporting
Marketing agencies have enough demands on their time without dealing with manual CSV imports or troubleshooting Looker’s Missing data source errors every few days. Imagine running 20 Instagram ad accounts and losing hours just untangling connector issues — his is where smarter, purpose-built platforms save your sanity and your team’s time.
Platforms Built for Agencies
Looker Studio works for a handful of clients, but managing 20 or more Instagram ad accounts requires a platform that scales without drowning you in spreadsheets. Swydo, for example, is built for marketing agencies, streamlines reporting, and makes Instagram Ads reporting way less painful. Instead of building everything from scratch like in Looker Studio, Swydo does a lot of the work for you with these built-in features:
- Ready-to-use templates save hours of setup.
- Automated data import and report scheduling keeps metrics up-to-date without manual downloads.
- Cross-platform reporting lets you combine Instagram data with TikTok Organic, Google Analytics 4, Facebook Insights, and other platforms in a single dashboard.
Facebook Ads Manager
Facebook Ads Manager is another alternative for Instagram ad reporting that skips all the issues with third-party connectors. Since Instagram ads run through Facebook’s advertising platform, Ads Manager gives you native access to all your Instagram campaign data.
Use it to download campaign reports with precision:
- Log in to Facebook Ads Manager and select the correct ad account.
- Click the left-side menu and choose Ads Reporting.
- Filter by Instagram under Placements or Platforms.
- Customize columns to track the metrics you need, e.g., impressions, reach, conversions.
- Click Export in the top-right corner.
- Name your file, choose a format, and optionally include a summary row.
- Click Export again to download your report.
Remember: While Ads Manager gives precise Instagram campaign data, it doesn’t combine metrics from TikTok or Google Analytics 4. For agencies managing multiple platforms, a connector-based tool still saves time.
Specialized Instagram Tools
Several platforms specialize in social media monitoring and reporting. Most focus on organic Instagram content, so they’re best suited for agencies managing both content marketing and paid ad campaigns. Explore these alternatives:
| Reporting Platform | Features | Pricing |
|---|---|---|
| Social Status | Social media reporting, ads tracking, competitor benchmarking, and influencer performance tracking in one platform | From $9/month, free plan available |
| Brandwatch | Collects data from social media platforms, daily conversation tracking, AI-powered data segmentation, and analysis | Custom pricing, contact Sales |
| YouScan | Visual listening, image recognition, sentiment analysis, and brand mention tracking | From $299/month |
| Hootsuite | Social media scheduling, content management, team collaboration, basic analytics dashboard, and post engagement tracking | From $99/month, free trial available |
Work Less, Know More: Instagram Reporting That Scales
Integrating Instagram ads with Looker Studio can be tricky because Meta doesn’t provide a direct connection. You have two main approaches:
- Manual CSV export: free but time-consuming and error-prone
- Third-party connectors: automate data flow but require setup and monitoring
Facebook Ads Manager provides direct access to Instagram campaign data without connectors, while social media marketing platforms offer specialized reports — most focusing on organic content rather than paid ads.
Choose a platform based on your agency’s needs:
- Test tools across different price points, including Looker Studio’s free version.
- Evaluate how well each platform integrates with your workflow.
- Match reporting capabilities to client expectations, e.g., some clients want multi-platform dashboards, others only Instagram campaign data.
Want to see how a reporting tool made for marketing agencies can speed up and optimize social reporting? Give Swydo a try free for 14 days.
“can you create a cta for Swydo, a client reporting tool using this code:Track the right TikTok metrics and boost your clients’ results today.
Start Your Free Trial TodayTrack KPIs • Optimize content strategy • No credit card needed
Automate Instagram Ads reporting and spend more time on strategy that moves the needle.
Start Your Free Trial Today