
Managing multiple LinkedIn client accounts under constant pressure for faster reports is exhausting. Manual CSV exports drain your time, and once you finally send the data, it might already be stale. LinkedIn Ads reporting can feel like a tug-of-war between chasing accurate metrics and actually acting on them to boost campaigns.
Unlike Google Ads or GA4 — which plug directly into Looker Studio — LinkedIn Ads doesn’t have a native connector, so agencies will need to rely on a third-party connector. It takes a little setup, but it’s doable.
This guide shows which connectors work best, which LinkedIn metrics actually matter, and how to automate reporting so you can focus on results instead of hassling with spreadsheets.
What You’ll Need to Connect LinkedIn Ads to Looker Studio
Before you start reporting, make sure you have:
- Access to LinkedIn Campaign Manager — at least an Account Manager role for any client ad accounts you handle
- A Looker Studio account — free with any Google account, required to create and customize reports
- A data connector or storage solution — LinkedIn lacks a native Looker Studio connector, so you need either a third-party tool or a spreadsheet to store raw data
Heads up: Double-check that your client grants you Account Manager access, not just Viewer. This ensures you won’t waste hours troubleshooting “missing data” when the real problem is permission scope.
How to Set Up Looker Studio
New to Looker Studio? You’ll need to create an account:
- Go to the Looker Studio website and click Use It for Free
- Sign up with your Google account using single sign-on
- Complete the guided setup to unlock all reporting features
- Confirm access by creating a new blank report — you’re now ready to build client dashboards
- Follow our Looker Studio tutorials for beginners for more information.
LinkedIn Campaign Manager Permissions
After your Looker Studio account is up and running, you’ll need to head back to your LinkedIn Campaign Manager to ensure access to all of the client’s ad accounts and the right permissions.
LinkedIn Campaign Manager has quite a few — here are the main ones to know:
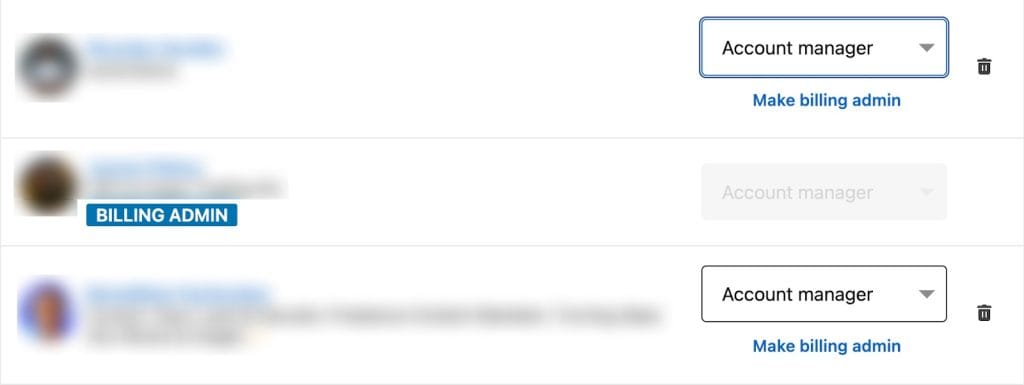
- Account Manager — Control all settings. Manage budgets, create and edit ads, and access complete data. Agencies typically assign this role to staff handling client campaigns and reporting.
- Campaign Manager — Create and manage campaigns. Adjust targeting and delivery, but avoid billing and account-level settings.
- Creative Manager — Focus on ad setup. Build campaigns, upload assets, and test variations. Budget controls and detailed performance data remain off-limits.
- Viewer — Review only. Access campaign data and basic reports, without the ability to make changes.

To check the current permission or add a new member to the LinkedIn Campaign Manager:
- Head to the LinkedIn Campaign Manager
- Choose an ad account
- Go to Account settings on the left-side menu
- Click Manage access
- Edit existing roles or add a new user by clicking Add User
How to Connect LinkedIn Ads Data to Looker Studio
LinkedIn lacks a native Looker Studio connector, meaning agencies must choose between manual exports or third-party solutions. Many teams spend 10+ hours monthly exporting CSVs, but you can cut this to minutes with the right approach.
You’ve got a few solid options.
Option 1: Manual CSV Export
The most basic approach is to manually export data from LinkedIn Campaign Manager. It won’t cost money, but it’ll definitely cost you time — and that time adds up fast when you’re managing multiple client accounts.
- Log in to LinkedIn Campaign Manager
- Go to the Advertise tab
- Select your date range and campaigns
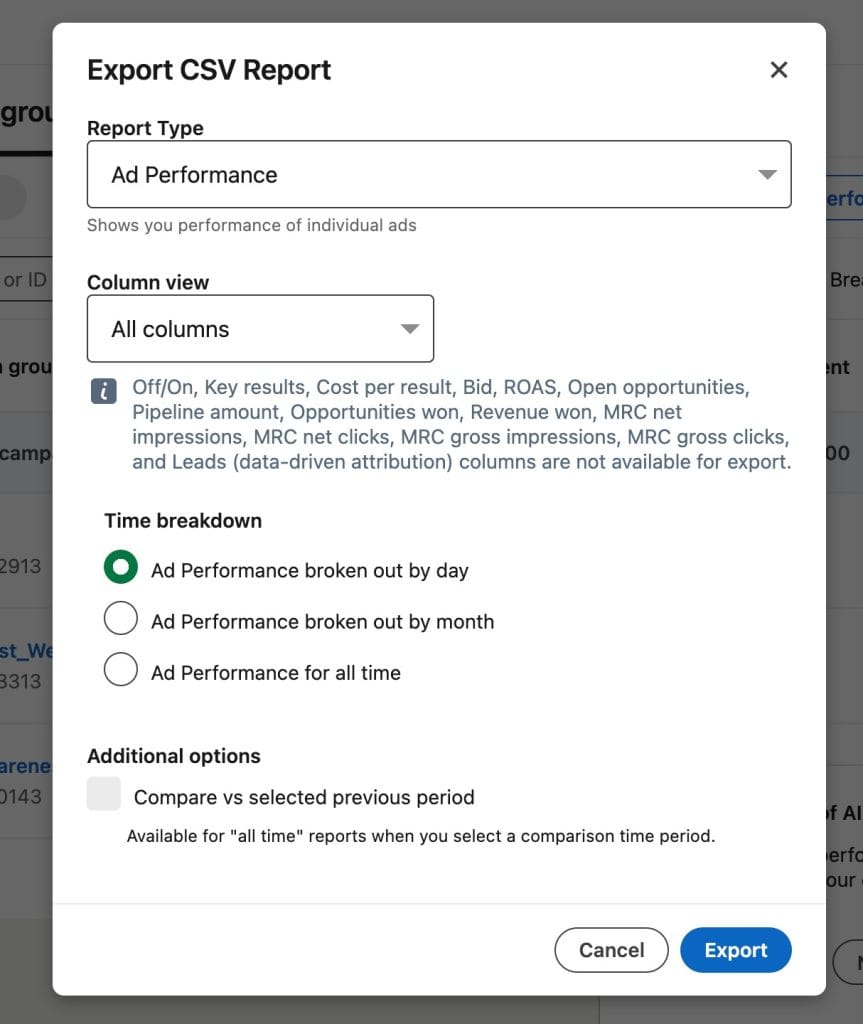
- Click Export and choose Ad Performance
- Customize Column view, Time breakdown, and reporting options
- Click Export to download CSV
After your file is ready, go to Google Sheets:
- Upload CSV to Google Sheets
- Clean and format data
Next, import to Looker Studio:
- In Looker Studio, select Create > Report
- Click Add Data, choose Google Sheets connector, select the sheet, pick metrics, click Add
Option 2: Third-Party Connectors
Third-party Looker Studio connectors handle the grunt work. They pull LinkedIn Ads data straight into Looker Studio on a client-ready schedule. No more late-night CSV exports or broken spreadsheets — the sync runs quietly in the background. Setup takes a little effort, but once it’s done, Looker Studio flows with minimal friction.
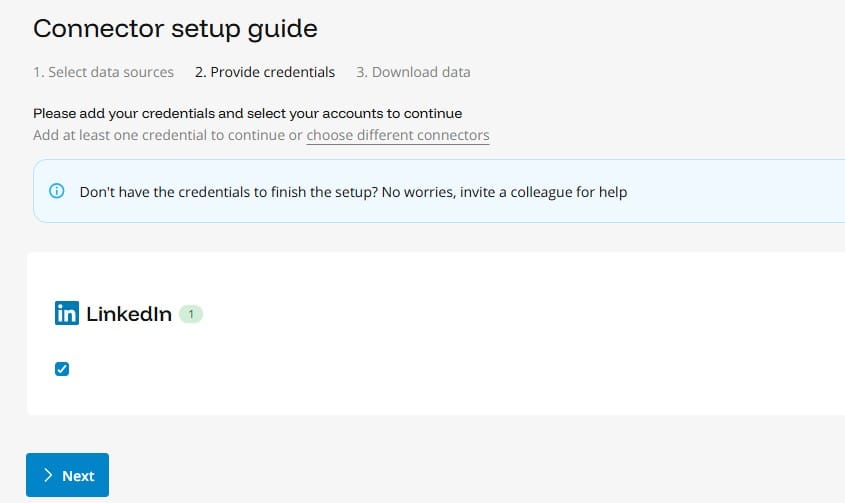
Step-by-Step: Using a Connector
- Open Looker Studio, click Create > Report
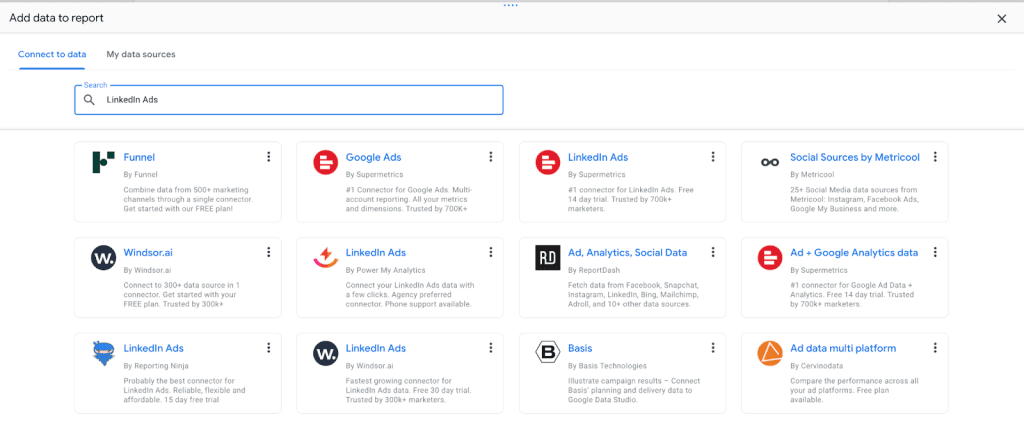
- Click Add Data
- Authorize LinkedIn Ads and the connector
- Configure metrics, dimensions, and refresh schedule
- Click Add to save and auto-refresh your report
Example: Agency X used Funnel.io to connect 10 client accounts. CSV exports that once took 12 hours per month now refresh hourly, saving 120+ hours annually.
Available LinkedIn Ads Connector Options
Getting familiar with LinkedIn Ads data connector options spares you from discovering deal-breakers after you’ve already set up client accounts. Different connectors charge varying fees, handle data differently, or have features that are a must for your marketing agency.
| LinkedIn Ads Connector Comparison | |||
|---|---|---|---|
| Connector | Key Features | Pricing | Best for |
| Funnel.io | Multi-platform data automation, currency conversion, custom metrics, advanced budget tracking | Free plan, custom pricing | Agencies handling multiple channels |
| Windsor.ai | No-code setup, extensive metrics, unlimited users and destinations | Free plan, $23+/month | Small agencies needing fast setup |
| Dataddo | Multi-account extraction, auto API adaptation, advanced blending, historical backfill | Free plan, $129+/month | Agencies with large data volumes |
| Supermetrics | Automated refresh, reusable templates, custom calculated fields | $47+/month | Agencies seeking flexible reporting |
| Porter Metrics | Pre-made templates, white-label options, 100+ data points, custom calculations | 14-day trial, $14.99+/month | Agencies needing ready-to-use dashboards |
And remember – before committing to a single LinkedIn Ads data connector, put it to some tests:
- Run it through real accounts. Connect active campaigns, not demos, and watch how the connector handles real data loads. Some tools hum along with small spends but choke when you throw in enterprise volumes.
- Do the math. That $99/month starter tier looks fine until fees pile on per user or per account. With 15 clients, you’re staring at $500+ just for data access.
- Test refresh speed. Active campaigns and fresh creatives need timely numbers. A connector that updates once a day leaves you blind to fast-moving changes.
- Gauge the setup. Some connectors demand API keys, custom fields, or developer-level tweaks. If you don’t have in-house tech, that’s a hidden cost.
- Probe support. Send a ticket and see what comes back. Do you get marketers who know agency pain points — or canned replies that waste your time?
Most platforms offer free trials, so pick 2-3 data connectors and run them side by side with the same client data. The winner should handle your data smoothly, offer reasonable pricing for your client load, and have all the features you need for efficient reporting.
Must-Track LinkedIn Ads Metrics
LinkedIn reporting can overwhelm you with dozens of available metrics. The key to reports that actually matter is to focus on what drives real business results for your clients, not vanity metrics that look impressive but don’t connect to revenue.

Performance Metrics
Track the numbers that show if your LinkedIn campaigns are working. Monitor reach, engagement, and spend efficiency weekly to spot trends, optimize budgets, and prove results.
| Metric | What It Shows | How It Helps Clients | Recommended Frequency |
|---|---|---|---|
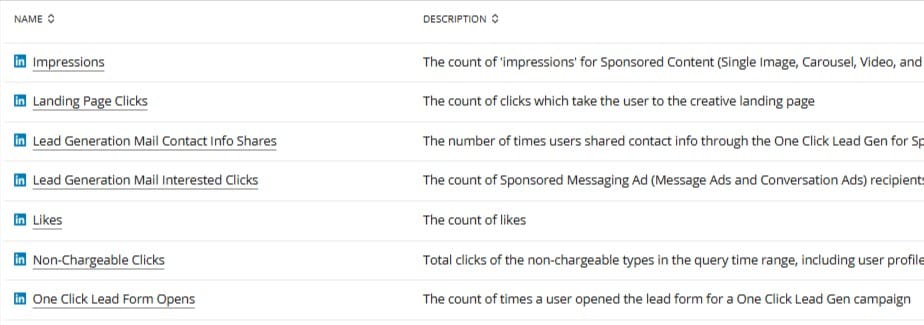
| Impressions | Number of times ads appeared in LinkedIn feeds | Tracks brand visibility and reach | Weekly |
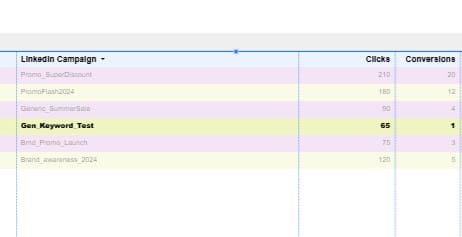
| Clicks | Total ad clicks | Measures interest and engagement | Weekly |
| CTR (click-through rate) | Percentage of impressions resulting in clicks | Evaluates ad creative and targeting | Weekly |
| CPC (cost per click) | Average cost per click | Optimizes bidding and budget allocation | Weekly |
| CPM (cost per thousand impressions) | Cost to show ads 1,000 times | Tracks awareness campaign cost efficiency | Weekly |
| Total spend | Amount spent during reporting period | Monitors budget and ROI | Weekly |
Conversion Metrics
These numbers show if your LinkedIn campaigns deliver real results. Track leads, sales, and revenue to connect every dollar spent to tangible outcomes.
| Metric | What It Shows | How It Helps Clients | Recommended Frequency |
|---|---|---|---|
| Conversions | Actions taken post-click (form fills, downloads) | Measures lead generation | Weekly |
| Conversion rate | Percentage of clicks that convert | Assesses landing page & audience quality | Weekly |
| Cost per conversion | Average spend per conversion | Tracks campaign efficiency | Weekly |
| Conversion value | Total value attributed to conversions | Shows revenue impact | Monthly |
| ROAS (return on ad spend) | Revenue generated per dollar spent | Measures campaign profitability | Monthly |
Audience Metrics
These numbers show if your ads reach the right people. Track demographics, engagement, and exposure to avoid ad fatigue and make sure campaigns hit the right targets.
| Metric | What It Shows | How It Helps Clients | Recommended Frequency |
|---|---|---|---|
| Follower growth | New followers on company page | Indicates brand traction and audience growth | Monthly |
| Engagement rate | Likes, comments, shares per post | Shows ad resonance and audience interaction | Monthly |
| Social actions | Likes, comments, shares on sponsored content | Tracks quality of engagement | Weekly |
| Video views | Completed video views for video ads | Shows engagement with video content | Weekly |
LinkedIn-Specific Metrics
These numbers highlight LinkedIn’s unique features. Track native platform metrics not available on other ad channels to showcase LinkedIn’s distinct impact.
| Metric | What It Shows | How It Helps Clients | Recommended Frequency |
|---|---|---|---|
| Lead form opens | Number of people who opened LinkedIn lead gen forms | Shows interest before conversion | Monthly |
| Lead form submissions | Completed lead gen form submissions | Direct measure of LinkedIn lead gen effectiveness | Monthly |
| Follower growth | New followers gained from campaigns | Indicates growth of LinkedIn-specific audience | Monthly |
| Engagement rate | Likes, comments, shares per post on LinkedIn | Shows platform-specific interaction | Monthly |
| Social actions | LinkedIn-only likes, comments, shares | Highlights unique LinkedIn engagement | Monthly |
| Video views | Completed video views on LinkedIn video ads | Measures content performance on LinkedIn | Monthly |
Calculated Metrics in Looker Studio
Most LinkedIn connectors only pull basic numbers like clicks and spend. Use calculated fields to show meaningful results:
| Metric | Formula |
|---|---|
| CTR (click-through rate) | (Clicks / Impressions) * 100 |
| CR (conversion rate) | (Conversions / Clicks) * 100 |
| CPC (cost per click) | Total spend / Clicks |
| ROAS (return on ad spend) | Conversion value / Total spend |
| CPM (cost per thousand impressions) | (Total spend / Impressions) * 1000 |
LinkedIn Ads Dimensions Agencies Track
LinkedIn’s data gives targeting insights Facebook and Google can’t. Use dimensions like job title, company size, or seniority, paired with metrics like clicks and conversions, to show which decision-makers engage and where your client’s budget performs best.
Campaign Structure Dimensions
Break performance down by LinkedIn’s basic account structure.
| Dimension | What It Shows | How It Helps Clients |
|---|---|---|
| Campaign name | Performance comparison across different campaigns. | Shows which campaign strategies deliver the best results |
| Campaign group | Higher-level grouping of campaigns | Evaluates testing approaches or time periods |
| Ad name | Individual ad creative performance. | Identifies which creatives resonate with target audiences |
| Ad format | Performance by ad type | Shows which formats work best for specific goals |
Professional Targeting Dimensions
Professional targeting dimensions reveal exactly which job titles, company sizes, and seniority levels respond best to your campaigns. Use these insights to refine targeting, optimize budget allocation, and focus on the prospects who deliver the most value for your clients
| Dimension | What It Shows | How It Helps Clients |
|---|---|---|
| Job title | Performance by specific titles | Shows which decision-makers engage |
| Job function | Performance by function (Marketing, IT, etc.) | Refines targeting to valuable roles |
| Seniority level | Entry, Manager, VP, etc. | Highlights which seniority levels convert best |
| Company size | Employee ranges | Shows if campaigns perform better with SMBs or enterprises |
| Industry | Performance across industries | Identifies new markets or confirms target segments |
| Skills | LinkedIn member skills | Refines targeting based on professional expertise |
Geographic and Demographic Dimensions
These dimensions help you understand where your client’s audiences are located and their basic demographic profiles. While less unique than LinkedIn’s professional data, geographic breakdowns are handy for regional campaigns.
| Dimension | What It Shows | How It Helps Clients |
|---|---|---|
| Location | Geographic performance | Reveals top-performing markets |
| Age | Performance by age group | Helps identify engaging demographics |
| Gender | Performance by gender | Useful for gender-targeted campaigns |
Device and Placement Dimensions
These dimensions show you where and how your LinkedIn ads perform across different devices and placements.
| Dimension | What It Shows | How It Helps Clients |
|---|---|---|
| Device type | Mobile vs. desktop | Optimizes creative and bids for preferred devices |
| Placement | LinkedIn feed vs. audience network | Shows best-performing placements |
Time-Based Dimensions
These dimensions reveal when your professional audiences are most active and engaged with your LinkedIn campaigns.
| Dimension | What It Shows | How It Helps Clients |
|---|---|---|
| Date | Daily performance trends | Optimizes timing and budgets |
| Day of week | Best-performing days | Improves scheduling efficiency |
| Hour | Hourly engagement | Fine-tunes campaign timing |
How to Automate LinkedIn Ads Reporting in Looker Studio
Your clients expect updates. Don’t spend Monday mornings copying data from LinkedIn Campaign Manager. Set up automation once, and reclaim hours every week.
Step 1: Automate Data Refreshes
Set automated refreshes to keep Looker Studio reports current. Skip the manual updates every few days and track LinkedIn Campaign Manager performance in real time.
- Open your Looker Studio report
- Go to Resource > Manage added data sources
- Click EDIT on your LinkedIn connector
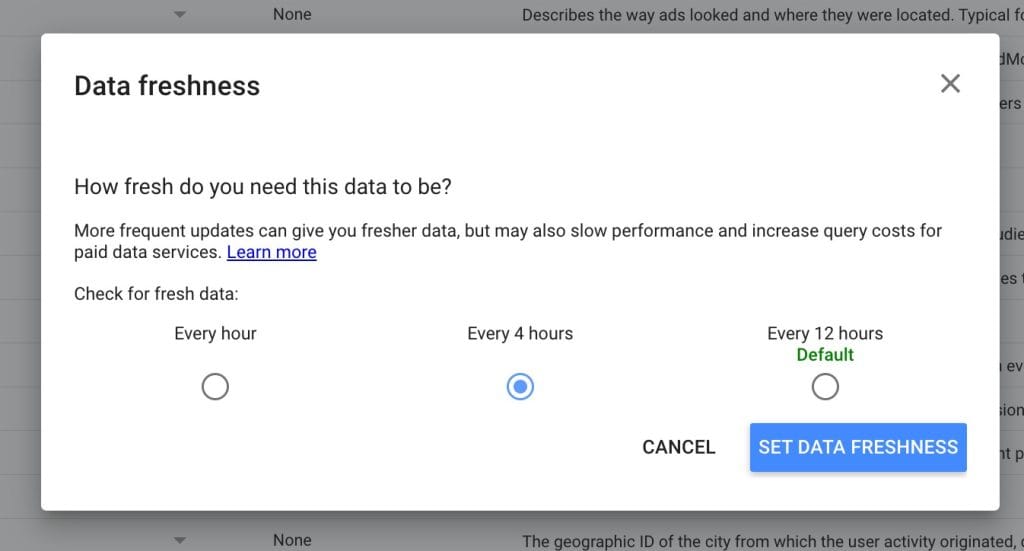
- Navigate to Data freshness settings
- Set refresh frequency (daily for active campaigns, weekly for reports)
- Click SAVE
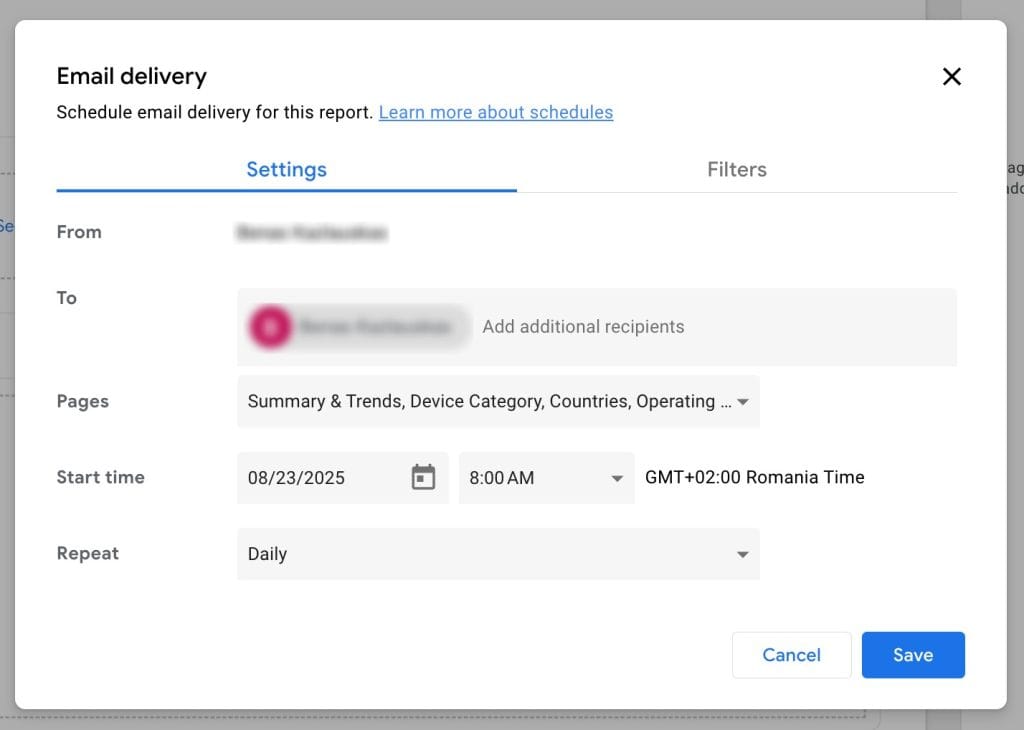
Step 2: Schedule Report Delivery
Save time with automated report delivery. Send a few reports or dozens — let automation handle routine emails and reporting tasks.
- In your report, click the arrow next to Share
- Select Schedule delivery
- Configure timing
- Add client emails
- Set filters if needed
- Click Save
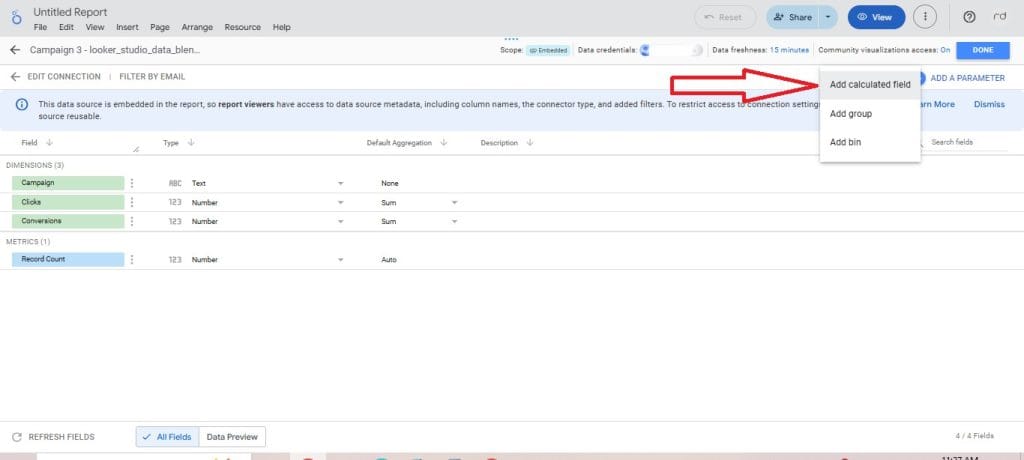
Step 3: Use Calculated Fields
Most LinkedIn connectors pull only basic metrics like clicks and spend. Your clients want advanced calculations — cost per lead, return on ad spend. Calculated fields make this possible.
- Open your report
- Go to Resource > Manage added data sources
- Click + Add calculated field
- Name it (e.g., LinkedIn CPA)
- Enter the formula: Total spend / Conversions
- Set field type to Currency
- Click Save and Done
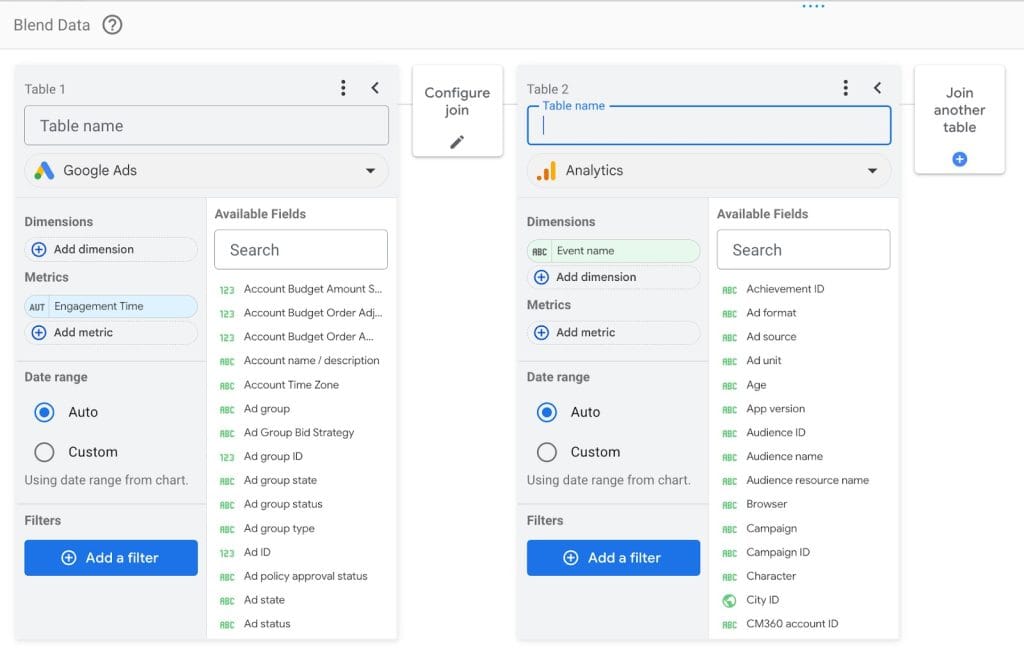
Step 4: Automate Cross-Channel Reporting
Use cross-channel automation to combine LinkedIn, Google Ads, Facebook, and other platforms. See full campaign performance without manually merging data from different sources.
- Go to Resource > Manage added data sources
- Add other sources like Google Ads or Facebook Ads
- Map metrics consistently across platforms (e.g., Cost vs. Spend)
- Click Manage blends > + ADD A BLEND
- Choose your primary data source
- Pick a key dimension such as Date, Campaign name, or Channel
- Add the metrics you want
- Join additional tables as needed
- Click Save
How to Troubleshoot Common LinkedIn Integration Issues
LinkedIn Ads data breaks more often than Google integrations because third-party connectors sit between LinkedIn and Looker Studio. When issues arise, it’s not always obvious whether LinkedIn, the connector, or Looker Studio is at fault. Use these steps to quickly resolve common problems.
Missing or Incomplete Data
When your third-party connector fails or LinkedIn’s API lags, some widgets will show missing data. LinkedIn numbers can take 24–48 hours to finalize. Try these solutions:
- Check and adjust data freshness settings in your connector
- Manually trigger a data refresh through the connector
- Re-authenticate the connector if a Data source error appears:
- Open your Looker Studio report
- Go to Resource > Manage added data sources
- Remove the LinkedIn Ads connector
- Re-add the connector from the list
- Wait for data to load and verify updated numbers
- Confirm your connector subscription is active and hasn’t hit usage limits
Optionally, it’s also good to check if your connector subscription is still active and hasn’t hit usage limits.

Authorization and Permission Errors
These issues happen when LinkedIn permissions change or when you’re mixing personal and business LinkedIn logins. To fix this:
- Re-authenticate your LinkedIn account in the connector settings
- Verify Campaign Manager or Account Manager access for all client accounts
- Clear browser cache and cookies and reconnect
Timeout Issues and Slow Load Times
Your reports can crash or slow down when you’re pulling too much LinkedIn data at once or your connector hits API rate limits. To speed things up:
- Limit date ranges to 60–90 days — LinkedIn’s API handles smaller chunks more reliably
- Review metrics and dimensions in your report, remove anything unnecessary
- Split long reports into pages, performance overview, brand campaigns, non-brand campaigns, and other ad types
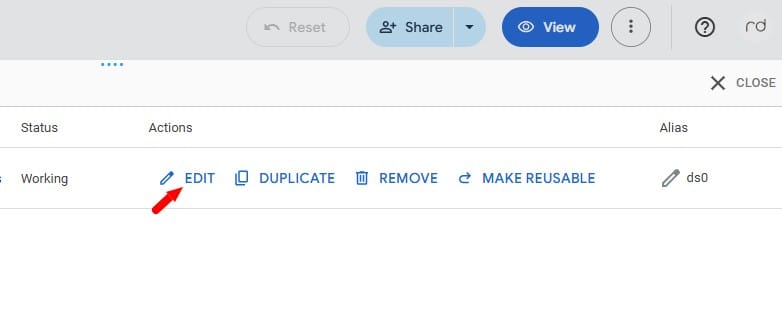
Data Source Not Found Error
Your Looker Studio report was running smoothly until it stops pulling data and shows a Data Source Not Found error. This usually means Looker Studio can no longer access the data feeding your charts or visualizations. To fix this:
- Open your report and go to Resource > Manage added data sources
- Click Edit on the problematic source
- Select Edit Connection or Reconnect
- Re-authenticate the LinkedIn Ads connector if needed
- Refresh fields if the data schema changed
- Check that the data source is attached to all relevant charts; manually assign if necessary
- If the issue persists, disconnect and reconnect the source
Alternative Reporting Options for LinkedIn Ads
If Looker’s built-in features aren’t flexible enough for your agency, explore your options and find the best LinkedIn Ads reporting fit.
Platforms Purpose-Built for Busy Marketing Agencies
Looker Studio works fine for a handful of clients. But once your agency hits dozens of campaigns, its weaknesses become painfully apparent. At that point, you need a tool that scales. Something that handles reporting automatically and keeps clients happy without draining your team.
Swydo is built for this exact problem. It automates LinkedIn Ads reporting, combines data from multiple channels, and delivers polished, presentation-ready reports in minutes. Unlike Looker Studio, you don’t have to wrestle with calculated fields, blends, quota errors, or constant refresh errors.
The platform comes with pre-built templates for PPC, SEO, and other campaigns. Reports update automatically. You can mix LinkedIn with Google Ads, Facebook, email marketing, and more in a single dashboard. No tedious data wrangling. No late nights fixing broken connectors.
LinkedIn Campaign Manager Reporting Tools
Don’t overlook LinkedIn’s native reporting tools. Campaign Manager has some helpful features to offer marketers. You can pull custom reports that only include the LinkedIn Ads metrics your clients actually care about. Download them as CSV and hand them off without extra formatting.
It also delivers smart support where you already work. Performance suggestions. Demographic breakdowns. Benchmarking against similar advertisers. Small touches like these make it easier to explain results to clients.
Prove ROI on LinkedIn the Smart Way
LinkedIn Ads reporting in Looker Studio takes work. Many agencies don’t bother, believing it’s too complicated. But the detailed insights you get from LinkedIn’s professional targeting data is worth the effort.
Here’s what works: find a connector that saves time and avoids constant errors. Third-party tools handle the heavy lifting so your team can focus on strategy, not APIs. They cost money, yes. But when you weigh that against hours saved, they pay for themselves quickly.
You can also use Google Sheets if you don’t mind manual work, but for most agencies, skipping the headaches and choosing a platform built for agencies is the smarter move.
LinkedIn Ads Looker Studio FAQ
Quick answers to the most common LinkedIn reporting questions
No, LinkedIn Ads doesn’t have a native Looker Studio connector like Google Ads. You need either a third-party connector (like Supermetrics or Funnel.io) or manual CSV exports to get your LinkedIn data into Looker Studio reports.
With a third-party connector: 30-60 minutes for initial setup, then reports refresh automatically. Manual CSV method: 15-30 minutes per export, but you’ll repeat this weekly or monthly. The time investment in a connector pays off quickly if you manage multiple accounts.
You need Account Manager or Campaign Manager permissions in LinkedIn Campaign Manager. Viewer access won’t give you complete data. Make sure your client grants proper permissions before starting – this prevents “missing data” issues later.
No, Looker Studio is free with any Google account. However, you’ll likely need a paid third-party connector to get LinkedIn data in efficiently. Free options exist but require manual work that becomes time-consuming at scale.
Yes, Looker Studio reports work on mobile devices through your web browser. However, complex dashboards with multiple charts may be difficult to navigate on small screens. Consider creating simplified mobile-friendly versions for client presentations.
Most connectors start at $25-50/month for basic plans, scaling up to $200-500+ for agencies with multiple clients. Pricing typically depends on data sources, refresh frequency, and number of users. Calculate this against time saved from manual exports.
If you spend more than 5-10 hours monthly on manual exports, a paid connector saves money. Manual exports work for 1-2 accounts but become unsustainable with multiple clients. Connectors also reduce errors and provide real-time data.
Daily for active campaigns, weekly for performance reviews. LinkedIn data takes 24-48 hours to finalize, so don’t expect real-time accuracy. Set refresh frequency based on how often you optimize campaigns and client expectations.
LinkedIn Campaign Manager provides data back to when your account started running ads. However, some third-party connectors have limitations on historical data import. Check your connector’s backfill capabilities if you need extensive historical analysis.
Windsor.ai and Porter Metrics offer good value for smaller agencies with simple setup and reasonable pricing. Supermetrics is popular but can get expensive. Test free trials with your actual client data before committing to any platform.
Yes, use Looker Studio’s data blending feature to combine multiple advertising platforms. You’ll need connectors for each platform, then blend them using common dimensions like date or campaign name. This creates unified cross-channel reports.
LinkedIn’s native reporting works for basic needs and provides unique insights like demographic breakdowns. However, you can’t combine it with other channels or create custom dashboards. Use it for quick checks but invest in external tools for comprehensive agency reporting.
Agency-specific platforms like Swydo, AgencyAnalytics, or DashThis handle LinkedIn data more reliably than Looker Studio. They cost more but include features like white-labeling, client portals, and pre-built templates designed for agency workflows.
Looker Studio offers limited white-labeling – you can add your logo and customize colors. For full white-labeling with custom domains and complete branding control, you’ll need agency-specific platforms like Swydo or similar tools.
Check your LinkedIn permissions first, then verify your connector subscription is active. LinkedIn data takes 24-48 hours to finalize, so recent performance may appear incomplete. Try manually refreshing your data source or re-authenticating your LinkedIn connection.
Data accuracy depends on the connector quality and LinkedIn’s API limitations. Most reputable connectors provide accurate data, but always cross-check important metrics with LinkedIn Campaign Manager for critical client presentations. Minor discrepancies are normal due to data processing timing.
Limit date ranges to 60-90 days maximum and remove unnecessary metrics. Split large reports into multiple pages. If using multiple data sources, check if your connector has hit API rate limits. Large data volumes may require upgrading your connector plan.
Yes, Looker Studio allows scheduled report delivery via email. Set up automated sends for weekly or monthly reports. However, always review data before automatic delivery to catch any connector issues or data anomalies that might confuse clients.
Reputable connectors and Looker Studio generally comply with GDPR and privacy regulations, but verify with your chosen tools. Review data processing agreements and ensure client data isn’t stored inappropriately. Always use business LinkedIn accounts for client reporting.
Some advanced connectors offer CRM integration, but this typically requires custom setup. For basic lead tracking, export LinkedIn lead gen data and import to your CRM manually. Advanced agencies may need specialized tools or custom development for seamless CRM integration.
Skip the LinkedIn connector headaches and build professional client reports in minutes.
Start Your Free Trial Today