
Your agency runs on results — and behind every campaign is the story the data tells. But turning rows of raw numbers into client-ready insights? That’s where your choice of BI tool either helps or hinders.
Whether you build performance dashboards or analyze multi-channel trends, the right data analysis platform can either streamline your reporting or bottleneck it. For most agencies, that choice often comes down to Looker Studio or Power BI.
Both are powerful tools, each built with different strengths. In this guide, we’ll compare them side by side, help you choose the right one for your agency, and offer advice for cases where neither is the perfect fit.
What Are Business Intelligence (BI) Tools?
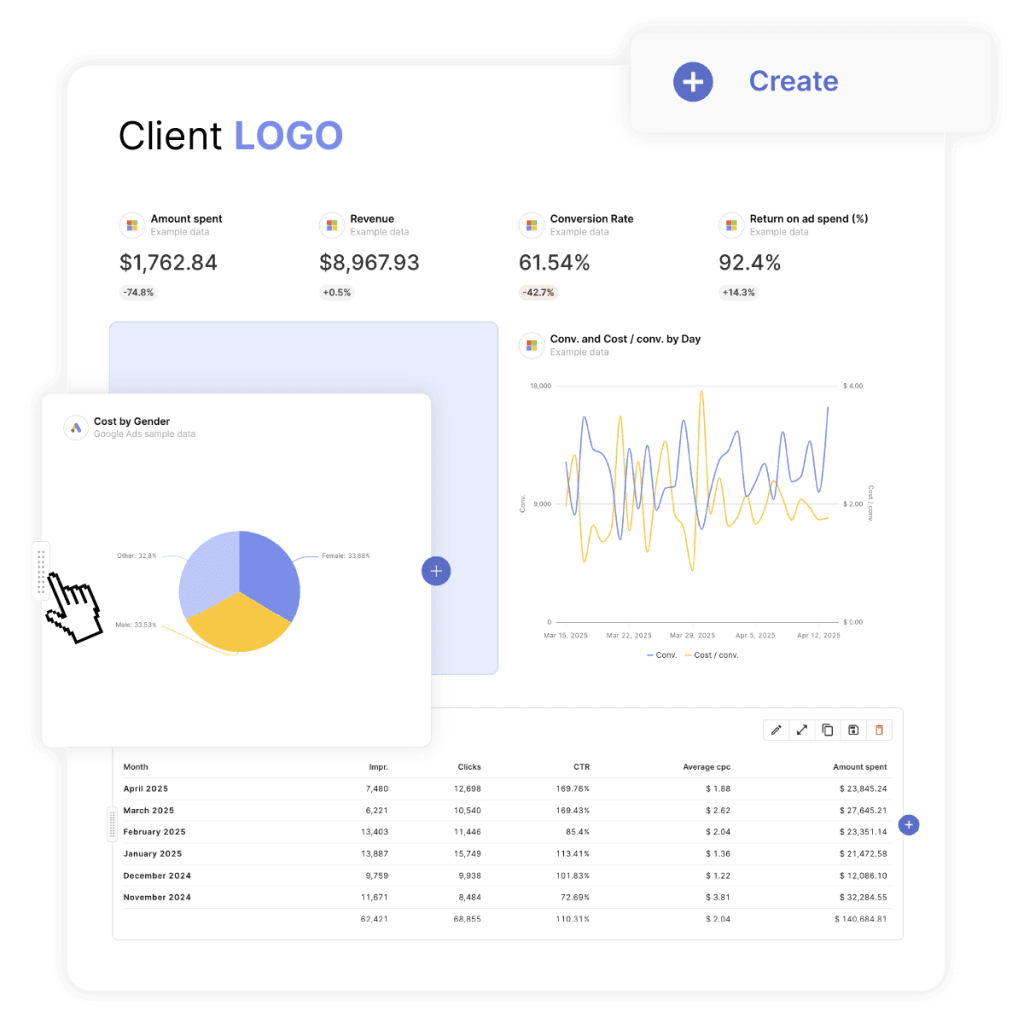
Business Intelligence (BI) platforms are tools that turn messy data into clear insights your team can act on. They transform raw data into visual dashboards and reports.
BI tools are used to track performance, identify trends, and spot quick wins across your marketing channels. For agencies, BI tools also simplify reporting, support data-driven strategies, and improve transparency with clients.
The Most Popular BIs for Agencies
According to user reviews and agency forums, Power BI, Looker Studio, Looker Studio Pro, and Looker Platform (Google Cloud Core) are the most popular BI tools for marketing agencies. Let’s look more in-depth at each one.
Power BI
Power BI is Microsoft’s business intelligence suite, bundling multiple tools under one umbrella. For report creation, Microsoft offers Power BI Desktop; the Power BI Service is for cloud-based sharing and collaboration, and Power BI Mobile tracks performance on the go.
Its strengths lie in strong analytics and flexible data modeling, which are essential for marketing agencies with advanced reporting needs. Power BI also offers integration with Microsoft products like Excel, Azure, and Dynamics 365, making it a great match for agencies that already rely on Microsoft’s products.

Looker Studio (Free)
Looker Studio is Google’s free, web-based data visualization tool built to work seamlessly with Google tools, like Google Analytics and Google Ads. It helps agencies build reports and dashboards based on essential performance metrics.
You can enhance reporting with Looker’s third-party connectors, but most require a paid subscription.
Looker Studio Pro
Looker Studio Pro builds on Looker Studio by adding advanced collaboration tools — like team-based asset management and project-level permissions — enhanced data protection, and dedicated support. Agencies with the Pro subscription also have access to the mobile app, greater control over who sees what, better data protection, and access to Google’s support team. It’s primarily designed for larger organizations that need more control, reliability, and technical support, making it popular with agencies serving large client bases.

Looker Platform (Google Cloud Core)
Looker Platform is Google’s enterprise-grade business intelligence solution. Unlike Looker Studio, it uses LookML, a modeling language that supports advanced data governance, reusable data models, and complex analytics.
The Looker Platform is created for agencies and businesses that need centralized control over data use, tighter security, and the ability to scale up for large teams or clients
How To Pick the Right BI Tool
Both tools offer core BI features — but your agency’s budget, tech skills, and data sources will determine the best fit.
The budget is often a starting point when choosing a reporting tool:
- Looker Studio is free and ideal for small to mid-sized agencies that need basic reporting.
- Looker Studio Pro starts at $9/user/month, billed annually, and offers enhanced features like team workspaces, SLAs, and advanced calculations.
- Looker Platform (Google Cloud Core) is an enterprise-grade BI solution with custom pricing. According to community forums, entry-level costs start around $35,000 per year for the Standard Edition, with higher tiers exceeding $150,000 per year, depending on scale and needed features.
- Power BI Pro starts at $14/user/month, ideal for small to mid-sized agencies that require collaboration and sharing capabilities.The Premium Per User (PPU) plan, starting at $24/user/month, offers advanced features like larger data models and AI capabilities. Power BI Premium Capacity starts at $4,995/month and features dedicated cloud resources.
Power BI’s free tier is called Power BI Desktop.
Data Connectors
Looker Studio and Power BI also support different types of data connections:
Google Looker Studio offers quick, seamless integrations with tools inside the Google ecosystem — especially handy if your marketing stack includes:
- Google Analytics 4
- Google Ads
- Google Sheets
However, keep in mind that Looker Studio’s third-party connectors can cost from just a few dollars to $1,000+ per month, depending on the integration.
Power BI, by contrast, boasts broader connectivity. It supports direct connections to a wide variety of:
- Databases (like SQL Server, MySQL, and PostgreSQL)
- Cloud services (including Azure, AWS, and Salesforce)
- Business applications (such as Excel, Dynamics 365, and more)
Most of these Power BI connectors are free to use, making it a more cost-effective choice for teams that rely on diverse, non-Google data sources.
Skills & Learning Curve
Finally, consider your team’s technical skills. If you need a low-barrier tool that non-technical users can easily pick up, Looker Studio is a better fit. If your agency has the skills — or is willing to invest the time — Power BI opens the door to deeper analysis.
Ease of use matters — especially if your team isn’t made up of data analysts.
- Looker Studio is an intuitive and web-first reporting platform that requires minimal technical skills to get up and running.
- Power BI is more desktop-centric and has a more complicated interface, requiring advanced skills for data connection and report building.
Looker Studio vs. Power BI Comparison Breakdown
Here’s a complete side-by-side comparison of the platforms:
User Experience & Interface
| Tool | Looker Studio | Looker Studio Pro | Looker Platform | Power BI |
|---|---|---|---|---|
| Ease of Use | Intuitive, no-code | Same as the free version with admin tools | Technical knowledge needed, SQL-based | Familiar to Excel users, steep for advanced reporting |
| Visualization & Customization | Easy report building, basic visuals | Custom charts and more layout controls | Highly customizable dashboards with LookML | Extensive visuals, deep customization, custom visuals marketplace |
| Embedding | Simple embedding options | Enhanced embedding with HTML | APIs/SDKs for advanced embedding | Power BI Embedded (Azure PaaS) |
Data Handling Capabilities
| Tool | Looker Studio | Looker Studio Pro | Looker Platform | Power BI |
|---|---|---|---|---|
| Data Connectivity | Google ecosystem, third-party connectors | Same as the free version, with enhanced security | Broad database and cloud connectivity | Range of databases, cloud services, and apps |
| Data Transformation | Basic blending options, calculated fields | Same as the free version | Advanced with LookML modeling | Available with Power Query Editor |
| Data Modeling | Basic, from source | Same as the free version | Centralized data blending | Advanced visualization with DAX |
Collaboration & Sharing
| Tool | Looker Studio | Looker Studio Pro | Looker Platform | Power BI |
|---|---|---|---|---|
| Collaboration Features | Ability to share and download the report | Team workspaces, customizable permissions | API integration | Workspace sharing, Pro license required |
| Deployment Options | Fully web-based | Fully web-based | Cloud-hosted on Google Cloud | Desktop for developing, cloud-based for sharing |
Performance & Scale
| Tool | Looker Studio | Looker Studio Pro | Looker Platform | Power BI |
|---|---|---|---|---|
| Performance | Source-dependent | Source-dependent | Depends on your setup | Fast with data import and visualization |
| Scalability | Performance downgrades with large datasets | Dedicated cloud-based server for improved performance | Easily scalable, can handle complex datasets | Performs well with custom calculations and large datasets |
Enterprise Readiness
| Tool | Looker Studio | Looker Studio Pro | Looker Platform | Power BI |
|---|---|---|---|---|
| Governance & Security | Basic Google account permissions | Enterprise-grade encryption | Strong data governance | Role-based security, Row-Level Security (RLS), certification |
| Support | Community forum | 8/5 support via email | 24/7 phone and email support, technical manager | Community forum, support tickets |
| Pricing | Free | From $9/month per user | Enterprise (custom pricing) | Free, from $14/month per user for first-tier subscription |
Use Looker Studio if Your Agency Needs Quick Startup & Basic Reporting
Looker Studio is a go-to choice for agencies that need to:
- Move fast
- Keep costs low
- Deliver clean, easy-to-understand reports — especially if most of their clients’ data lives within the Google ecosystem
If your agency values speed and simplicity, and you’re already working with Google data, Looker ticks all the right boxes. It’s ready to use — no installs, no steep learning curve. Sharing reports is as easy as working in Google Docs, so you can craft a performance report with just a few clicks.

That said, Looker Studio isn’t built for heavy lifting. Its drawbacks include:
- Performance issues: If you’re working with large datasets or need advanced calculations, you might notice slow load times and even hit errors like, ‘We’re sorry, Looker Studio has run into a problem.’
- Limited features: Looker Studio’s analytics features may not cut it for growing agencies that deeper insights or more flexible data modelling.
- Cost creep: Additional analytics tools to pick up the slack, or third-party connectors for more data sources, can quickly raise costs.
Read our article on all the reasons why Looker Studio is slow and how to fix it.
Use Looker Studio Pro if You Need Collaboration & Admin Control
Looker Studio Pro is designed for agencies and teams that need more than the basics but still value simplicity and thrift. It has the same interface as the free version so you can hop into Pro without any complicated transitions. With a flexible drag-and-drop canvas and access to hundreds of data connectors, marketers can visualize and share deeper insights with their teammates and clients.
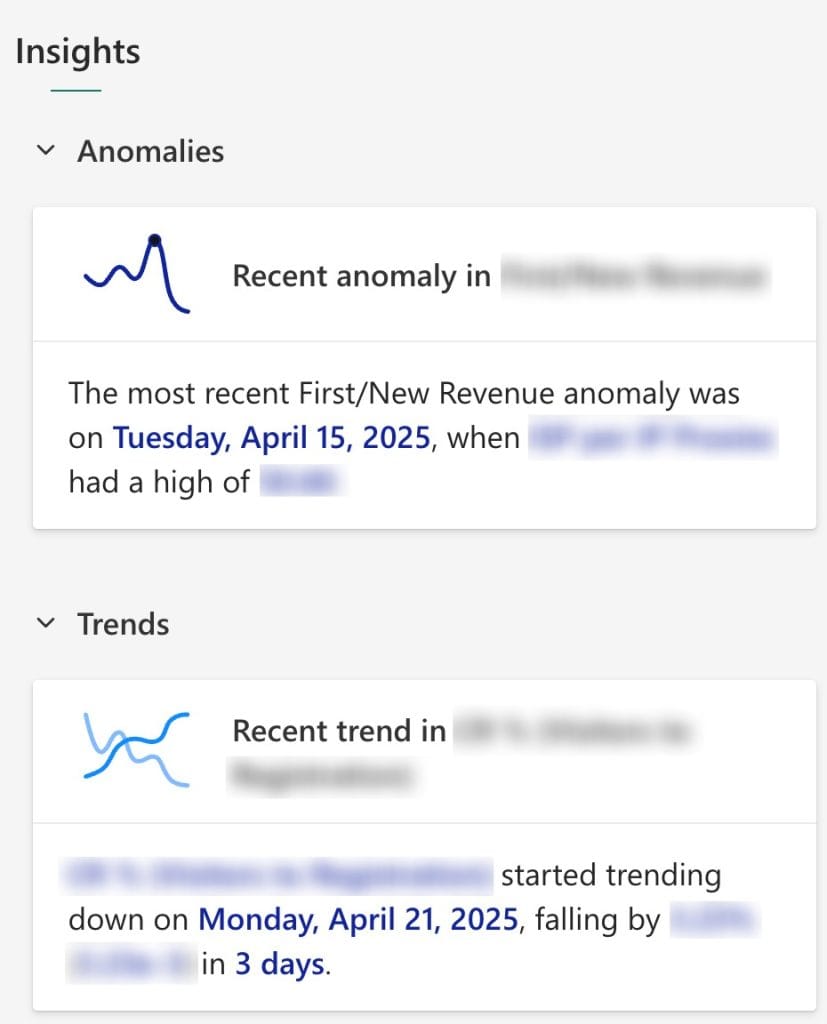
With Google’s Gemini AI built in, Looker Studio Pro allows marketers to ask the AI assistant various performance-related questions and speed up data analysis. From simple queries on top-performing campaigns to advanced anomaly detection, AI-powered data analysis helps agencies zero in on specific insights.

Looker Studio Pro is amazing when you need to bring people together around data. It’s a practical choice for agencies looking to save time on performance tracking and work together on cross-channel reports.
- Team workspaces and real-time collaboration help keep everyone on the same page.
- Automated report delivery keeps clients and teammates updated without the back-and-forth.
However, keep in mind that customization options are limited, and real-time data updates depend on the data source, with refresh rates at around five minutes.
Use Looker Studio Platform if You Need Custom Development or Embed Capabilities
Looker Platform (part of Google Cloud) is a great choice for data-driven agencies that want more than basic dashboards. It’s best if you:
- Need advanced data modeling — with LookML, you can build custom, scalable metrics and dimensions
Want to support complex reporting across multiple clients or departments - Care about strong data governance — control who sees what, down to the field level
- Work with enterprise clients who expect deeper insights and serious scalability
- Already use or plan to use Google Cloud for your infrastructure

However, the learning curve is steep. Here are some potential drawbacks to consider:
- Getting the most out of this reporting platform often means investing hours in mastering LookML or even hiring a dedicated person.
- Complex dashboards can suffer from performance issues if queries or data models aren’t properly optimized.
- Customization, especially for embedded analytics or highly interactive dashboards, often means extra dev work.
Looker Platform offers powerful analytics, but be prepared for a steep learning curve, limited UI flexibility, and a price tag that adds up fast.
Use Power BI if You Need Powerful, Complex Data Analytics
Need more muscle in your reporting? Power BI’s built for agencies that deal with messy, complex data and want to see the full picture fast. If you’re working with complex datasets, need more advanced visualizations, or want to cut time on reporting with AI-driven insights, Power BI helps you make it happen.
- Works well with complex datasets and advanced visualizations
- Pulls everything into one unified, interactive dashboard
- Speeds up reporting with AI tools like natural language Q&A
- Highlights what matters with key influencer analysis and anomaly detection
- Ideal for agencies looking to level up their analytics beyond the basics
- Great match for agencies managing enterprise clients or wrangling data from tons of sources
Power BI isn’t exactly what you would call plug-and-play. While it’s powerful, it’s built with data pros in mind — not everyday marketers. It requires strong data analysis and programming skills, and also comes with higher licensing costs, especially if you need access for multiple users or support for large datasets.
- Steep learning curve — Creating advanced dashboards often means learning DAX (Data Analysis Expressions), Power Query, and data modeling best practices
- User interface can feel clunky — Especially when compared to Google’s slicker, more intuitive design in Looker Studio
- Performance issues with large datasets — Reports can lag unless models are well-optimized and split into smaller chunks
- Licensing isn’t cheap — Power BI Pro starts at $10/user/month, but larger agencies often need Power BI Premium (which starts at $20/user/month or $4,995 per capacity/month) for big data and broader sharing
- Limited collaboration unless you’re on Microsoft — Full feature access often requires tight integration with other Microsoft tools like SharePoint or Teams
If your team doesn’t have strong data skills or dev resources on hand, Power BI may not be worth it.
Transform platform chaos into client-winning insights with data blending.
Can’t Pick Just One BI Tool?
Many marketing agencies don’t stick to just one tool. They mix and match to stay efficient and get the best results without overcomplicating things.
A lot of agencies use Looker Studio (free) to whip up clean, client-facing dashboards with real-time data from Google Ads, GA4, or Search Console. It’s quick, it’s visual, and it works great for high-level overviews. But when they need to go deeper — think multi-channel ROAS or complex attribution — agencies often bring in Power BI or Looker Platform to do the heavy lifting.
Here’s how BI blending might look in practice:
- An agency might build weekly client-facing reports in Looker Studio, but use Power BI internally to analyze ROAS trends across Meta, TikTok, and CRM data — sources that require cleaning, blending, or joining large datasets.
- A data-savvy team could use Looker Platform (via BigQuery) for modeling large data pipelines and applying LookML for scalable metrics definitions — then plug that data into Power BI or Looker Studio Pro for polished dashboard delivery.
- An agency might crunch the numbers in Power BI — pulling data from TikTok, Meta, HubSpot, and their CRM to spot patterns and dig into what’s really driving results. But when it’s time to send updates to clients? They switch to Swydo. It’s built for marketing agencies, so it’s fast, clean, and doesn’t take a developer to use. They just drop in the key metrics, pick a template, and schedule it to send. Clients get exactly what they need — no confusing dashboards, no extra clicks.
By combining tools this way, agencies can control costs, make use of the skills they already have in-house, and avoid stretching one tool to do things it’s not built for.
See if Swydo or Looker Studio is the best client reporting tool for your agency.
Match Your Needs, Nail Your Tools
Choosing the right BI tool depends on your agency’s needs. For quick, straightforward reporting, Looker Studio’s your friend — it’s simple, fast, and works well with Google data. Looker Platform is great for larger agencies dealing with large-scale data modeling and reporting, though it comes with a higher price tag. If you’re dealing with complex data and need deep analysis, Power BI might be the way to go, but be prepared for a learning curve.
No single BI tool is perfect for everyone — in fact, it might not be perfect for anyone. Many agencies find that no one tool covers all bases for them. Combining the right tools for different stages of the reporting and analysis process can often be the best solution. And for the final reporting step, Swydo might just be the perfect fit — it’s built for marketing agencies and designed to make the reporting process as smooth and straightforward as possible. You can try it for free for 14 days and see if it clicks with your workflow.
Looker Studio vs Power BI FAQ
Quick answers to help agencies choose the right BI tool
Neither is universally “better” – each tool has specific strengths:
Choose Looker Studio when you need fast setup, easy-to-learn interfaces, and seamless Google data integration (Analytics, Ads, etc.) at minimal cost.
Choose Power BI when you need powerful data modeling, complex calculations, diverse data source connections, and are willing to invest in the learning curve.
Many agencies actually use both: Looker Studio for client-facing Google-based reports, and Power BI for deeper internal analysis or complex data scenarios.
Looker Studio: Free for the basic version. Third-party connectors can cost $5-1,000+ monthly.
Looker Studio Pro: $9/user/month (billed annually).
Looker Platform: Enterprise pricing starts around $35,000/year.
Power BI Desktop: Free for individual use.
Power BI Pro: $14/user/month for collaboration features.
Power BI Premium: $24/user/month or $4,995/month for dedicated capacity.
The free tiers (Looker Studio and Power BI Desktop) have important limitations in sharing, collaboration, and data handling capabilities.
Ease of use: Looker Studio is more intuitive with a web-based interface. Power BI has a steeper learning curve but offers more analytical power.
Data sources: Looker Studio connects seamlessly to Google products but often requires paid connectors for other sources. Power BI connects to hundreds of data sources at no extra cost.
Performance: Power BI generally handles large datasets better than Looker Studio, which can struggle with complex data.
Customization: Power BI offers deeper customization through DAX, custom visuals, and advanced formatting. Looker Studio provides simpler but more limited options.
Analytics depth: Power BI has more advanced analytical capabilities including AI-powered insights, anomaly detection, and complex data modeling.
There’s no direct native connector between Looker Studio and Power BI, but you can connect them indirectly through shared data sources:
Common database approach: Both tools can connect to the same database (SQL, BigQuery, etc.), letting you build complementary reports.
Data warehouse method: Use a data warehouse as the middle layer. Process data in Power BI, export to the warehouse, then connect Looker Studio to that warehouse.
Export/import workflow: Export Power BI data to Excel/CSV, then import into Looker Studio (though this creates manual steps and isn’t real-time).
Many agencies use both tools independently for their respective strengths rather than trying to connect them directly.
Looker Studio (Free): Basic visualization tool for creating dashboards and reports. Great for simple reporting needs and Google data sources.
Looker Studio Pro ($9/user/month): Adds team workspaces, advanced permissions, enterprise security, dedicated support, and AI-powered analysis with Gemini.
Looker Platform (Enterprise pricing): Google’s advanced BI solution using LookML modeling language. Provides data governance, scalable models, and enterprise features.
Think of them as good/better/best options with increasing power, complexity, and cost. Smaller agencies typically start with free Looker Studio, while enterprise teams often need Pro or Platform features.
Looker Studio reports can be slow for several specific reasons:
Data volume: Looker Studio struggles with datasets exceeding ~100,000 rows, especially in the free version.
Complex calculations: Too many calculated fields or complex blended data can severely impact performance.
Real-time connections: Direct queries to data sources (vs. scheduled refreshes) mean each view loads fresh data.
Too many visualizations: Dashboards with numerous charts on a single page create multiple simultaneous data requests.
To improve speed: simplify reports, pre-aggregate data, reduce the number of date ranges, limit the use of complex calculations, and split large reports into smaller dashboards.
Looker Studio works best with these data sources:
Google ecosystem: Google Analytics 4, Google Ads, Search Console, YouTube Analytics, Google Sheets, and BigQuery connect natively and seamlessly.
Database connectors: MySQL, PostgreSQL, and Amazon Redshift have native connectors without additional costs.
File uploads: CSV and Excel files work well for smaller datasets or offline data sources.
Partner connectors: For non-Google platforms (Facebook, TikTok, LinkedIn, etc.), third-party connectors from Supermetrics, Windsor.ai, or similar are available but typically require paid subscriptions.
Google-sourced data provides the best experience in terms of setup simplicity, refresh reliability, and cost-effectiveness.
Yes, Looker Studio Pro includes Google’s Gemini AI integration that offers:
Conversational analytics: Ask questions about your data in natural language (“What were our top-performing campaigns last month?”)
Automated insights: AI can identify patterns, anomalies, and trends that might not be immediately obvious.
Predictive analysis: Get forecasts and projections based on historical data patterns.
Report building assistance: AI helps suggest appropriate visualizations and metrics based on your data.
These AI features are only available in the Pro version ($9/user/month), not the free version of Looker Studio. They’re particularly helpful for speeding up data analysis and uncovering insights that might otherwise require manual exploration.
Free Looker Studio has several significant limitations:
Performance issues: Struggles with large datasets and complex calculations, often resulting in timeouts or errors.
Data connector costs: While the tool is free, many third-party data connectors cost $20-1,000+ monthly.
Limited data blending: Basic joining capabilities only, with restrictions on complex multi-source blending.
No team management: Lacks workspaces and advanced permission controls for agency teams.
No embedded analytics: Limited options for embedding reports in client websites or portals.
No phone support: Only community forums for troubleshooting issues.
No AI features: Gemini AI capabilities are only in the Pro version.
For simple Google data reporting, these limitations might not matter. For complex analytics or enterprise needs, they often become problematic.
Yes, Power BI Desktop is completely free but has important limitations:
Local use only: You can build reports but can’t easily share them with clients or team members.
No cloud publishing: Cannot publish to the Power BI Service without a Pro license.
No collaboration: No shared datasets or workspaces for team collaboration.
Manual refresh: No scheduled data refreshes; data must be updated manually.
Size limits: Dataset size is capped at 1GB.
Power BI Desktop is excellent for learning the tool or for individual analysis, but most agencies need Power BI Pro ($14/user/month) for client reporting and team collaboration.
Learning Power BI follows this typical timeline:
Basic proficiency (2-4 weeks): Creating simple reports, connecting to common data sources, and using basic visualizations.
Intermediate skills (1-3 months): Data modeling, creating calculated columns and measures with DAX, and building more complex reports.
Advanced mastery (6+ months): Complex data modeling, advanced DAX formulas, performance optimization, and creating custom visuals.
The learning curve is steeper than Looker Studio but shallower than traditional BI tools like Tableau. Previous experience with Excel (especially formulas and PivotTables) significantly accelerates learning. Microsoft offers excellent free training resources through Microsoft Learn and YouTube tutorials.
Yes, Power BI can connect to Google services in several ways:
Official connectors: Power BI has native connectors for Google Analytics 4, Google BigQuery, and Google Sheets.
Third-party connectors: Solutions like Supermetrics for Power BI enable Google Ads, YouTube, and other Google platform connections (additional cost).
API connections: Custom connections can be built using Google APIs and Power Query.
Data export method: Export Google data to BigQuery or Google Sheets first, then connect Power BI to those sources.
While these connections are possible, they’re generally not as seamless as using Looker Studio with Google services. Setting up Google connections in Power BI often requires more technical configuration and sometimes additional costs.
Yes, Power BI has robust AI capabilities including:
Q&A natural language: Type questions about your data to get instant visualizations.
Key influencers analysis: Automatically identify factors driving specific metrics or outcomes.
Anomaly detection: Find outliers and unusual patterns in time-series data.
Smart narratives: Generate automatic written summaries explaining data insights.
Decomposition trees: Drill down into data across multiple dimensions to find root causes.
AI-driven forecasting: Predict future values with confidence intervals.
Copilot integration: Create and modify reports using natural language prompts.
Most basic AI features are available in Power BI Pro, while more advanced capabilities might require Premium licensing. These AI tools can significantly speed up analysis and uncover insights that might be missed with manual exploration.
DAX (Data Analysis Expressions) is Power BI’s formula language for creating calculated measures and columns. It’s crucial because:
Custom calculations: DAX enables complex metrics like year-over-year growth, weighted averages, or custom KPIs not available in raw data.
Data transformations: Create conditional calculations, time intelligence formulas, and complex filtering logic.
Business logic: Implement specific business rules and definitions directly in your reports.
Advanced analysis: Build recursive calculations, statistical measures, and sophisticated ranking systems.
While basic Power BI reporting is possible without DAX, unlocking the tool’s full analytical power requires learning at least fundamental DAX concepts. The syntax resembles Excel formulas but with important differences in how context and relationships work. This learning curve is one reason some agencies with simpler needs prefer Looker Studio.
Agencies should choose Looker Studio when:
Google data dominates: Their reporting primarily involves Google Analytics, Google Ads, Search Console, or YouTube data.
Budget is tight: Free or low-cost solutions are a priority, especially for smaller agencies or startups.
Quick implementation: They need to launch client reporting quickly without extensive training.
Simple reports suffice: Their reporting needs are straightforward without complex data modeling requirements.
Non-technical users: Report creators have marketing backgrounds rather than data analytics expertise.
Collaborative editing: Multiple team members need to easily edit reports together like Google Docs.
Looker Studio excels for agencies that value simplicity, speed of deployment, and seamless integration with Google’s marketing ecosystem.
Agencies should choose Power BI when:
Data complexity: They need to blend multiple data sources or handle large datasets (500,000+ rows).
Advanced analytics: Requirements include sophisticated calculations, statistical analysis, or AI-driven insights.
Microsoft ecosystem: They already use Microsoft products like Excel, SharePoint, or Dynamics 365.
Diverse data sources: They need to connect to many non-Google platforms without paying for multiple third-party connectors.
Enterprise security: They require row-level security, audit trails, or other enterprise governance features.
Offline capabilities: They need to develop reports offline or in environments with limited connectivity.
Embedded analytics: They plan to embed reports in custom applications or client portals.
Power BI is better suited for agencies with more complex data needs, technical resources to leverage its power, and clients expecting sophisticated analytics.
Yes, small agencies can use Power BI effectively by:
Starting small: Begin with Power BI Desktop (free) to develop expertise before committing to Pro licenses.
Focused licensing: Purchase Pro licenses ($14/month) only for team members who create reports, not for everyone.
Leveraging templates: Use pre-built templates and report designs to save development time.
Phased implementation: Start with basic reporting and gradually add complexity as team skills develop.
Free training: Utilize Microsoft’s extensive free learning resources rather than paying for courses.
Small agencies often find that Power BI’s initial learning curve is offset by long-term benefits: reduced time spent on manual reporting, higher-value insights, and the ability to service larger clients with more complex needs.
Agencies can effectively use both tools together with these strategies:
Tiered reporting approach: Use Looker Studio for client-facing dashboards with Google data, while leveraging Power BI internally for deeper analysis and complex data modeling.
Client preference-based: Offer both options and let clients choose their preferred platform based on their own tech stack and needs.
Data complexity separation: Use Looker Studio for straightforward metrics and Power BI for complex calculations involving multiple data sources or advanced modeling.
Specialization by team: Have marketing teams use familiar Looker Studio while data analysts leverage Power BI’s advanced capabilities.
Migration pathway: Start clients with simple Looker Studio reports, then graduate them to more sophisticated Power BI analytics as their needs evolve.
This blended approach allows agencies to leverage the strengths of both platforms while minimizing their respective weaknesses.
For agencies who find neither tool ideal, these alternatives are worth considering:
Tableau: Powerful visualization tool with an excellent interface but higher cost. Great for agencies prioritizing highly polished, interactive reports.
Domo: Cloud-based BI platform with excellent mobile capabilities and user-friendly interface. Strong choice for executive dashboards.
Qlik Sense: Associative analytics engine with unique data exploration capabilities. Ideal for discovering unexpected insights in complex data.
Sisense: Handles extremely large datasets and complex calculations efficiently. Good for agencies with massive data requirements.
Agency-specific tools: Purpose-built marketing reporting platforms like Swydo, DashThis, or AgencyAnalytics offer simpler, marketing-focused alternatives with pre-built templates and connections to common marketing platforms.
These specialized marketing reporting tools often provide the best balance of functionality and ease of use for agencies focused primarily on campaign reporting rather than deep data analysis.
Tired of complex BI tools? Swydo simplifies client reporting with marketing-focused dashboards and data integration.
Start Your Free Trial Today