
Your client asks the question every account manager has heard a thousand times. “Should we be doing SEO or PPC?”
The honest answer is neither. It’s both, and a third thing your client hasn’t heard of yet.
This guide is for the agency person who has to answer that question on a Monday call and then prove it on Friday’s report.
What Changed About SEO vs PPC?
The SEO vs PPC debate used to be about timeline and cost. SEO was the long game, PPC was the fast game, and the smart answer was always “do both, weight it by stage.” Every article on the SERP still ends with that bow.
That framing isn’t wrong. It’s just incomplete now.
Three things broke the old comparison.
AI Overviews compressed the value of ranking #1. Ahrefs analyzed 300,000 keywords from Google Search Console and found that when an AI Overview appears, the click-through rate for the #1 organic position drops by 58%. Pew Research’s July 2025 study found only 8% of users click any traditional result when an AIO is present, versus 15% without one.
The new search reality
What AI Overviews actually did to clicks
58%▼
CTR drop on #1 organic when AIO appears
Source: Ahrefs, 300k keywords
8%
Users who click any traditional result when AIO is present (vs 15% without)
Source: Pew Research, July 2025
+91%▲
More paid clicks for brands cited inside an AI Overview
Source: Seer Interactive
Paid CTR dropped alongside it. Seer Interactive’s analysis of AIO impact on click-through rates surfaced the part nobody’s reporting on yet — brands cited inside an AI Overview earn 35% more organic clicks and 91% more paid clicks than brands that aren’t.
Performance Max and AI Max blurred the line between SEO and PPC. Optmyzr’s study of 503 Google Ads accounts found 91.45% had keyword overlap between Search and Performance Max campaigns. Your “PPC” channel now bids on terms your “SEO” content ranks for, and neither lever is fully under the agency’s control.
Your client isn’t asking “SEO or PPC” anymore. They’re asking “what am I actually paying for, and how do I know it’s working?”
That’s the article. Not a comparison. A measurement system.
What SEO and PPC Each Still Mean (With the Footnotes)
Quick definitions, because new readers deserve a clean baseline.
SEO (Search Engine Optimization) means earning visibility in search results without paying for placement. Technical optimization, content, internal linking, backlinks, schema. Today it also means earning citations in AI Overviews, AI Mode, ChatGPT, Perplexity, and Gemini — a discipline some people call GEO (generative engine optimization) or AEO (answer engine optimization).
PPC (Pay-Per-Click) means buying visibility. You pay each time someone clicks your ad. It mostly covers Google Ads, Microsoft Ads, and the major paid social platforms. Today it also means handing significant control to AI. Performance Max picks the placements, AI Max for Search picks the matching, Smart Bidding picks the bids.
The textbook comparison still holds. SEO is slower, compounds, costs labor more than dollars. PPC is faster, scales linearly with budget, generates real-time market data. Here’s the standard view of how the two differ.
What’s new is the third column.
AI Visibility means being cited inside AI-generated answers — Google’s AI Overviews and AI Mode, ChatGPT search, Perplexity, Gemini. It’s not SEO and it’s not PPC. It has its own ranking signals (entity associations, original data, fact density, schema), its own measurement metrics (citation share, mention share, AI-referral traffic), and its own ad layer is just beginning to form.
If your agency is still selling clients a two-channel model, you’re missing the channel where attention is actually moving.
When PPC Genuinely Beats SEO as the Primary Investment
Time to do something most articles on this SERP dodge. Name the cases where one channel really does win, and stop pretending it always “depends.”
Lead with PPC when:
- You’re launching a new product in a category with no search volume yet. SEO needs queries to rank for. If nobody’s searching, you have to create demand — Google Ads, Demand Gen, paid social.
- You’re running a flash campaign or seasonal promotion that ends before SEO could even index. A 14-day Black Friday push doesn’t wait for a sitemap crawl.
- You operate in a $7–$9 CPC vertical with a 24+ month SEO moat. WordStream’s 2025 Google Ads Benchmarks pulled data from 16,446 US campaigns and found Attorneys & Legal Services average $8.58 per click and $131.63 per lead — the highest in the dataset. If your client is a personal-injury firm in Houston, paid is the runway while SEO is the build.
- You’re a post-funded startup that needs growth signals this quarter. Boards want curves. PPC produces curves. SEO produces flat lines for two quarters and then a curve.
- You’re geo-fenced. A locksmith in three zip codes can’t out-content the national directories. Paid is the cleaner path.
Lead with SEO when:
- Your audience uses ad blockers heavily — developer tools, privacy-focused software, technical buyers.
- You sell into an advisory category where users distrust ads — financial services, healthcare, legal information (informational queries, not commercial).
- Your CPCs sit above $40 and the average lifetime value can’t support the math.
- You’re an established brand with domain authority and informational-intent volume that would be prohibitively expensive to buy. Neil Patel’s analysis of 119 businesses with revenue over $10M found 1,000 SEO visitors cost $217 and produced $1,767 in revenue (8.13× ROAS), while 1,000 PPC visitors cost $3,493 and produced $14,094 (4.04× ROAS).
The honest read on that dataset. PPC produced more absolute revenue per 1,000 visitors. SEO produced more revenue per ROAS dollar spent. Which one matters depends on whether your client has unlimited budget (rare) or a fixed budget (common). For agencies, the question is almost always efficiency, which means SEO usually wins the marginal-dollar argument once the asset is built.
Sounds good?
Now the harder question — how do you prove any of this when the client only sees the report?
Why the SEO vs PPC Report Your Agency Sends Is Probably Broken
Most agencies report on SEO and PPC in two separate decks. The SEO PM sends a Search Console plus rank tracker summary. The PPC PM sends a Google Ads plus Microsoft Ads summary. The client gets two PDFs and is expected to reconcile them.
That’s not reporting. That’s homework.
It also produces three predictable client complaints.
- “My CPC is up but I’m not sure if my SEO improved.”
- “You said we rank #1 — why aren’t we getting more traffic?”
- “What is this actually costing me per lead, all-in?”
The fix isn’t a better PDF. It’s a different scorecard that maps to what clients actually want in a KPI report.
The Blended Search Scorecard — A Measurement Model for SEO + PPC + AI
Steal this framework. I’ll walk through it as a model first, then as a Swydo build.
The Blended Search Scorecard has three layers.
Layer 1 — Capture. What share of total search demand are you converting into clicks across paid and organic combined?
Layer 2 — Compete. What is your share of the visible SERP — paid position plus organic position plus featured elements — for the queries that matter?
Layer 3 — Cite. What share of AI-generated answers (AI Overviews, AI Mode, ChatGPT, Perplexity) mention or link to your brand?
Each layer has two or three metrics. Together they tell one story. Here’s what you’re winning, here’s what you’re losing, here’s where the next dollar should go.
Capture Metrics
- Blended cost per conversion. Total paid spend across search platforms divided by total search conversions. This is the single conversion metric most clients want and almost no one reports cleanly across engines.
- Blended ROAS. Total revenue from search divided by total search investment.
- Search-driven pipeline contribution. Percentage of pipeline (or revenue, for ecommerce) sourced from any search channel.
Compete Metrics
- Impression share (paid). From Google Ads and Microsoft Ads — how often your ad showed when it was eligible.
- Visibility share (organic). Share of voice from a rank tracker used in SEO performance tracking like Semrush, SE Ranking, or AccuRanker for your tracked keyword set.
- SERP real estate ownership. A composite — for your top 50 commercial keywords, what percentage of SERPs do you appear on with any combination of paid ad, organic listing, AI Overview citation, or pack feature?
Cite Metrics
- AI Overview triggered keywords. From Semrush data inside the report — how many of your tracked keywords now trigger an AIO.
- AI Overview presence. How many of those AIOs cite your domain.
- AI-referral traffic to GA4. Sessions from ChatGPT, Perplexity, Gemini, and Copilot tracked as AI traffic in GA4.
That’s nine metrics across three layers. It’s the scorecard the rest of this article builds.
The Blended Search Scorecard
Three layers. Nine metrics. One report.
LAYER 1
Capture
What share of demand are you converting?
LAYER 2
Compete
What share of the visible SERP do you own?
LAYER 3
Cite
What share of AI answers mention your brand?
How to Build the Blended Search Scorecard in Swydo
Time to show you the wiring.
Step 1 — One report, not two.
Open the Template Gallery and start from the Google Ads + Microsoft Ads + GA4 + Semrush template. The point of starting blended is forcing yourself to put one number — blended Cost/Conv. — on the cover page.
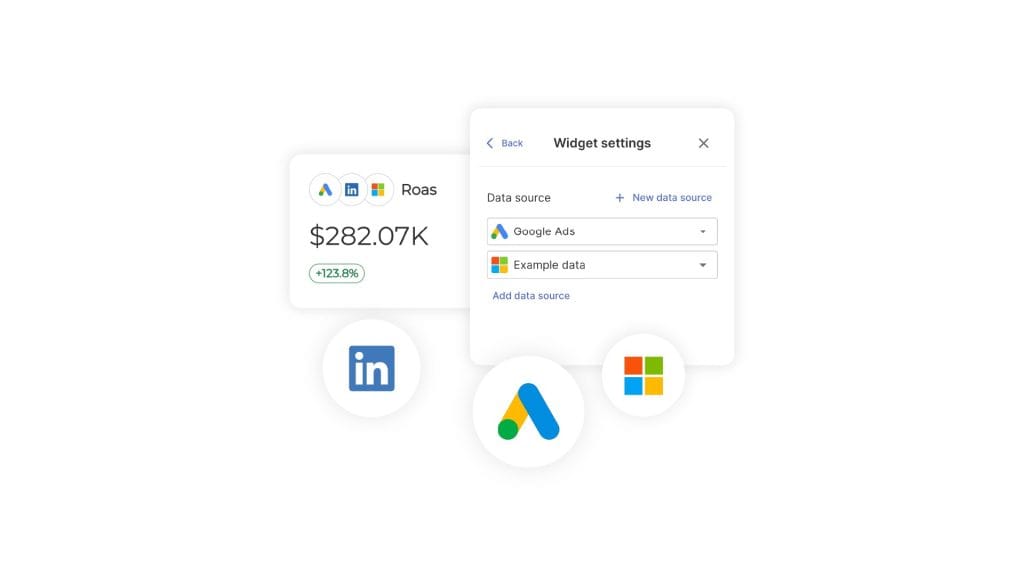
Step 2 — Blend paid sources in a single widget.
For the Capture layer, the Combined Data Sources widget is the mechanism. Plug Google Ads + Microsoft Ads into one chart so Cost, Clicks, Conversions, and Cost/Conv. show up as one trend — not two adjacent charts the client has to add up in their head. That blended Cost/Conv. is your single “what does a search lead actually cost” number across both engines.
You can blend up to five ad platforms in a single widget — Google Ads, Microsoft Ads, LinkedIn Ads, Meta, TikTok, Pinterest, Snapchat, X, Reddit. For the SEO vs PPC scorecard specifically, the Google Ads + Microsoft Ads blend is non-negotiable. You can’t claim to report on “search” if Bing isn’t in the chart.
Step 3 — Add the Compete layer.
Pull in Google Search Console for organic clicks and impressions, then layer Semrush for ranking distribution and share of voice. Microsoft Ads impression share goes in next to Google Ads impression share so the client sees coverage on both engines.
For SERP real estate, build a Table widget keyed to your top 20–50 commercial keywords with columns for organic position, paid position, AIO presence, and a composite “SERP coverage” score you calculate in Google Sheets and pull in via the integration.
Step 4 — Add the Cite layer using Semrush’s AI Overview metrics.
Most reporting platforms don’t expose this metric yet. The Semrush integration surfaces AI Overview and AI Overview Keyword Triggered as widget options — drop them into a KPI scorecard so the client sees “187 of your tracked keywords now trigger an AI Overview; you’re cited in 23 of them.”
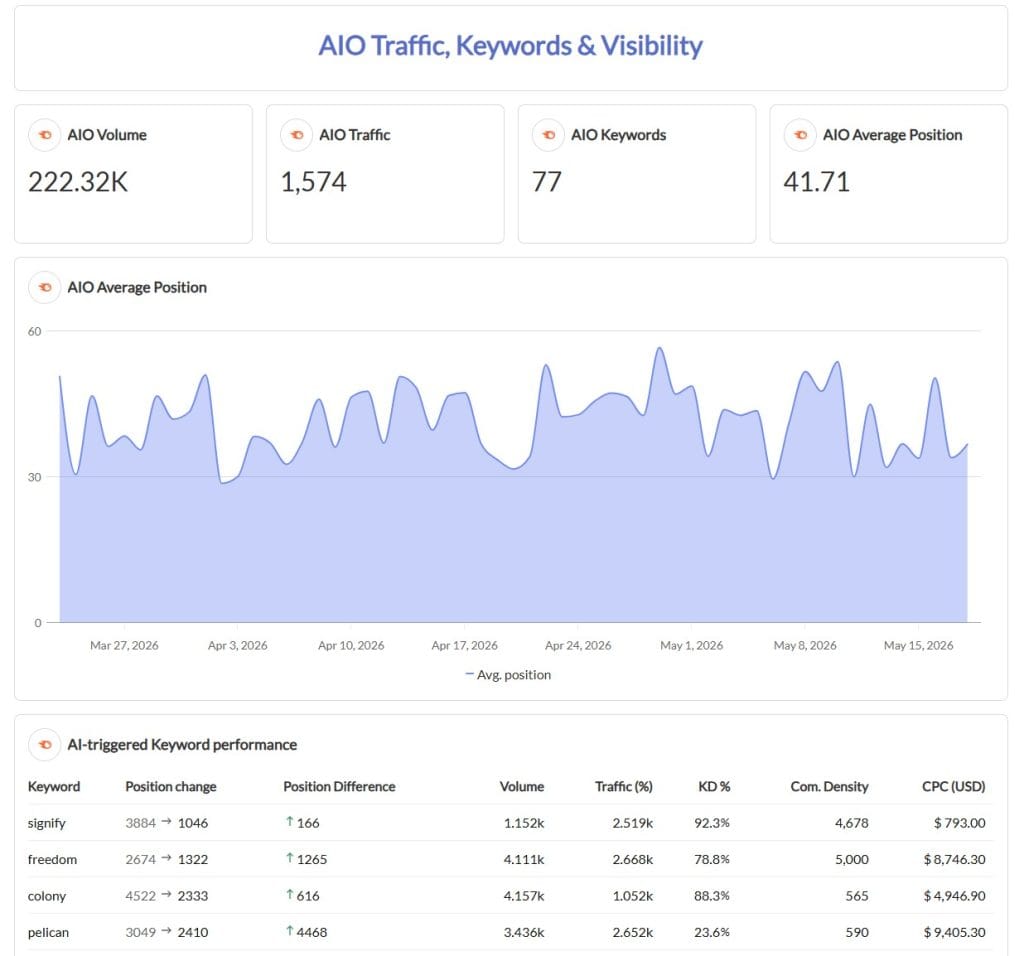
Add a GA4 widget filtered to AI referral sources to round out the Cite layer with actual session and conversion data, not just visibility data.
Step 5 — Write the executive summary once.
Open Swydo AI in the report header and run the Summary prompt. It pulls the numbers across all three layers and produces a 3–5 sentence narrative — “Blended Cost/Conv. is down 14% this period. Paid impression share is steady at 62%. AI Overview presence increased from 9 to 23 keywords.” You edit the language to taste. The math is already done, and the framework follows the standard rules for a good marketing executive summary.
That’s the build. Three layers, nine metrics, one report.
A Note on Long-Horizon Comparisons
One detail worth flagging before we move on. SEO and PPC report on different time horizons. PPC moves in days. SEO moves in quarters. A standard “this month vs. last month” comparison flatters PPC and starves SEO of credit.
Swydo lets you compare date ranges of different lengths — click the lock icon next to the comparison end date in the date-range picker and you can compare Q4 (3 months) against YTD (9 months), or this fiscal year against last fiscal year regardless of length. That’s the setting that gives an SEO program room to look like the asset it actually is on a monthly client report.
The Integration Playbook — What to Actually Do Once You’re Reporting Blended
Reporting on a unified search strategy is the easy part. Running one is harder. Here are the integration moves every agency should standardize.
Use PPC search-term data to prioritize SEO content.
This one’s old but underused. The “search terms” report in Google Ads is the cleanest signal you have of commercial-intent queries that produced revenue. Pull the top 200 converting queries quarterly and hand them to the SEO team as a content priority list. Don’t guess at keyword research — pay-to-play has already told you what converts. Tracking conversions cleanly first requires the right set of PPC metrics in place.
Exclude SEO-dominant terms from PPC bidding selectively
The rule most agencies get wrong. “If we rank #1 organically, stop paying for the click.” Google’s own research disagrees, but with nuance. Google’s incrementality study found that 89% of the visits from search ads are not replaced by clicks on organic search results when an ad is paused. The followup study breaks it down by organic rank. Even when an advertiser ranks #1 organically, about 50% of paid clicks are incremental. At ranks 2–4, 82% are incremental. At rank 5+, 96% are incremental. Search Engine Land covered the methodology and implications in detail when the followup was published.
Google incrementality research
% of paid clicks that are incremental, by organic rank
If you pause ads, this is the share of paid clicks you’d lose — not recover organically.
Source: Google ad incrementality research, summarized via Search Engine Land
The takeaway. Stop blanket-pausing paid spend on terms you rank for organically. Pause it selectively on informational queries where the searcher is likely to grab whichever blue link looks credible (often the #1 organic when it’s a known brand). Keep it on commercial-intent queries where a competitor’s ad above your organic listing will steal half your clicks anyway.
Run real brand-bidding incrementality tests
The “should we bid on our own brand?” debate goes on forever because nobody runs the test. Run it. Geo-split your markets, pause brand-bidding in half, and measure the organic recovery rate after 30 days. If organic recovers under 80% of the lost paid clicks, keep bidding. If it recovers over 95%, redirect the budget.
This isn’t a Swydo step — Google Ads experiments and a clean GA4 setup do the testing. But the result lives in your report afterwards as a Manual KPI. “Brand bidding holdout test, Q1: 73% organic recovery → recommend continuing brand bidding.” That’s the kind of artifact that fits inside a serious marketing measurement practice and keeps an account.
Defend Search from Performance Max cannibalization.
If you run both Search and Performance Max, add brand-term negatives at the campaign level, use the search-term insights view, and review the channel performance breakdown. Most agencies are bidding against themselves and reporting the wrong attribution.
Optimize content for AI Overview citations, not just rankings
This is the discipline some people call GEO or AEO. The patterns that work, based on what gets cited.
- A direct answer in the first 40–60 words of the page.
- Original data, surveys, or research (the single most-cited content type in LLMs).
- Strong schema — FAQPage, HowTo, Product.
- Entity associations through Wikipedia, Wikidata, and named-expert authorship.
- Fact density — concrete numbers, specific dates, attributed quotes.
Becky Simms, Founder and CEO of Reflect Digital, put the integration philosophy clearly in her interview with us during the brightonSEO speaker series. “My talk at brightonSEO is about the fact that your customer does not care which channel they find you on — which means we should stop being so hung up on our favorite channels and instead look at a more integrated approach. I see it happen all the time, specialists fall in love with their channel but forget that part of making their channel more successful is often working closely with other channels.”
That philosophy is the playbook. The reporting is how you prove you’re running it.
Budget Allocation — A Stage-by-Stage Decision Matrix
Agencies ask “what’s the right SEO/PPC split?” and the honest answer is it depends on what stage your client is in. Here’s the matrix I’d use as a starting point. Treat the percentages as opening positions for a conversation, not laws.
$3–10K/month
$10–50K/month
$50K+/month
high-CPC vertical
geo-fenced
dev tools, privacy
Run that matrix against your client roster on a Sunday afternoon. You’ll find at least two clients whose split is wrong by 20+ points. That’s a real conversation to have on Monday.
How to Monitor a Blended Search Strategy Between Reports
A monthly report is a postmortem. By the time the client opens the PDF, the month is gone. The agencies that keep client renewals high are running monitoring in parallel to reporting — daily checks, automatic alerts, and a team dashboard the AM can glance at before the standup.
Build A Monitoring Board Per Client
Open Monitoring → Boards → +New Board. Pin the nine Blended Search Scorecard metrics. The board is internal — your team’s mission control for that account. Use Present mode for stand-ups. Download the scrollable PDF if the client occasionally asks for an interim view.
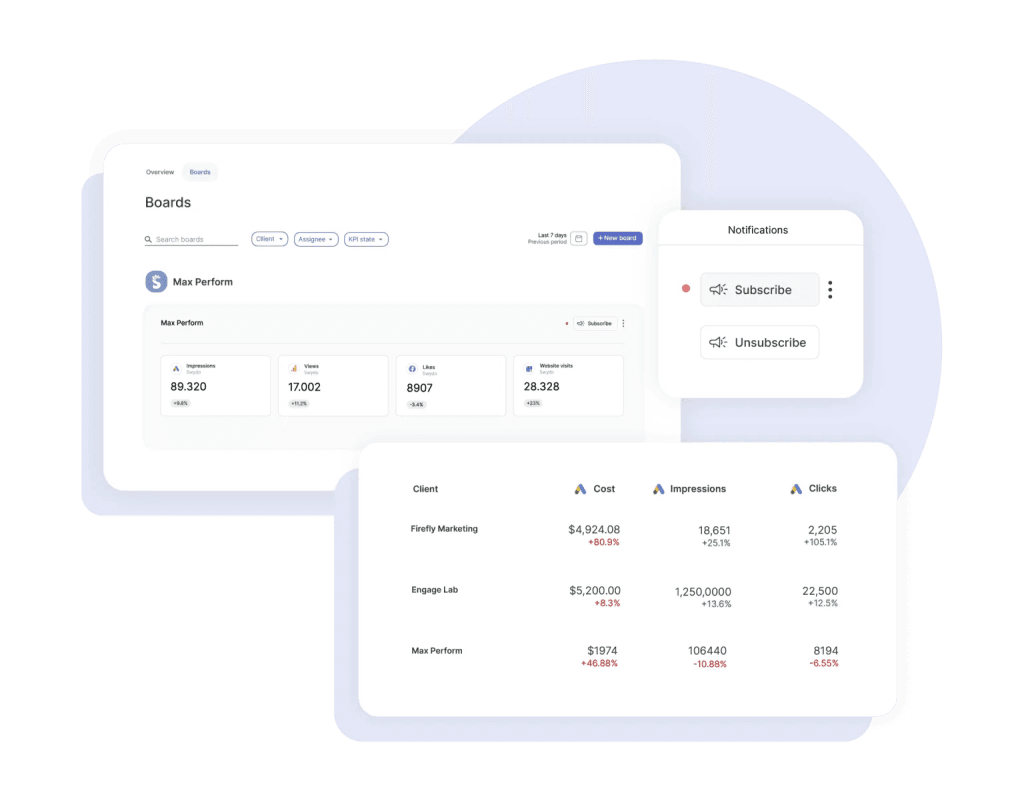
Use Metrics Overview To Spot Whole-Portfolio Drift
Metrics Overview shows up to six metrics across all your clients at once. Pin blended Cost/Conv. from your Combined Data Sources widgets — Combined sources started feeding Metrics Overview earlier this year, so it’s the same number that’s on the cover page of every client’s report. The moment one client’s Cost/Conv. drifts above the median for two periods, you know which account needs attention without opening 23 reports.
Set Alerts On Leading Indicators, Not Lagging Ones
Most agencies set up monitoring wrong. They alert on cost — a lagging metric. By the time daily cost has spiked, you’ve already burned the budget. Alert instead on CPC drift (Google Ads + Microsoft Ads, 7-day vs. previous 7-day), impression share lost to budget (an early warning that you’re capacity-constrained), organic position drops on tracked commercial keywords, and connection-health failures on any data source. Swydo runs a Data Health Check daily and flags broken tokens before they break a Friday report.
Open Monitoring → Alerts → +New Alert. Pick the client, pick the metric, set a 7-day trigger window (sharper than daily, less noisy than monthly), route to Slack and email. The Slack ping is the one that actually gets read.

Add a Goal for the One Metric the Contract Is Built On
If the SOW says “drive blended Cost/Conv. to under $80 by end of Q3,” that’s a Goal in Swydo — not a hope. Goals run on Combined Data Sources metrics, so the same number you put on the cover page is the one Swydo paces against. The Goal pacing view (On Track / Off Track / Achieved) shows you in week two of Q3 whether you’re on the curve.
Set up Goal Notifications and the assigned user or client lead gets a midpoint update plus a final outcome ping. If you’re off-track, you have eight weeks to course-correct instead of a panicked email in week eleven. That kind of forward-looking conversation is the difference between a renewal and a churn note — see what we’ve written about the analytics agencies use to lift client retention rates for the longer take.
Call this whole monitoring layer the in-between-reports system. The monthly report is the proof. The boards, metrics overview, alerts, and goals are the work.
What About Letting Clients Ask Their Own Questions
One more piece of the report-to-renewal motion. The questions clients ask between reports — “why did CTR dip last Tuesday?” — usually get answered by an AM writing a paragraph that AI could have written in three seconds.
Toggle client-facing AI on inside the shared dashboard. Your client opens the dashboard, types the question into the chat, and gets a contextual answer pulled from the actual data in front of them. You stay focused on strategy. They get answers when they want them, not when your calendar opens up.
That’s not laziness — it’s a redistribution of where your account team’s hours go. The questions that need a human answer (strategy, tradeoffs, what to do next) get the human. The “what does this number mean?” questions get the AI.
What About Looker Studio
A fair question. You can build a version of the Blended Search Scorecard in Looker Studio if you’re weighing it against Swydo, and it’s free. Two honest tradeoffs.
- You’ll spend the first month wiring connectors and the second month explaining why Meta data is twice as expensive to refresh as Google Ads data. Quota limits stack up fast across a multi-client roster.
- There’s no native monitoring layer. No alerts on CPC drift, no goal pacing, no connection-health pings when a token expires at 2am on a Saturday. You can build alerting in BigQuery or Zapier, but you’ve now built a small data platform instead of a reporting tool.
If you’re at one or two clients, Looker Studio is fine. Past five, the engineering tax catches up.
SEO vs PPC: Frequently Asked Questions
Direct answers on channel choice, budget mix, AI visibility, and blended reporting
SEO earns search visibility without paying for placement; PPC pays for each click on an ad. SEO compounds over months and costs labor; PPC produces traffic in hours and costs media spend.
SEO covers technical optimization, content, internal linking, backlinks, and schema. PPC mainly covers Google Ads, Microsoft Ads, and paid social. SEO results keep working after you stop investing; PPC stops the moment you pause the campaign.
Neither is better in the abstract — the right choice depends on your stage, vertical, and how fast you need results. Most businesses should run both and weight the mix by goal.
PPC wins for immediate signals, flash campaigns, geo-fenced services, and high-CPC verticals where SEO would take 18+ months. SEO wins for established brands, ad-blocker-heavy audiences, advisory categories where ads feel untrustworthy, and CPCs above $40 where the LTV math breaks.
SEO is cheaper per visitor once the asset is built; PPC is cheaper to start. An analysis of 119 businesses with revenue over $10M found 1,000 SEO visitors cost $217 versus $3,493 for 1,000 PPC visitors.
The same dataset showed PPC produced more absolute revenue per 1,000 visitors ($14,094 vs $1,767), but SEO produced more revenue per dollar spent (8.13× ROAS vs 4.04×). Cheaper depends on whether your budget is fixed or unlimited.
SEO takes 3–6 months for non-competitive keywords and 12+ months for competitive ones. Rankings have decoupled from clicks, so plan for both a ranking timeline and a separate citation timeline for AI Overviews.
Earning AI Overview citations follows different signals than blue-link rankings — original data, schema, fact density, and entity associations matter more than backlink volume. Some sites see citation traffic in weeks even if they aren’t yet ranking #1.
PPC produces clicks within hours of campaign launch and meaningful conversion data within days to weeks. The bottleneck is learning, not visibility.
Smart Bidding and Performance Max need 2–4 weeks of conversion data to optimize properly. Plan for an initial learning period where cost-per-conversion is higher than steady state, then re-evaluate performance after the algorithm has stabilized.
PPC stands for pay-per-click — an advertising model where you pay each time someone clicks your ad. The dominant platforms are Google Ads, Microsoft Ads, and paid social channels like Meta and LinkedIn.
Modern PPC has evolved beyond simple keyword bidding. Performance Max picks placements automatically, AI Max for Search picks the matching, and Smart Bidding picks the bid amounts — meaning significant control has shifted to Google’s machine-learning systems.
SEO stands for search engine optimization — the practice of earning visibility in unpaid search results through technical, content, and authority signals.
Modern SEO also includes earning citations inside AI-generated answers from Google AI Overviews, ChatGPT, Perplexity, and Gemini — a discipline some call GEO (generative engine optimization) or AEO (answer engine optimization).
Start with PPC if you need results this quarter, are testing product-market fit, or operate in a high-CPC vertical. Start with SEO if you have an established brand, sell into advisory categories, or face CPCs that break your LTV math.
The most common pattern for new businesses is PPC-heavy at launch (around 75/25) to generate market signals, then rebalancing toward SEO as content and authority accumulate. Treat the split as an opening position, not a permanent setting.
A common starting framework: pre-PMF startups run 75% PPC / 25% SEO, growing businesses run 60/40, and established brands invert to 40% PPC / 60% SEO. High-CPC verticals often run a 50/50 split.
Adjust based on signals from your blended Cost/Conv. across both engines. Geo-fenced local services typically stay PPC-heavy (around 65/35); ad-blocker-heavy audiences like developer tools or privacy products skew toward 30% PPC / 70% SEO because the paid funnel leaks.
Choose PPC when you need fast results, are launching in a category with no search volume, running a short promotion, or competing in a vertical where SEO would take 18+ months. Geo-fenced businesses also benefit from leading with paid.
A locksmith covering three zip codes can’t out-content national directories with SEO. A post-funded startup that needs growth curves for the board can’t wait two quarters for content to compound. In both cases, paid is the cleaner first lever.
Choose SEO when your audience uses ad blockers, distrusts ads, your CPCs exceed $40, or you’re an established brand with informational-intent search volume too expensive to buy.
Developer tools, privacy software, and technical buyer categories often see ad-block rates above 40%, making PPC funnels leaky. Financial, healthcare, and legal information categories see lower ad CTRs because users actively prefer organic sources.
Legal services lead at roughly $8.58 average cost-per-click and $131.63 cost-per-lead based on WordStream benchmarks across 16,000+ US campaigns. Insurance, financial services, and home improvement also rank among the most expensive.
In high-CPC verticals, PPC works as runway while SEO builds the moat. A personal-injury firm in a competitive metro can’t rely on SEO alone for the first two years — but it also can’t sustain $130 leads forever without an organic asset reducing blended Cost/Conv.
Yes, but the split looks different from larger budgets. A small business with $3–10K monthly should typically run 75% PPC and 25% SEO, treating SEO as a slow-burn investment rather than a primary growth lever.
The cheapest entry to SEO is publishing 1–2 high-quality articles per month targeting commercial queries that PPC search-term data has already proven convert. That avoids spec content and uses paid spend as keyword research.
Not as a blanket rule. Google’s incrementality research shows about 50% of paid clicks remain incremental even at organic rank #1 — meaning pausing ads loses half those clicks rather than recovering them organically.
At ranks 2–4, 82% of paid clicks are incremental. At rank 5+, 96% are incremental. Pause selectively on informational queries where users grab the credible blue link; keep paid bids on commercial-intent queries where a competitor’s ad would steal the click.
Usually yes, but verify with a geo-holdout test instead of assuming. If organic recovers under 80% of paused paid clicks, keep bidding; if recovery exceeds 95%, redirect the budget.
Brand-bidding incrementality varies by competitive pressure. If competitors actively bid on your brand terms, pausing your own bids hands them the click above your organic listing. Split markets geographically, pause brand bids in half, and measure organic recovery after 30 days.
Export the Google Ads search-terms report quarterly and hand the top 200 converting queries to the SEO team as a content priority list. PPC data shows you what actually converts, not just what gets searched.
This skips the guesswork in traditional keyword research. Commercial-intent terms that converted in paid campaigns are the highest-confidence targets for organic content, because you’ve already validated they produce revenue, not just clicks.
Often yes. An Optmyzr study of 503 Google Ads accounts found 91.45% had keyword overlap between Search and Performance Max campaigns, meaning your two campaigns frequently bid against each other.
Add brand-term negatives at the Performance Max campaign level, use the search-term insights view to spot overlap, and review the channel performance breakdown regularly. Without these guardrails, most accounts are inadvertently paying premium prices for clicks they’d have won cheaper through Search alone.
Yes — and they perform better together than apart. SEO content that earns AI Overview citations lifts paid CTR for the same brand by up to 91%, while PPC search-term data reveals which queries actually convert for SEO targeting.
The channels share audience signals, conversion data, and SERP real estate. Treating them as separate budgets creates the “my CPC is up but I’m not sure if my SEO improved” problem; treating them as one demand-capture system makes blended Cost/Conv. the honest metric.
A geo-holdout experiment where you pause brand-keyword PPC bids in half your markets and measure how much organic traffic recovers in those markets versus the control group. The recovery rate tells you whether brand bids are incremental or replacing organic.
If organic recovers under 80% of lost paid clicks, brand bidding is incremental and worth keeping. Over 95% recovery means the paid spend is largely redundant. Most brands fall in the middle and benefit from keeping bids active to block competitors.
AI Overviews drop click-through rates on the #1 organic position by 58% when they appear, according to Ahrefs analysis of 300,000 keywords. Paid CTR drops alongside it on the same SERPs.
The flip side: brands cited inside an AI Overview earn 35% more organic clicks and 91% more paid clicks than brands not cited. Visibility inside the AIO box acts as an authority signal that lifts performance across the rest of the SERP, not just the citation itself.
GEO is the practice of optimizing content to be cited inside AI-generated answers from Google AI Overviews, ChatGPT, Perplexity, and Gemini. Some practitioners use the term AEO (answer engine optimization) for the same discipline.
GEO ranking signals overlap with SEO but weight differently. Original research, schema markup, entity associations through Wikipedia and Wikidata, named-expert authorship, and high fact density matter more for AI citations than for blue-link rankings.
Content that opens with a direct answer in the first 40–60 words, includes original data or research, uses structured schema, demonstrates entity associations, and packs concrete numbers, dates, and attributed quotes.
Original research is the single most-cited content type in large language model answers. Pages built around proprietary surveys, benchmark studies, or first-party data outperform commentary or roundup content for AI citation visibility.
Filter GA4 by referral source to isolate sessions from ChatGPT, Perplexity, Gemini, and Copilot. Add these as a custom traffic segment so you can compare AI-referral conversion rates against regular organic and paid.
For visibility data (whether your domain is being cited at all), use Semrush AI Overview tracking or similar tools that surface AI Overview triggered keywords and citation presence. Visibility and traffic are separate metrics — track both.
AI Overviews are the AI-generated summary box that appears at the top of a regular Google search results page. AI Mode is a separate, dedicated AI search interface that replaces the standard SERP with a conversational answer experience.
Both surface citations from web content but use different triggers and layouts. Optimization tactics overlap — original data, schema, entity associations — but AI Mode tends to favor longer-form, more authoritative sources because it generates more comprehensive answers.
Not yet as a budget line, but yes as a measurement line. AI visibility work is largely SEO labor performed with citation patterns in mind, so it doesn’t require a separate retainer or team.
Track AI Overview triggered keywords, AI Overview citation share, and AI-referral traffic in GA4 separately from organic SEO metrics. When those numbers start moving meaningfully, you’ll have the data to decide whether to formalize a dedicated GEO workstream.
No — but it’s changing what “winning” looks like. Ranking #1 used to mean dominant traffic; now ranking #1 with an AI Overview present means a 58% lower click-through rate. The new game is earning citations inside the AI answer.
The fundamentals — relevance, authority, technical health — still matter. What’s changed is the weighting: original research, structured data, and entity associations have become higher-leverage than backlink-volume tactics that dominated the previous decade.
Blended Cost/Conv. is total paid spend across search platforms divided by total search conversions — the single number that shows what a converted search lead actually costs across both Google Ads and Microsoft Ads.
Most agencies report Google Ads cost-per-conversion and Microsoft Ads cost-per-conversion separately, leaving the client to add them up. Blending the two engines into one metric is the cleanest way to show what a search lead really costs without the client doing mental math.
A three-layer reporting framework that measures Capture (what share of demand you convert), Compete (what share of the SERP you own), and Cite (what share of AI answers mention you). Each layer has two to three metrics.
Layer 1 covers blended Cost/Conv., blended ROAS, and search-driven pipeline. Layer 2 covers paid impression share, organic visibility share, and SERP real estate ownership. Layer 3 covers AI Overview triggered keywords, AI Overview citation presence, and AI-referral traffic in GA4.
Combine paid and organic sources into a single blended report with one cover-page number (blended Cost/Conv.), three layers underneath (Capture, Compete, Cite), and an executive summary in three sentences. Avoid separate SEO and PPC decks.
Reporting tools like Swydo, Looker Studio, and AgencyAnalytics support cross-channel widgets that blend Google Ads, Microsoft Ads, GA4, and Semrush data in one view. The blend is what reveals whether channels are reinforcing or cannibalizing each other.
Use a Combined Data Sources widget that pulls Google Ads and Microsoft Ads into a single chart for Cost, Clicks, Conversions, and Cost/Conv. The blended metric becomes the cover-page number for the report.
In Swydo, Combined Data Sources support up to five ad platforms in one widget — including Google Ads, Microsoft Ads, LinkedIn, Meta, TikTok, Pinterest, Snapchat, X, and Reddit. The blend is limited to standardized metrics like Cost, Clicks, CPC, CTR, Cost/Conv., and ROAS, so custom calculations need to live alongside as Manual KPIs.
Looker Studio is free and fine for one or two clients. Past five clients, the engineering tax of managing connector quotas, refresh limits, and missing alert infrastructure usually justifies a dedicated reporting platform.
Dedicated tools add native monitoring layers — CPC drift alerts, goal pacing, connection-health pings — that Looker Studio requires you to build in BigQuery or Zapier. For agencies with no data engineer, that build-out becomes a hidden cost.
Monthly formal reports for clients, plus a daily monitoring dashboard for the internal team. Monthly reports are postmortems; the daily dashboard is mission control.
Set alerts on leading indicators (CPC drift, impression share lost to budget, position drops on commercial keywords) rather than lagging ones (total cost). A 7-day trigger window is sharper than daily without being noisy, and Slack notifications get read faster than email.
Use a cross-client Metrics Overview that pins the same blended Cost/Conv. metric from every account in one view, so portfolio drift is visible without opening individual reports.
Swydo’s Metrics Overview now accepts Combined Data Sources metrics, meaning the blended Cost/Conv. on each client’s cover page is the same number shown side-by-side across your roster. When one account drifts above the median for two periods, you know which client needs attention before they email you.
Set a Goal in your reporting tool tied to the blended metric in your SOW — for example, “drive blended Cost/Conv. under $80 by end of Q3.” Goal pacing then shows On Track / Off Track / Achieved early enough to course-correct.
Swydo Goals now run on Combined Data Sources metrics, so the same blended number on the cover page is what gets paced against. Enable Goal Notifications and the assigned lead receives a midpoint update plus a final outcome ping, replacing the panicked week-eleven email with an eight-week course-correction window.
Three metrics carry the report: blended Cost/Conv., SERP real estate ownership across your top commercial keywords, and AI Overview citation share. Everything else is supporting detail.
Blended Cost/Conv. answers “what is this costing me?” SERP real estate answers “where am I winning or losing visibility?” AI citation share answers “am I being included where attention is moving?” Reports that lead with these three avoid the padding that turns a 6-page summary into a 30-page deck nobody reads.
Use date-range comparisons that match the channel’s natural cycle. Compare PPC month-over-month, but compare SEO quarter-over-quarter or year-over-year to give it room to show as the compounding asset it is.
Standard “this month vs last month” comparisons flatter PPC and starve SEO of credit. Reporting tools that let you compare unequal date ranges (a 3-month quarter against a 9-month year-to-date, for example) avoid the distortion.
Final Thoughts
Stop selling channels. Start selling a search system your client can actually see.
Three things to take away. Blended Cost/Conv. is the only number your client really cares about. The Compete layer (impression share + visibility share + SERP real estate) tells you where the next dollar should go. The Cite layer (AI Overview presence + AI referrals) is where the next two years of attention is moving.
Put your blended Cost/Conv. on the cover page and prove SEO and PPC are working together.
Start Your Free Trial Today