
Nowadays, agencies are all about efficiency. And one of the most time-consuming tasks in an agency’s daily life is crafting reports for clients. Marketing teams often spend hours manually collecting data from various sources, formatting charts, and creating easy-to-digest reports – time that could be better spent on strategy and campaign optimization.
In the competitive landscape of marketing reporting tools, Whatagraph has established itself as a notable player. However, before deciding if it’s the right fit for your agency in 2025, it’s essential to understand what this platform offers, who it’s designed for, and why you might want to consider alternatives.
What is Whatagraph?
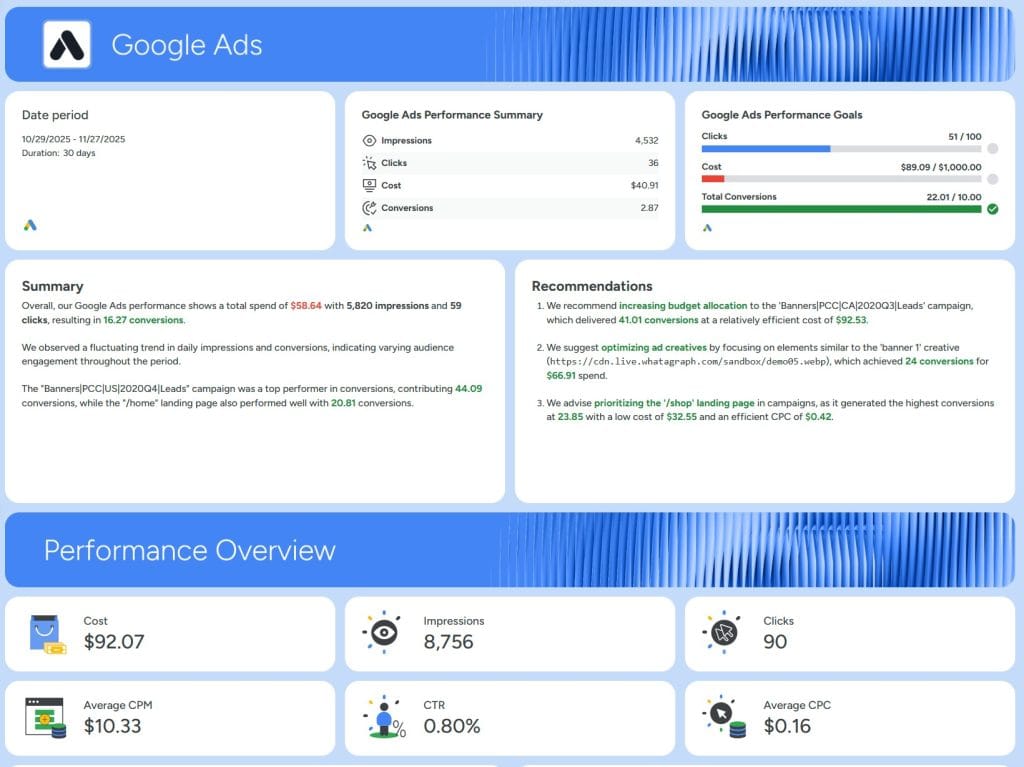
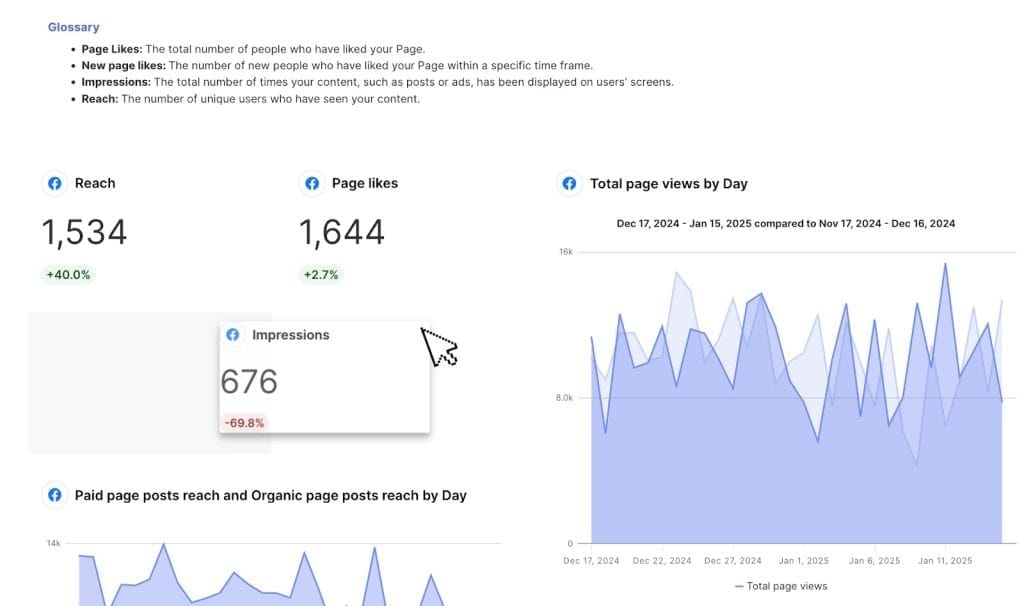
At its core, Whatagraph is a marketing reporting platform designed to help agencies automate their client reporting processes. The platform collects data from multiple marketing channels and transforms it into visually appealing reports.
Core Features and Capabilities
- Whatagraph IQ (AI-powered features for report generation, themes, summaries, and chat available across all plans)
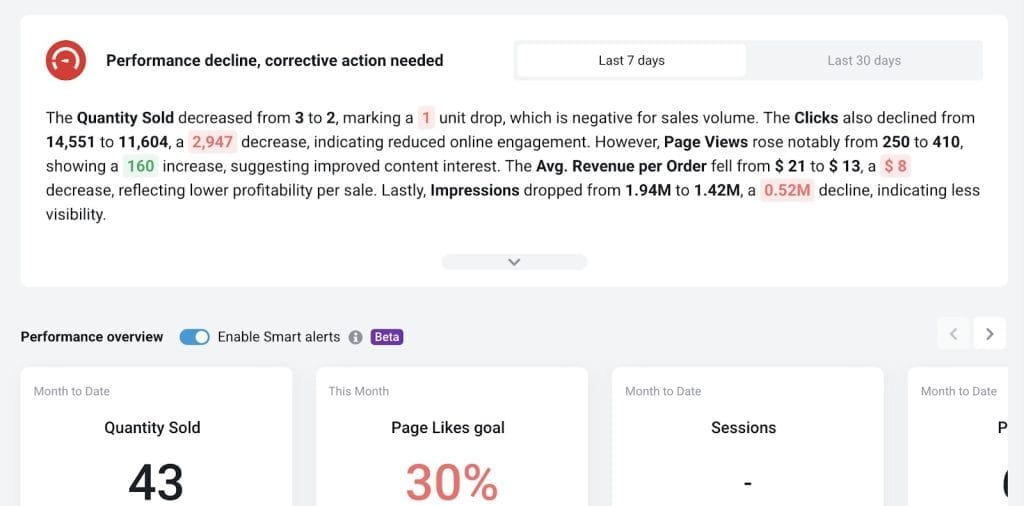
- Goals & Alerts for proactive monitoring (launched May 2025)
- No-code data transfer to Looker Studio and BigQuery
- Fully customizable, white-labeled reports with auto-branding from images, palettes, themes, logos, and domains
- Automated report delivery straight to the client’s inbox
- Smart Builder with drag-and-drop and AI automation
- Cross-channel widgets and blended metrics with custom formulas
- Unified naming and export capabilities
- Slack/Notion insights integration
Pricing
Whatagraph uses a credit-based pricing system where each data source requires one credit. While they display pricing tiers on their website, specific dollar amounts are not publicly listed. Users must contact sales or sign up to receive custom quotes based on their specific needs.
The platform offers four tiers:
- Free Plan: Limited features for testing
- Start Plan: Basic tier for small teams
- Boost Plan: Mid-tier for growing agencies (includes dedicated Success Manager)
- Max Plan: Enterprise-level features and support (includes dedicated Success Manager)
Key features across all paid plans include white-labeling capabilities, AI features (Whatagraph IQ), and comprehensive integration access.
Supported Integrations
Whatagraph supports 55+ third-party integrations. You can plug in your data from:
- Google Analytics and Google Ads
- Social media platforms (Facebook, Instagram, LinkedIn)
- SEO tools (Semrush, Ahrefs)
- Email marketing platforms
- Custom API integrations
- CRM systems
- E-commerce platforms
If you’d like to get Custom API integrations, get ready to pay extra – all the other integrations are included in all plans as based on the source credit logic. The more accounts from multiple integrations you connect, the more source credits you need to use.
Who is Whatagraph for?
Whatagraph is specifically designed for marketing agencies looking to streamline their client reporting workflows. This platform is particularly valuable for:
- Digital marketing agencies managing multiple client accounts
- In-house marketing teams reporting to executives
- Agencies looking to save time on repetitive reporting tasks
- Teams wanting to deliver professional, branded reports
- Marketers needing to consolidate data from multiple platforms
The platform’s comprehensive feature set and customization options make it suited for mid-sized to larger agencies that can leverage its advanced capabilities and justify the investment.
Why Look for Whatagraph Alternatives?
Based on 2025 user feedback and industry analysis, agencies explore alternatives for several key reasons:
Pros and Cons
Here are some standout features that highlight Whatagraph’s strengths:
- Advanced data joining and blending capabilities
- Professional-looking report templates
- Comprehensive visualization features
- Flexible customization options
- Automated report scheduling
- Multi-language support
- White-labeling and custom domain options
- AI-powered insights and correlations (Whatagraph IQ)
- Goals & Alerts for proactive monitoring
2025 reviews praise Whatagraph for being “beautiful and intuitive,” enabling “reports in shortest time,” requiring “no SQL,” and using AI for efficiency.
However, some drawbacks might be a dealbreaker for some marketing agencies:
- Higher pricing compared to competitors
- Steep learning curve for beginners
- Complex interface that can overwhelm newcomers
- Some users experience glitches when editing simultaneously
- Limited data refresh rates (12-24 hours for some integrations, not real-time)
- 7-day wait period to re-add deleted integrations (policy to prevent bypassing limits)
- Custom metrics creation can be challenging despite formula/blending support
- Premium features concentrated in higher tiers
Why You Might Be Looking for Whatagraph Alternatives
There are several compelling reasons why your agency might be exploring alternatives to Whatagraph in 2025:
Cost Considerations
Whatagraph positions itself in the premium segment of marketing reporting tools. The credit-based pricing system and custom quote requirement can make it difficult to predict costs, especially as data source needs grow. Agencies often find more transparent and potentially more affordable options with competitors.
Usability Challenges
Despite being praised for intuition and requiring no coding, Whatagraph can still overwhelm beginners. The platform’s comprehensive feature set requires time investment to master, and some users report interface glitches during concurrent editing sessions.
Feature Alignment
Whatagraph’s evolution toward comprehensive performance monitoring with Goals & Alerts adds proactive value but also complexity. Some agencies find this overkill for basic reporting needs and prefer simpler, more focused solutions.
Data Refresh Limitations
With refresh rates of 12-24 hours for some integrations, Whatagraph may not meet the needs of agencies requiring near-real-time reporting capabilities.
Whatagraph aims to solve these challenges, but its comprehensive features have led many agencies to explore simpler, more cost-effective alternatives that better align with their specific reporting needs and workflow requirements.
Best Whatagraph Alternatives
Here’s a breakdown of each Whatagraph competitors and alternatives:
| Whatagraph | Swydo | Databox | Agency Analytics | DashThis | Supermetrics | |
|---|---|---|---|---|---|---|
| Pricing | From $229 | From $69 | From $199 | From $79 | From $49 | From $29 |
| Free Trial | Yes, for agencies upon request | 14-day free trial for everyone | 14-day free trial for everyone | 14-day free trial for everyone | 10 dashboards for free for 15 days | 14-day free trial for everyone |
| Best Suited For | Marketing reporting automation | Streamlined reporting for digital marketing agencies | Business analytics & performance tracking | All-in-one reporting with SEO & campaign monitoring | Simple automated reporting for marketing agencies | Data integration & reporting for marketing teams |
| Customization | Fully customizable reports, white-label options | Pre-made templates with customizable drag-and-drop customization | Extensive customization, custom metric creation | End-to-end white-label, extensive templates | Limited customization, pre-set KPIs | Customization capabilities via API |
| Automated Reporting | Daily and weekly automation | Hourly, daily, and weekly automation | Hourly, daily, and weekly automation | Daily and weekly automation | Daily and weekly automation | Hourly, daily, and weekly automation |
| Integration Options | 55+ integrations | 30+ integrations | 100+ integrations | 75+ integrations | 30+ integrations | 100+ sources with Custom API |
| Ease of Use | Steep learning curve, complex interface | Intuitive, easy-to-use interface | User-friendly, though some features have a learning curve | Easy-to-use, but advanced features may require more experience | Simple UI, but limited flexibility | Complex setup, steep learning curve |
| Mobile Accessibility | No mobile-specific features | No mobile-specific features | Mobile-first design | No mobile-specific features | No mobile-specific features | No mobile-specific features |
| Data Visualization | Advanced visualizations, flexible templates | Range of data visualization options | Powerful real-time data visualization | Basic data visualization tools | Basic data visualization tools | Limited native visualization, relies on external tools like Looker Studio |
| Support | 24/7 via live chat, email, and knowledge base | 24/5 (Monday to Friday) via live chat, email, knowledge base, phone | 24/7 via live chat, email, knowledge base, phone | 24/5 (Monday to Friday) via live chat, email, and knowledge base | 24/7 via live chat, email, and knowledge base | 24/7 via live chat, email, and knowledge base |
| Data Manipulation | Limited manipulation on lower plans | Basic data manipulation | Custom metric creation, data blending | Limited data blending capabilities | Basic data manipulation | Custom metric calculations, advanced blending |
| Data Blending | Advanced | Basic | Advanced | Basic | Advanced | Advanced |
| Reporting Templates | Professional templates, customizable layouts | Pre-made templates, quick report creation, drag-and-drop interface | Highly customizable, AI-powered insights | Extensive template library | Pre-set KPI widgets, drag-and-drop report builder | Relies on external tools for templates |
| Client Management | Limited client management features | Client report sharing, KPI widgets | Goal tracking, alerts for clients | Client management portal | Basic dashboard-sharing options | No specific client management features |
| Historical Data Access | Limited on lower-tier plans | No specific limitations on historical data | Limited on free plans | Limited data retention on lower plans | No advanced historical data features | Historical data access based on pricing plan |
| Reports Export Options | PDF, CSV, PNG (for images), Excel (XLSX), URL | PDF, CSV, Excel (XLSX), Google Sheets (via integration), URL | PDF, CSV, Excel (XLSX), Google Sheets (via integration), PNG (for images) | PDF, CSV, Excel (XLSX), Google Sheets (via integration) | PDF, CSV,Excel (XLSX), Google Sheets (via integration), PNG (for images) | CSV, Excel (XLSX), Google Sheets (via integration), Google Data Studio (direct integration) |
1. Swydo
Swydo has established itself as a streamlined marketing report software loved by digital marketing agencies seeking efficiency without complexity. Compared to Whatagraph, this platform is suitable for even the smallest agencies thanks to its lower-tier plans, straightforward setup process, and drag-and-drop report-building functionality.
However, before deciding if it’s the right fit for your agency, it’s essential to understand what sets this platform apart.
Core Features and Capabilities
- Automated data imports with smart field mapping
- Pre-made report templates with easy drag-and-drop customization
- White-label branding options for complete agency personalization
- Scheduled report generation and distribution
- Interactive dashboard sharing with clients
- Comprehensive PDF exports with custom layouts
- Built-in KPI widgets and custom metrics creation
- Monitoring & Alerts
- Data Source Health Check
- Integrate Client Messaging Tools
- Add Agency Markup
- Combine data source (data blending)
- AI summaries
Pricing
Swydo offers a flexible monthly subscription based on the number of data sources you need to connect. The base fee starts at just $69/month and goes up as you scale:
| Number of Data Sources | Price per Data Source |
|---|---|
| First 10 data sources | included in the initial monthly base fee of $69 |
| 11 – 100 data sources | $4.00 per data source |
| 101 – 500 data sources | $3.00 per data source |
| 501+ data sources | $2.00 per data source |
If you need more than 1000 data sources, you can get a tailored plan by filling out the contact form.
Each plan includes a 14-day free trial (no credit card required).
Swydo allows users to pause or cancel their accounts anytime, with cancellation effective at the end of the current billing period.
Most Popular Integrations
Swydo allows you to import data straight to your reports from 30+ third-party tools and platforms, including:
- Google Ads
- Facebook Ads & Insights (Meta)
- Google Business Profile
- Google Analytics 4
- Google Sheets
- Instagram Insights
- Google Search Console
- LinkedIn Ads & Pages
- Microsoft Advertising
Swydo also offers Zapier/Make integration into Google Sheets, so even if you can’t find your preferred integration, you can import third-party data with just a few clicks.
Pros and Cons
Key advantages that set Swydo apart from the competition:
- Fast-loading reports
- Intuitive user interface (requiring minimal training)
- Flexible and competitive pricing
- 24/5 Customer Support
- Quick report creation with pre-made templates
- A range of data visualization options
- Reliable automated scheduling
- Consistent platform performance
- Strong focus on core reporting functionalities
However, as with every platform, Swydo also has some drawbacks you should consider:
- Limited advanced data manipulation features
- Limited white-labeling options compared to the competitors
- No multi-tab dashboards
- Integrations are deep & not wide (i.e. less integrations but more metrics per integration)
- No mobile app/dashboard
2. Databox
Databox is a comprehensive business analytics platform that offers data-driven organizations a range of data analytics and reporting features. But before you hit the purchase button, you should know all the ins and outs of this platform.
Core Features and Capabilities
- Real-time data visualization and monitoring
- Custom metric calculations and data manipulation
- AI-powered metric correlations and insights
- Goals and alerts management system
- Mobile-first dashboard design
- Automated scorecard generation
- Advanced data blending capabilities
- Custom query builder for databases
Pricing
Databox no longer offers a freemium pricing model with main subscription options you can scale with additional data sources and users:
| Pricing Plan | Monthly Price |
|---|---|
| Professional | $199 |
| Growth | $499 |
| Premium | $999 |
All new users start with a 14-day trial. However, priority support and advanced integrations are only available on higher-tier plans, so the costs can add up quite quickly if your agency is in scaling mode.
DataBox allows customers to cancel at any time. Cancellation takes effect at the end of the billing cycle, and no refunds are given for unused services.
Supported Integrations
Databox might be among the winners based on the number of supported integrations. Agencies can import data from over 100 third-party platforms and tools, including:
- Google Analytics and Google Ads
- CRM systems (HubSpot, Salesforce)
- Social media platforms (Facebook, X, LinkedIn)
- E-commerce solutions (Shopify, WooCommerce)
- Financial tools (QuickBooks, Stripe)
- Custom SQL database connections
- Spreadsheets (Google Sheets, Excel)
Pros and Cons
Databox has several key advantages that make it stand out from the competition:
- Extensive customization capabilities
- Advanced goal-tracking features
- Robust data visualization options
- Free Forever plan for small agencies (up to 3 data sources)
Here are some limitations that you should keep in mind:
- Learning curve for advanced features
- Advanced integrations require custom setup and development knowledge
- Query builder can be complex for beginners
- Historical data limitations on basic plans
- Premium features and extra data sources can increase costs significantly
- Some integrations lack deep customization options
3. AgencyAnalytics
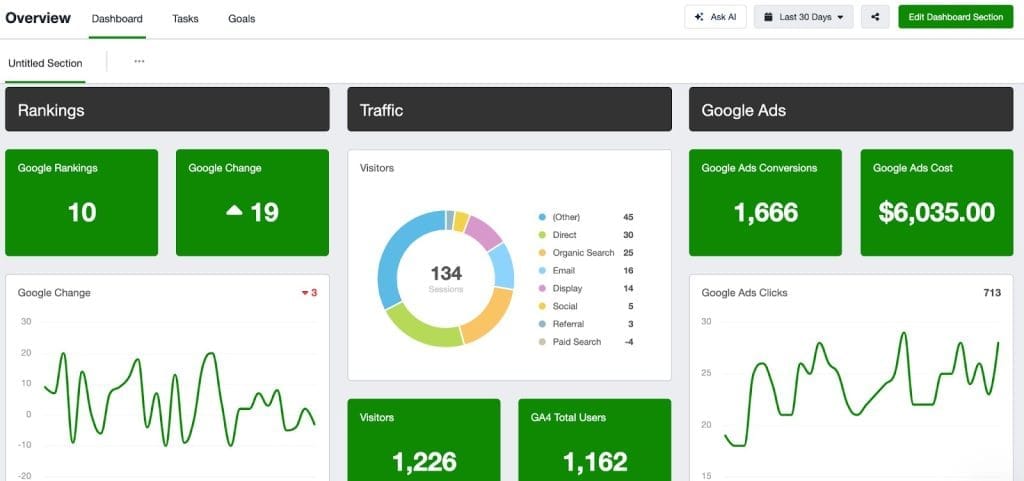
At its core, AgencyAnalytics serves as an all-in-one reporting and analytics platform that combines campaign monitoring, SEO tools, and automated reporting capabilities. The platform emphasizes agency scalability through extensive automation and white-labeling features, though some premium features remain locked behind higher-tier subscriptions.
Core Features and Capabilities
- Extensive white-labeling capabilities
- Built-in SEO tools and rank tracking (Discontinued SEO Tools, only offering rank tracker)
- Campaign monitoring and alerts
- Multi-channel data aggregation
- Client management portal
- Ask AI chatbot
Pricing
Like most similar platforms, AgenyAnalytics offers monthly subscriptions with the ability to add additional client campaigns as you go:
| Pricing Plan | Monthly Price |
|---|---|
| Freelancer | $79 |
| Agency | $239 |
| Agency Pro | $479 |
| Enterprise | custom |
Agencies can test out the platform for 14 days free of charge. However, there are a few fees that you should keep in mind. White-labeling is included in all plans, but custom domain setup requires purchasing and managing your own SSL certificate, priority support is only available in the Perform plan, historical data retention is limited on lower-tier plans, and expanding storage capacity comes extra.
AgencyAnalytics offers cancellation at any time, with the subscription remaining active until the end of the billing cycle with no refund policy.
Supported Integrations
AgencyAnalytics offers 75+ integrations, including:
- Google Analytics 4 and Google Ads
- Social media platforms (Facebook, Instagram, LinkedIn)
- SEO tools (Google Search Console, Ahrefs)
- PPC platforms and ad networks
- Email marketing services
- Call tracking solutions
- E-commerce platforms
Pros and Cons
Key advantages that make AgencyAnalytics a better Whatagraph alternative:
- Integrated SEO toolkit
- User-friendly interface
- Extensive template library
- Robust automation features
- Advanced client management tools
- Reliable data refresh rates
However, there are a few limitations you need to consider:
- Some advanced features and premium integrations require higher tiers
- Data storage limitations on lower plans
- Large pricing tier jumps (potentially forcing you to pay for feature you don’t need)
- Limited data blending capabilities
- No metric monitoring or alerts
- Learning curve for advanced features
4. DashThis
DashThis is a marketing reporting platform attracting agencies with its straightforward approach to automated reporting. While the platform offers a range of time-saving features, it offers limited customization options compared to competitors and a relatively higher cost per dashboard. So, before deciding if it aligns with your agency’s needs, it’s essential to understand both its strengths and potential drawbacks.
Core Features and Capabilities
- Pre-set KPI widgets and metrics
- Automated data refreshes
- Drag-and-drop report builder
- Multiple dashboard-sharing options
- CSV file integration support
- Basic data visualization tools
Pricing
While DashThis allows users to pay for dashboards, not sources, you still need to choose from one of their monthly subscriptions with a minimum dashboard count.
DashThis uses a dashboard-based pricing model:
| Pricing Plan | Monthly Price |
|---|---|
| Individual – 3 dashboards | $49 |
| Professional – 10 dashboards | $159 |
| Business – 25 dashboards | $309 |
| Standard – 50+ dashboards | $479 |
New users can get 10 dashboards for free for 15 days to test their features. If you’re looking for a custom report URL, or additional white-labeling features (available from 10 dashboards and up), you’ll have to pay extra for each.
DashThis allows users to cancel subscriptions at any time. After cancellation, you can continue using the service until the end of the billing period, but no refunds are provided for unused services.
Supported Integrations
DashThis connects with 30+ apps and tools, including:
- Google Analytics 4, Google Search Console, and Google Ads
- Social media platforms (Facebook, Instagram, LinkedIn)
- Email marketing platforms
- Display advertising networks
- E-commerce solutions
Pros and Cons
DashThis brings several standout features and capabilities to the table and could be a great match if you’re looking for features such as:
- Intuitive user interface
- Fast-responsive Customer Support team
- Custom CSV data imports
- Easy dashboard cloning
- Unlimited users, integrations & data sources on all plans
However, there are a few challenges and limitations that users might encounter while testing out the DashThis platform:
- Limited customization options
- Higher per-dashboard costs
- Basic data manipulation features
- Restricted white-labeling options
- Fixed widget layouts
- No custom calculation tools (i.e., custom metrics via user-defined calculations)
5. Supermetrics
Supermetrics positions itself as a versatile data integration and marketing reporting platform, catering to both agencies and in-house marketing teams. While the platform offers robust data connectivity options, relatively high costs for multiple connectors and potential complexity in data transformation might be a possible drawback for teams looking for a straightforward and affordable reporting option.
Core Features and Capabilities
- Automated data transfers to multiple destinations
- Custom metric calculations
- Query manager for data pulls
- Scheduled data refreshes
- Data blending across sources
- Historical data access
- Cross-platform reporting
- API access options
Pricing
Unlike Whatagraph or other reporting similar platforms, Supermetrics offers two different pricing models – destination-based:
| Destination | Monthly Price |
|---|---|
| Google Sheets | From $29 |
| Looker Studio | From $29 |
| Power BI | From $29 |
| Microsoft Excel | From $29 |
| Supermetrics API, BigQuery, and others | Price upon request |
And monthly subscription with core destinations, for example, Google Sheets:
| Destination | Monthly Price |
|---|---|
| Starter | From $37 |
| Growth | From $199 |
| Pro | From $499 |
| Business | Price upon request |
Supermetrics also offers a 14-day free trial to test any connector once you sign up for their platform. However, the platform has several significant hidden costs that aren’t immediately obvious from its base pricing.
You’ll have to pay extra for every additional connector with minimal commitment periods (monthly or yearly, depending on your subscription). And if you need premium connectors like Adobe Analytics, your monthly subscription cost can significantly increase.
Supermetrics allows users to cancel at any time. The cancellation is effective at the end of the billing period, and no refunds are typically offered.
Supported Integrations
Supermetrics provides 100+ data source connectors, including:
- Google Analytics 4, Google My Business, and Google Ads
- Social media platforms (Facebook, Instagram, LinkedIn, Reddit)
- SEO tools (Search Console, Ahrefs)
- Paid media platforms (TikTok Ads, Reddit Ads)
- Email marketing services
- E-commerce platforms
Pros and Cons
Supermetrics provides a range of features and tools designed to simplify marketing agency reporting process, including:
- Extensive integration options
- Deep customization capabilities
- Reliable data accuracy
- Regular data refreshes
- Enterprise-grade security
Despite its robust functionality, Supermetrics has its own limitations that users should evaluate before committing to the platform.
- High costs for multiple connectors
- Complex setup process
- Steep learning curve
- Limited visualization options
- No native reporting platform
- Additional costs scale quickly
- Technical expertise required
- Resource-intensive for basic needs
More Platforms to Explore
We’ve covered the best Whatagraph alternatives with robust data gathering, analysis, and reporting features. However, if you’re looking for a simple marketing analytics tool that would allow you to enhance your client’s marketing strategy further, you can explore Google Looker Studio or Klipfolio.
Looker Studio (Google Data Studio)
Looker Studio is a popular, free tool that allows users to create customized reports and dashboards by integrating with a wide range of data sources, mainly Google services.
While Looker Studio’s free access point is great, this Google-centric platform has notable limitations. The tool’s extensive customization options often translate to a maze-like interface that can overwhelm even experienced analysts. Its integration capabilities, though broad, demonstrate a clear bias toward Google, pushing organizations into the Google ecosystem.
Still, Looker Studio outperforms Whatagraph in scenarios requiring deep data manipulation and custom calculations. While Whatagraph focuses on streamlined marketing reporting, Looker Studio is useful for complex cross-platform analytics, especially when working with Google Analytics data or when teams need to create highly customized formulas and data transformations that go beyond standard marketing metrics.
Klipfolio
Klipfolio offers more integration options than Whatagraph when it comes to creating real-time dashboards from various data sources.
Its customization capabilities allow users to easily tailor reports and dashboards, giving them more control over how data is presented. While Whatagraph simplifies reporting for marketing teams, Klipfolio allows for deeper flexibility in creating personalized and dynamic visualizations.
Compared to Whatagraph, Klipfolio is the perfect match when agencies need real-time monitoring beyond Whatagraph’s hourly refresh rate. It particularly stands out in scenarios requiring live business intelligence dashboards that combine marketing data with other business metrics like sales, inventory, or custom API integrations.
Coupler.io
Coupler.io is a data reporting and automation platform that allows businesses to transform data from popular apps and services into meaningful reports in minutes. Before you start using it, it’s important to understand its core capabilities, pricing, integrations, and limitations.
Core Features and Capabilities
- Blend data from multiple sources into a single report
- Transform data: filter, sort, reorder, rename, aggregate, and use custom formulas
- Automate data syncing to spreadsheets, BI tools, or data warehouses
- Ready-made dashboards (100+ templates) for instant visualization
- Near real-time data refresh (every 15 minutes)
- User-friendly, wizard-based UI with no coding required
- Complementary analytics support from professional Coupler.io analysts
Pricing
Coupler.io offers flexible subscription plans with a 7-day free trial and a free forever plan for basic needs:
How to Choose The Right Whatagraph Alternative
After getting to know the best Whatagraph alternatives, it ultimately comes down to your marketing agency’s specific reporting needs, including the data sources you’ll be connecting and the types of visualizations you require.
When evaluating alternatives, consider your agency’s use cases. Are you primarily focused on marketing analytics or need broader business intelligence capabilities? Some tools excel at social media metrics, while others offer more robust e-commerce or website analytics features. Consider whether you need specialized features like custom branding, white labeling, or automated report generation.
Budget plays a crucial role in your decision. Look beyond the base subscription price and consider factors like:
- Additional user license costs that significantly impact total expenses for growing teams
- Pricing for premium features or advanced integrations that might be essential for your workflow
- Hidden costs such as implementation fees or required training sessions
- Data storage limits and potential over-usage charges that could affect long-term costs
When choosing a reporting platform, consider whether these features meet your requirements:
- Maximum number of team members who need access to the platform
- Role-based access controls for different departments
- Collaboration features that allow multiple team members to work on reports simultaneously
- Ability to share reports with clients or stakeholders outside your organization
Last but not least, determine the technical expertise required to implement and maintain the tool. Platforms like Swydo offer intuitive drag-and-drop interfaces suitable for non-technical users, while Whatagraph alternatives like Supermetrics might require development experience.
Bottom Line
When evaluating Whatagraph in 2025, consider your agency’s specific needs, reporting volume, and budget constraints carefully. Whatagraph positions itself as a premium, comprehensive solution with advanced AI capabilities and extensive customization options.
The platform’s credit-based pricing system and custom quote requirement make direct cost comparisons challenging, but agencies should evaluate alternatives based on their specific data source needs and feature requirements. Potential savings vary significantly depending on usage patterns and required integrations.
Before making a decision, take advantage of free trials offered by Whatagraph and its alternatives. Consider factors like ease of use, integration options, customization capabilities, data refresh rates, and long-term scalability. Remember that pricing structures and features for these platforms change frequently, so always verify current information directly with vendors before making a final decision.
For many agencies, the question becomes whether Whatagraph’s advanced AI features, comprehensive monitoring capabilities, and professional polish justify the premium positioning, or if more focused, transparent alternatives can deliver similar results while offering better cost predictability.
Still have questions unanswered? Check out our FAQ below:
Whatagraph Alternatives FAQ
Quick answers to help you choose the best marketing reporting platform
Whatagraph is a premium marketing reporting platform that automates client reporting with AI-powered features and extensive customization. People seek alternatives mainly due to high costs, complex interface, and limited data refresh rates (12-24 hours for some integrations).
Not typically. Whatagraph’s premium pricing and complex features are designed for mid-to-large agencies. Small agencies usually find better value with alternatives like Swydo ($69/month).
Key issues include steep learning curve for beginners, higher pricing than competitors, complex credit-based pricing system, limited real-time data refresh, 7-day wait to re-add deleted integrations, and interface glitches during simultaneous editing.
Yes, if you spend more than 5 hours weekly on manual reporting. Automated tools typically save 10-20 hours per week while improving report consistency and professional appearance. Most agencies recover tool costs within 2-3 months through time savings alone.
Swydo is the top choice for most agencies due to its intuitive interface, affordable pricing ($69/month base), and focus on core reporting needs without unnecessary complexity. It offers excellent value with white-labeling, automation, and 30+ integrations.
Databox and Supermetrics both offer 100+ integrations, making them ideal for agencies needing extensive data source connectivity. However, Supermetrics focuses on data transfer rather than reporting, while Databox provides complete reporting functionality.
Databox offers a free plan for up to 3 data sources, making it the cheapest option. For paid plans, Supermetrics starts at $29/month for Google Sheets, though costs increase quickly with additional connectors.
AgencyAnalytics offers the most comprehensive white-labeling at competitive prices, including custom domains, extensive branding options, and client portals. Whatagraph leads in sophistication but at much higher costs.
Looker Studio works well for Google-centric agencies comfortable with technical setup, but lacks automation, client management features, and professional templates that dedicated reporting platforms provide. It’s free but requires significant time investment.
Whatagraph typically starts around $229/month but uses credit-based pricing where each data source requires credits. Real costs often exceed $400/month for agencies with multiple clients and data sources. Exact pricing requires custom quotes.
Common hidden costs include additional user licenses, premium connector fees, data overage charges, custom integration development, setup and training costs, and annual vs. monthly pricing differences that can add 20-50% to base prices.
Multiply weekly hours spent on manual reporting by hourly rates, then multiply by 52 weeks. Most agencies save $15,000-$30,000 annually in labor costs alone. Add improved client retention and ability to serve more clients for total ROI calculation.
Yes, especially for annual commitments or multiple licenses. Whatagraph, AgencyAnalytics, and Databox often provide discounts for yearly payments. Start with smaller plans and negotiate upgrades once you prove value and usage patterns.
Basic setup takes 1-2 weeks including data connections and template creation. Complex migrations with historical data or custom integrations can require 4-6 weeks. Plan for parallel operations during transitions to avoid service disruptions.
Swydo and DashThis require minimal technical knowledge with drag-and-drop interfaces. Databox and AgencyAnalytics need moderate skills for advanced features. Supermetrics requires technical expertise for setup and maintenance.
Databox excels in real-time capabilities, while most others update hourly or daily. For standard marketing reports, daily updates are sufficient. Real-time data is mainly valuable for active campaign monitoring or crisis management.
Most platforms import 12-24 months of historical data automatically. Longer historical data may require higher-tier plans or custom setup. Check data retention limits before choosing, especially if you need multi-year trend analysis.
Most platforms allow data export during grace periods (typically 30 days) after cancellation. Export capabilities vary – some offer full data exports while others limit to report PDFs. Always clarify data portability before committing.
Focus on the 20% of features that handle 80% of tasks. Assign platform champions, create internal documentation for your workflows, and schedule regular training sessions. Most team members only need basic report creation skills.
Swydo and DashThis consistently receive praise for responsive support. Databox and AgencyAnalytics offer comprehensive help resources. Supermetrics can be slower due to technical complexity. Test support responsiveness during free trials.
Switch from Whatagraph to Swydo for faster, easier, and affordable client reporting.
Try Swydo Free