
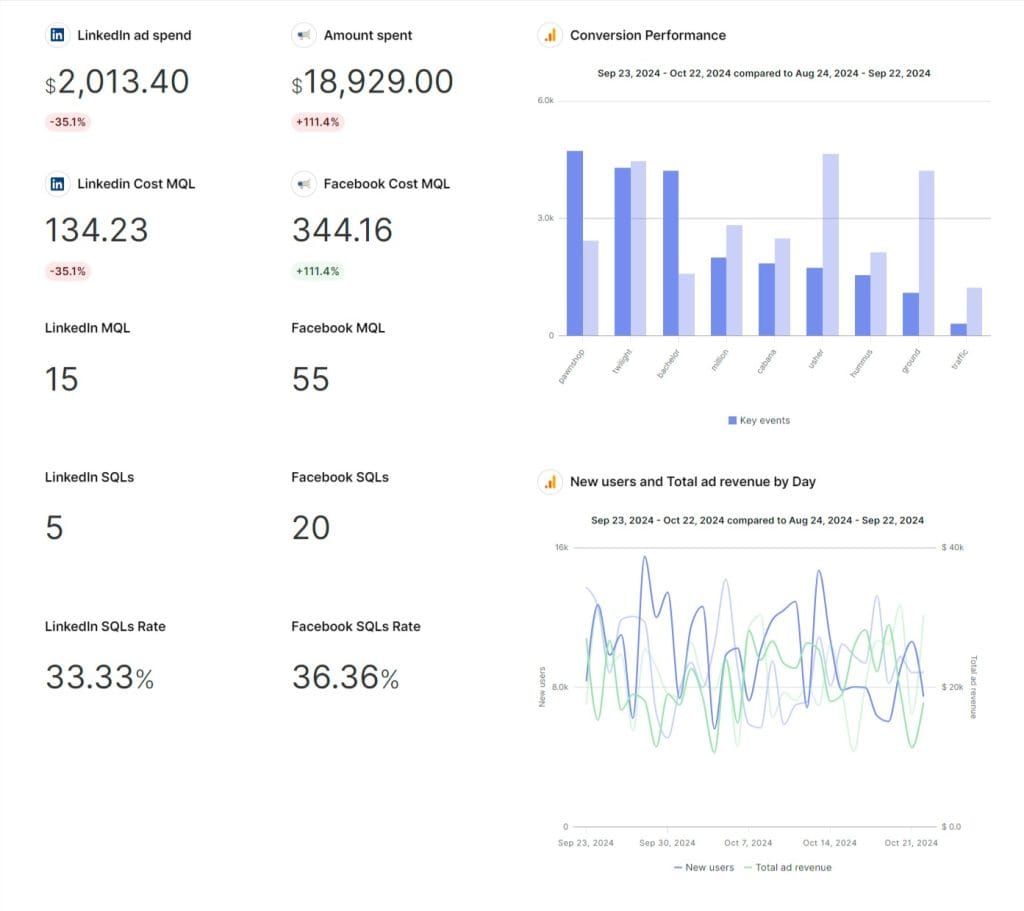
Your client’s CFO just emailed. They want a “detailed breakdown of social media investment returns” before Friday’s board meeting. Engagement is up, mentions are growing, and you still can’t connect any of it to revenue.
That’s the gap this guide closes.
Social media ROI is the revenue your social work generates minus your full investment, divided by that investment, multiplied by 100. The math is simple. Proving it to a finance-minded client is not.
Truth is, most clients aren’t questioning whether social media works. They’re questioning whether you can prove it works. Different problem. And it’s the one that decides whether your retainer renews next quarter.
This guide gives you the agency playbook. A five-layer framework called the Prove-It Stack. Three measurement methods that hold up under scrutiny. Platform benchmarks from real research. And a way to talk about ROI that lands with a CFO, a CMO, and a CEO — because they each want a different version of the story.
Let’s get into it.
What Is Social Media ROI?
Social media ROI is the financial return your social work generates, expressed as a percentage of total investment.
The formula:
The formula isn’t the hard part. Three things trip up most agencies:
- They miss costs. Especially staff time.
- They use last-click attribution. It undercredits social by a wide margin.
- They pick a measurement window that doesn’t match the client’s sales cycle.
Get those three right and the math takes care of itself.
Most agencies treat social ROI as a direct-sales question. That’s like judging a networking event by who buys something at the door. You’re missing everything else that happened in the room.
Social media generates value across three layers. A defensible ROI calculation accounts for all of them:
| Layer | What It Includes |
|---|---|
| Direct financial returns | E-commerce sales, lead conversions, paid customer acquisition |
| Indirect business value | Brand recall, sentiment, share of voice, employer branding |
| Operational efficiency | Lower customer-service cost on social, reduced traditional ad spend, content reuse from UGC |
Which one is your client actually paying you to deliver? If you can’t answer in a sentence, that’s the first fix.
Why Proving Social Media ROI Matters for Your Agency
Your ability to prove ROI decides three things. Whether the client renews. What you can charge. And whether your agency survives the next budget cut.
The squeeze is real. According to Gartner’s 2025 CMO Spend Survey, marketing budgets are flat at 7.7% of company revenue. 39% of CMOs plan to cut agency budgets this year. 22% say generative AI has reduced their reliance on agencies for creativity and strategy.
Read that again. Almost a quarter of your potential clients think they need you less than they did a year ago.
Agencies that ship ROI proof every month become the safe choice during budget cuts. Agencies that ship engagement reports become the easy cut. Which one is your agency right now?
Pricing follows the same logic. Show a client that your $25K retainer drove $310K in attributed pipeline and the renewal conversation is short. Show them 12% engagement growth and you’re arguing.
The shift toward social is also real. The 2025 Sprout Social Index found 80% of marketing leaders are reallocating funds from traditional channels into social. But only 44% rate their teams as expert at measuring the business impact. That gap is your opening.
What’s a Good Social Media ROI?
There’s no universal benchmark. Anyone who gives you a clean number is guessing.
The most defensible figure to cite comes from the Nielsen 2024 Annual Marketing Report. It found social media ROI runs about 36% higher than the all-media average over the past three years. Real benchmark. Real research.
A common practitioner rule of thumb is 4:1. $4 generated per $1 spent. That’s a heuristic, not primary research. Use it as a directional starting point.
Here’s the thing about benchmarks. Your client’s product margin matters more than any industry average. A 400% ROI on a 5% margin product is different from 400% on a 60% margin product. Set targets against your client’s economics, not a number from a blog post.
Marketing Mix Modeling research is more reliable than survey-based ROAS claims. Why? Because MMM measures incremental revenue — what wouldn’t have happened without the spend — instead of self-reported attribution.
A few real numbers worth knowing:
- Sellforte’s MMM data shows last-click attribution undervalues Meta channels by 2–9x and TikTok by roughly 17x for e-commerce
- HubSpot research ranks paid social (26%) and organic social (24%) as the second and third highest-ROI channels for marketers, behind website/SEO at 27%
- Sprout Social Index data shows 81% of consumers make spontaneous purchases inspired by social media multiple times per year
What Last-Click Hides
How much last-click attribution undervalues social
Marketing Mix Modeling shows the gap between what last-click reports and what each channel is actually worth.
Source: Sellforte MMM data for e-commerce and DTC brands.
Translation? If you’re still defending TikTok spend with last-click data, you’re losing the argument before it starts.
Introducing the Prove-It Stack
Five layers. Each one closes a gap that breaks most agency ROI claims.
The Framework
The Prove-It Stack
Cost
Track true investment, not just ad spend
Credit
Multi-touch attribution + MMM or incrementality
Chain
Connect engagement to revenue through CRM
CLV
Customer lifetime value for repeat-purchase clients
Counterfactual
Show what happens if social stops
↑ Each layer compounds. Skip one and the number is contestable.
Skip a layer and your number is contestable. Stack all five and you have something a CFO can sign off on.
Let’s walk through each one.
How to Prove Social Media ROI: The 5-Layer Prove-It Stack
Step 1: Lock Down Cost
Ad spend is the easy number. It’s also the smallest part of the picture for most agencies.
A complete cost number includes four categories:
- Human resources — strategy, content production, community management, reporting time
- Technology stack — management platform, analytics, design software, AI tools
- Paid media — ad spend, boosted posts, influencer fees
- Content production — photography, video, design, stock media
Staff time is usually the biggest line item. Often bigger than ad spend. If you’re not tracking it, your ROI math looks better than reality. That gap will eventually surface in front of a client. Bad day.
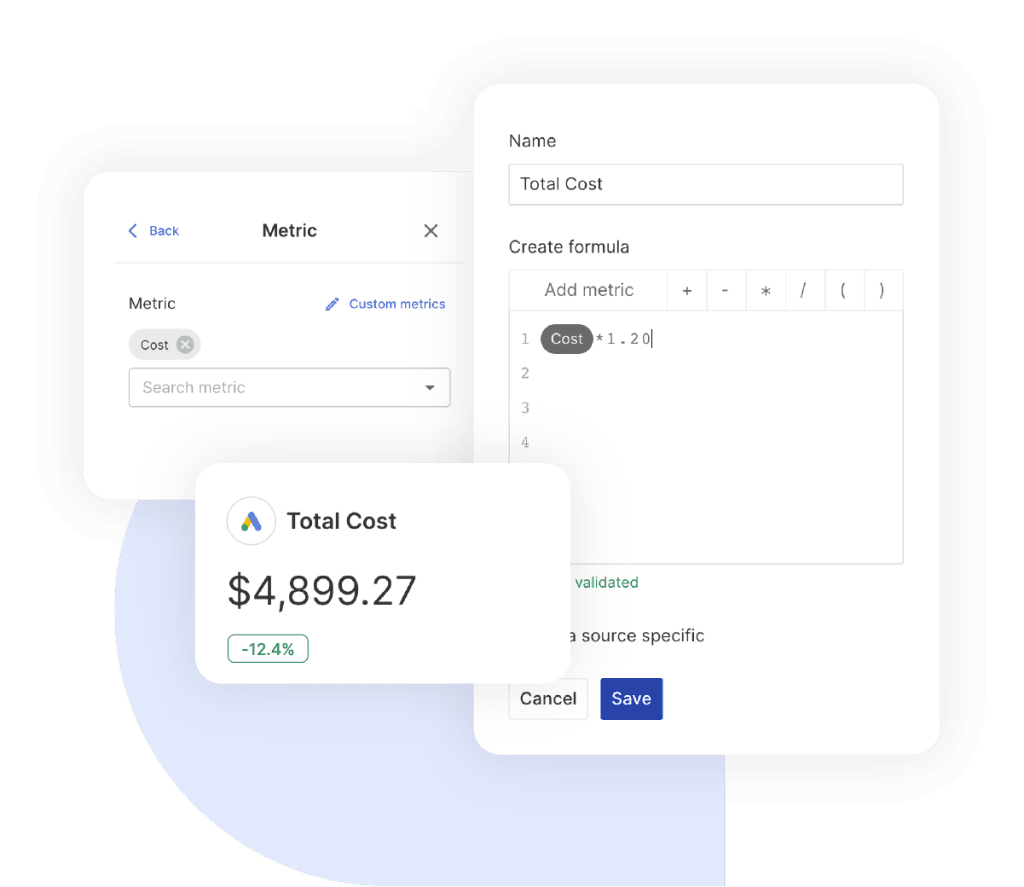
This is also where agency markup gets messy. If you charge clients a markup on ad spend, that needs to live somewhere visible in the report. Swydo’s Custom Metrics let you build a Cost × 1.20 formula once and reuse it across every client. No spreadsheet recalculations at the end of every month.
Before you move on: write down the four cost categories above for your largest client. If any number surprises you, that’s the gap to close before the next QBR. Set the SOW definition of success in writing too — see our client reporting best practices guide for the full scoping checklist.
Step 2: Assign Credit Properly
Last-click attribution is no longer credible for any client running multi-channel campaigns. You need three methods that work together. Stack at least two.
Multi-Touch Attribution (MTA) assigns fractional credit across touchpoints. Like splitting a tip — every touchpoint gets a piece. Pick a model based on the deal type:
- Data-driven — machine learning sets the weights. Needs a lot of data.
- Position-based — 40% to first touch, 40% to last, 20% to the middle. Good for B2B.
- Linear — equal weight to everything. Simple. Easy to explain.
- Time-decay — recent touches get more credit. Good for e-commerce.
MTA works best for clients with strong CRM data and deals under 90 days.
Marketing Mix Modeling (MMM) uses aggregate historical data and statistical regression. No cookies. No individual user tracking. Just math on what’s already happened.
MMM used to be only for enterprise budgets. Not anymore. Google released Meridian as open-source in early 2025. Meta’s Robyn is mature. Use MMM for clients spending $10K+/month across three or more channels.
Incrementality testing runs controlled experiments. Geo holdouts. Matched-market tests. Meta Conversion Lift. TikTok Brand Lift. The goal is causal impact — what would have happened without the spend.
Use lift studies for high-stakes campaigns. They’re also the tiebreaker when MTA and MMM disagree.
How to think about all three together:
- MTA tells you which touchpoints contribute
- MMM tells you what each channel is worth in aggregate
- Incrementality tells you what would have happened anyway
Step 2 Toolkit
Three attribution methods, three different questions
Multi-Touch Attribution
“Which touchpoints contributed?”
Marketing Mix Modeling
“What’s each channel worth in aggregate?”
Incrementality Testing
“What would have happened anyway?”
Different questions. Different methods. Don’t pick one and call it a day.
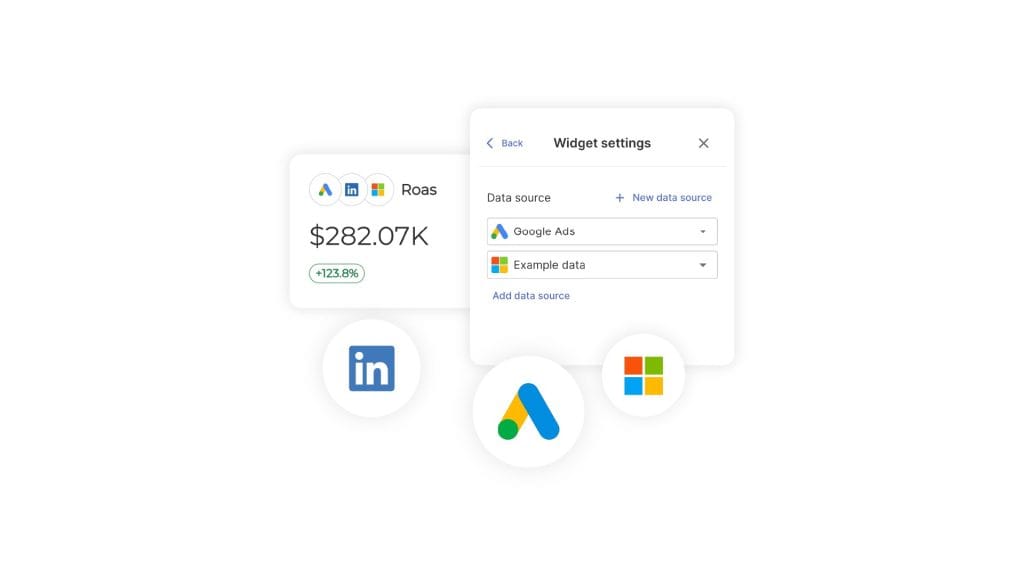
When you’re trying to show all of it on one page for a client, Combined Data Sources put up to five paid platforms — Google Ads, Meta, LinkedIn, TikTok, and others — into a single widget. A CFO can see cost, ROAS, and revenue side by side without flipping between tabs.
One honest limitation worth flagging: custom metrics don’t work inside Combined Data Sources widgets. If you’ve built a markup formula in Step 1 and want it in the cross-channel view, you’ll need to apply it per-platform inside individual widgets, then summarize manually. Annoying. The team is aware. Worth knowing before you set up the widget and wonder where your custom field went.
Step 3: Build the Engagement-to-Revenue Chain
Engagement metrics aren’t worthless. They’re leading indicators that map to a social media sales funnel — but only if you can show the chain to revenue.
Here’s the chain:
- Engagement to website traffic — UTM parameters and GA4 channel grouping
- Traffic to leads — goal completions, form fills, demo requests, content downloads
- Leads to revenue — pass UTM source and medium into your client’s CRM (HubSpot, Salesforce, whatever) so deal value flows back to the originating social touchpoint
Without that final CRM connection, social media ROI is always an estimate. Never a proof. Clients can tell the difference.
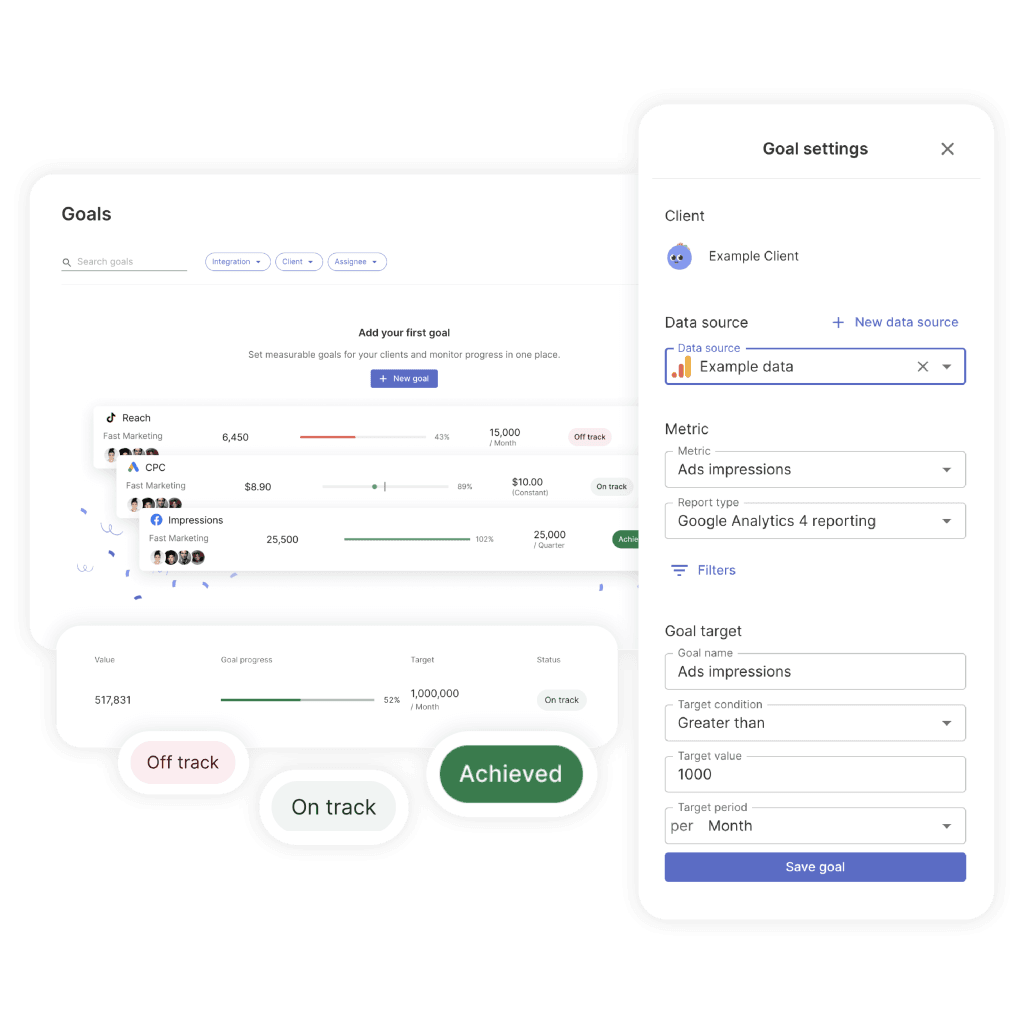
For pacing against the targets you set in Step 1, Goals in Swydo show On Track / Off Track / Achieved against any KPI. The math runs against what you’d expect at that point in the period. So a $20,000 monthly target halfway through the month flags as Off Track at $7,000 spent. No mental math required.
Step 4: Layer In Customer Lifetime Value
Single-purchase ROI undervalues social for any client with repeat business or subscriptions.
The CLV ROI formula:
Calculate CLV for social-acquired customers separately from other channels. And don’t assume social customers have higher LTV. Measure it on your client’s first-party data. Let the actual number drive the case.
Sometimes social customers have higher LTV. Sometimes lower. The honest answer wins.
Step 5: Quantify the Counterfactual
This is the layer most agencies skip. It’s also the one CFOs find most persuasive.
The counterfactual is the answer to: “What happens if we stop social?”
If you can answer that with specific numbers — paid search needs X% more budget, CAC rises Y%, lead volume drops Z% — you’ve moved from defending spend to advising on portfolio risk. Different posture. Different conversation.
Geo-incrementality tests give you this number. So does an MMM with a “what-if” scenario. Even rough estimates anchor the conversation in the right place.
We’ll come back to this in the defense playbook below.
The Modern Measurement Stack: Tools and Methods That Work
Your measurement stack has three layers. Each one solves a different problem.
| Layer | What It Does | What You Need |
|---|---|---|
| Data layer | Captures conversions in a privacy-resilient way | Server-side tracking, Conversions APIs |
| Attribution layer | Connects social activity to revenue | GA4, CRM integration, MMM or incrementality |
| Reporting layer | Pulls everything into one client-ready view | Agency dashboard like Swydo |
The Data Layer
Pixel-only tracking isn’t enough anymore. Privacy changes have eaten into what the pixel can see. And what it sees, it sees inconsistently.
For every paid client, set up:
- Meta Conversions API (CAPI) deduplicated with the pixel — and watch your Event Match Quality, which is one of the most underrated Facebook Ads metrics for diagnosing tracking health
- TikTok Events API
- Pinterest Conversions API
- Google Enhanced Conversions for Web
- Server-side Google Tag Manager container (ideal but not required day one)
Meta’s own data shows advertisers using both Pixel and CAPI see 13% lower cost per result and 19% more attributed purchase events compared to Pixel alone. That’s not a rounding error. That’s the difference between a renewal conversation and a “we’re moving in a different direction” email.
The Attribution Layer
Most of the tools you need are free.
GA4 gives you data-driven attribution at no cost. CRM integration with HubSpot, Salesforce, or Pipedrive closes the loop from lead to revenue. For MMM, Google Meridian and Meta Robyn are both open-source. Sellforte, Recast, and Keen are paid alternatives if you don’t have an analyst with the time.
For incrementality, Meta Conversion Lift, TikTok Brand Lift, and Google Brand Lift studies are free with sufficient ad spend.
The hard part isn’t the tools. It’s the discipline to use them consistently across every client.
The Reporting Layer
This is where agency life gets messy. You’re not running one brand. You’re running 8, 12, maybe 20. Single-brand tools don’t cut it.
You need a portfolio reporting platform that integrates with all the channels your clients run. And a way to see the whole book of business at once. Swydo’s Metrics Overview does that. Pick up to six KPIs. See them across every client on one page. Useful when your Tuesday-morning agenda is “which clients are off pace and need a call?”
Industry-Specific Approaches
One size doesn’t fit all. Here’s what to actually measure for each client type:
| Industry | Measurement Priorities | Window |
|---|---|---|
| E-commerce | Pixel + CAPI, GA4 Enhanced Ecommerce, UTMs, TikTok Shop / IG Shops attribution | 1–30 days |
| B2B | LinkedIn Campaign Manager + CRM, lead-quality scoring, pipeline contribution | 3–18 months |
| Healthcare/finance | Brand-lift studies, social listening, share of voice, compliant engagement | 6–24 months |
Don’t try to attribute individual conversions in regulated verticals. Measure brand impact and let other channels handle direct response. That’s a fight you don’t want to pick.
How to Measure ROI in AI Search and LLM Visibility
Here’s a metric most agencies aren’t reporting on yet. How often is your client’s brand cited in answers from ChatGPT, Gemini, Perplexity, and Google AI Overviews?
ChatGPT had 800 million weekly active users by late 2025. Gemini has surpassed 750 million monthly active users. AI Overviews now show up on a meaningful share of US searches. That’s a lot of eyeballs not seeing the traditional 10 blue links.
LLMs disproportionately cite content from Reddit, LinkedIn, YouTube transcripts, and authoritative blog posts. Translation? Your client’s social activity directly affects whether they show up in AI answers.
Three things to track:
- Brand citation frequency in AI answers (Profound, Peec.ai, and similar tools monitor this)
- Share of AI voice versus competitors for category queries
- Referral traffic from ChatGPT, Perplexity, and Google AI Overviews in GA4
Start reporting on this in your next QBR and you’re ahead of most agencies. Worth raising in your next pitch.
Social Commerce ROI: TikTok Shop, Instagram Shops, and Live Shopping
Social commerce is no longer a future bet. It’s a now bet. eMarketer projects US social commerce will exceed $100 billion in 2026. TikTok Shop alone surpasses $20 billion. 51% of US social shoppers buy on TikTok.
The good news for measurement? Social commerce ROI is now directly trackable on-platform. TikTok Shop, Instagram Shops, and Facebook Shops all report attributed GMV inside their dashboards. The TikTok Ads metrics most worth pulling into a client report are Complete Payment ROAS and cost per purchase. Those are the two that turn GMV into a defensible profit number.
The question shifts. It’s no longer “did social influence the sale?” It’s: “What was the platform-attributed GMV minus our cost of content, ad spend, and influencer fees, divided by that cost?”
Live shopping numbers are wild. Industry watchers consistently report live conversion rates running several times higher than static feed posts. For the right product, live is one of the highest-ROI tactics available right now.
Are any of your clients sitting on a great product story that would work live? Worth a pitch this week.
How to Measure Dark Social and Zero-Click Influence
Roughly 84% of online sharing happens privately. Through DMs, Slack, WhatsApp, email. None of it shows up in your tracker.
That’s dark social. And it’s a huge attribution gap.
Three tactics close it:
- Add a “How did you hear about us?” field to every form. Self-reported attribution is biased. But it’s recoverable signal you didn’t have before.
- Monitor branded-search lift in Google Search Console. When social activity drives discovery, you’ll see it in branded queries weeks later.
- Run geo-incrementality tests. Pause social in two markets. Hold others as control. Measure the revenue delta.
Dark social rarely shows up in Meta or GA4. It shows up in branded search and in what customers tell you. Listen for both.
How to Improve Social Media ROI
Five levers. The constant across all of them: decisions follow attribution data, not intuition.
Content Optimization
Identify which post types, topics, and formats drive the highest revenue per impression. Not the highest engagement. Those are different metrics. They don’t always agree.
Educational content addressing specific buyer pain points typically outperforms promotional content for both B2B and DTC. Behind-the-scenes content builds trust. Short-form video drives the highest measured engagement on every major platform. Long-form YouTube drives higher conversion rates for considered purchases.
The best test you can run? Look at your client’s last 90 days of posts. Sort by revenue per impression. See what’s at the top. Make more of that. For a starter framework on what to track post by post, our easy guide to social media analytics reporting walks through the core KPIs.
Audience Optimization
Build lookalike audiences from your client’s actual high-LTV customers. Not site visitors. There’s a difference, and it matters. Site visitors are who showed up. High-LTV customers are who paid. You want more of the second group.
Refine demographic targeting against conversion data, not engagement data. Use behavioral retargeting to reach users at the consideration moment.
Influencer ROI
Treat influencer spend as performance media. Because it is.
According to Influencer Marketing Hub research, nano-influencers (under 10K followers) average 5–10% engagement rates. Mega-influencers struggle with 0.5–2%. Huge gap. And nano-influencer audiences are usually more niche and more buying-intent.
Use unique tracking links and promo codes for direct attribution. Measure earned media value, sentiment lift, and the CLV of influencer-acquired customers. Not just reach.
Budget Allocation
A good default split:
- 60% to proven high-ROI activities
- 30% to scaling winners
- 10% to testing
Review monthly. Shift faster than you think you should. The cost of a slow reallocation is months of underperformance.
Platform Mix
Use each platform for its strength in the funnel. Instagram for awareness. Facebook for conversion. LinkedIn for B2B consideration. YouTube for deeper engagement. Retarget across platforms to reinforce the message.
Don’t run identical campaigns on every platform and call it a strategy. Most common mistake we see.
How to Translate Social Media ROI for Different Stakeholders
Good marketing reporting starts from a simple idea. The same data tells different stories to different people. Your job is to deliver the right version to each.
Same Data, Four Stories
How to translate ROI for each stakeholder
The agencies that figure this out keep their retainers.
Chief Financial Officer
Wants: defensible numbers
Lead with
Attributed revenue, CAC, counterfactual cost.
Chief Executive Officer
Wants: market position
Lead with
Competitive positioning, share of voice, growth.
Chief Marketing Officer
Wants: channel efficiency
Lead with
Channel efficiency, attribution methodology, what-if.
Marketing Manager
Wants: what to do next
Lead with
Executable insights and next-month plays.
Same numbers. Four different stories. The agencies that figure this out keep their retainers.
Writing four versions of the same QBR is a time-killer. Most account managers cut corners on it. Swydo AI has four built-in prompts — Summary, Wins, Issues, Recommendations — that pull from the report you already built and drop the output into a text widget. Works for a CFO summary or a marketing manager’s executive recap, depending on which prompt you use.
A Reporting Cadence That Fits Agency Workflows
Match reporting frequency to decision frequency. Anything more is noise. The trickier question is which artifact to send for each layer — that’s the dashboards vs. reports decision. Short answer: dashboards for the daily/weekly layer, reports for monthly and up.
The Cadence Map
Match reporting frequency to decision frequency
Anything more is noise. Anything less is missed signal.
Internal team
Community management, customer-service responsiveness.
Internal team
Pause underperformers, scale winners.
Mkt Manager + CMO
Attributed revenue, channel performance, adjustments.
CFO + CEO
ROI %, YoY comparisons, next-quarter plan.
Full leadership
Business outcomes, retention, market share, goal reset.
Avoid measuring brand-awareness campaigns weekly. Short windows produce noise that triggers premature optimization. You’ll panic. The campaign won’t have had time to work. Don’t do it to yourself.
For the daily and weekly layers, you don’t need a full report. You need a live view you can glance at. Monitoring Boards with alerts ping you by email when a KPI flips from green to red. Useful for catching a CPA spike on Wednesday instead of Friday afternoon when the client emails to ask why pacing looks off.
Common Pitfalls That Destroy Agency Credibility
Four pitfalls show up over and over. Avoid them and your agency is already ahead of most of the field.
Confusing Correlation With Causation. Website traffic increased during a social campaign. That doesn’t mean social caused it. Could be seasonality. Could be a competitor’s mistake. Could be PR. Could be paid search cannibalization. Run incrementality tests when stakes are high.
Reporting Vanity Metrics. Engagement without business context damages credibility. Always frame engagement as a leading indicator. “Our 47% engagement-rate increase drove 23% more qualified site visits and 12 demo requests worth $67,000 in pipeline.” That’s a sentence a CFO listens to.
Setting Unrealistic Expectations. Brand awareness needs 3–6 months minimum. Direct response can show in 2–4 weeks. B2B lead generation needs 2–6 months depending on cycle length. Calibrate the client at the start. Not after they’re frustrated.
Ignoring External Factors. Document seasonality, competitor activity, and macro conditions in every quarterly report. Performance data should always be read in context.
The Agency ROI Defense Playbook
When a client questions social media value, three responses work better than defensiveness:
- Acknowledge — they’re right to scrutinize the spend
- Reframe with data — show what social actually contributed
- Quantify the counterfactual — what happens if you stop
A model script (numbers below are illustrative; replace with the client’s actual data):
“You’re right to scrutinize every marketing investment. Here’s what the data shows: social has reduced your CAC by [X]% and lifted average deal size by [Y]% over the past two quarters. If we paused social, paid search would need to absorb [Z]% more budget to maintain lead volume at [N]% higher CAC. The cheaper option is to keep social running and reallocate within social toward the highest-performing tactics.”
The script works because it accepts the client’s framing — every dollar should be justified — supplies specific numbers, and shows the cost of the alternative. You’re not defending. You’re advising. Different posture. Different outcome.
A small thing that helps in this conversation. Send the supporting report from your agency’s own domain, not a generic SaaS link. Swydo’s white-label reporting features put the dashboard at reports.youragency.com. The client opens a link that looks like it came from your agency, not a third-party tool. Subtle. Matters when you’re the strategic adviser in the room.
Start Proving ROI Today
Pick your largest client. Do four things right now:
- Audit cost tracking — confirm staff time is captured, not just ad spend
- Implement a Conversions API for the largest paid social platform if it’s not already live
- Set up multi-touch attribution in GA4 and connect to the client’s CRM
- Schedule a 30-minute call with the client’s CFO or finance contact to confirm they trust the methodology before the next quarterly review
That’s it. None of it is glamorous. All of it works.
The agencies winning right now aren’t the ones with the prettiest dashboards. They’re the ones whose CFOs trust the numbers. Which one is your agency going to be?
If you want help pulling all this together across your client portfolio, Swydo is built for it. 14-day free trial, no credit card needed, 10 data sources included in the flat rate.
Build social media ROI reports your clients’ CFOs will actually trust.
Start Your Free Trial Today