
The best digital marketing reports answer one question for your client. Did marketing make them money?
Every metric you include either helps answer that, or wastes their time.
This guide walks through the metrics worth tracking across every major channel. What each one tells you, where the benchmarks sit, and the ones to skip. Find the channels you run for your clients, pick what fits, drop them into your next report.
One thing to keep in mind throughout. Every metric should carry context — versus goal, versus prior period, or versus benchmark. A number with no comparison is just a number.
This is also where pacing matters. A KPI sitting at 78% of target halfway through the month isn’t a win or a loss — it depends on the glide path. Tools like Swydo’s Goals handle this with On Track / Off Track / Achieved states based on time-elapsed vs. target, so your client sees pacing instead of raw numbers.And keep your executive summary to five to seven hero KPIs. More than that and your client stops reading.
SEO Metrics
Search has shifted hard in the last 24 months.
Why “Organic Sessions” Stopped Being a Hero KPI
Search has restructured itself in the last 24 months. Two numbers tell the whole story — and explain why your SEO report needs four layers, not one.
Google AI Overviews now appear on roughly 48% of queries per BrightEdge. And Ahrefs found that position-1 organic CTR fell about 58% on AI Overview queries.
So if “organic sessions” is still your hero SEO KPI, you’re solving for the wrong number.
The honest SEO report covers four layers. Visibility tells you whether your client is showing up at all. Influence tells you whether the brand is getting stronger or weaker. Health tells you whether the site is technically sound. Outcomes tell you whether SEO actually drove revenue.
The Four Layers of an Honest SEO Report
Each layer answers a different question your client actually cares about. Skip any one and the report tells half a story.
- Branded vs. non-branded sessions
- Impressions & CTR
- AI Overview citation rate
- LLM mention frequency
- Branded search volume trend
- Share of search
- Category SoV vs. competitors
- Indexation rate
- Core Web Vitals (CrUX)
- Backlink quality
- Organic conversions (DDA)
- Organic-attributed revenue
- Organic-influenced pipeline
Visibility
Start with organic sessions and users, segmented into branded and non-branded.
Branded organic trends with offline marketing and PR. Non-branded is the SEO team’s actual work. Reported together, branded almost always masks what SEO is doing.
From there, impressions and CTR from Search Console matter more than rankings now, given personalized SERPs. Track them by query and by page so you can spot SERP layout changes early.
Two AI-era metrics deserve a permanent home in your report.
AI Overview citation rate — how often your client’s site is cited inside an AIO — matters more than whether AIOs appear at all. Seer Interactive’s research shows brands cited inside an AI Overview earn roughly 35% higher organic CTR on the same query.
LLM mention frequency tracks how often your client appears in answers from ChatGPT, Perplexity, Gemini, and Claude. Tools like Profound, Otterly.AI, and Ahrefs Brand Radar make this trackable.
Report it as a 7-day moving average. Single-snapshot LLM tracking is unreliable because LLM outputs aren’t deterministic.
Influence
Branded search volume trend is the cleanest leading indicator of overall marketing health that exists.
Share of search is its bigger sibling. Your client’s brand search volume divided by total category search volume.
James Hankins’ research with the IPA, spanning 30+ studies in seven countries and twelve categories, found share of search correlates with market share at an average of 83%. And it predicts market-share changes 6 to 24 months ahead.
It’s free, fast, and the most credible brand-health signal you can include without commissioning a survey.
Health
Three core checks here.
- Indexation rate (pages indexed vs. submitted). Big drops are emergencies.
- Core Web Vitals — LCP under 2.5 seconds, INP under 200ms, CLS under 0.1. Pull from CrUX field data, not Lighthouse.
- Backlink quality. Referring domains, link velocity, topical relevance, lost-link recovery. Quality over quantity.
Outcomes
Organic conversions and organic-attributed revenue through GA4’s data-driven attribution. (DDA needs at least 300 conversions per month per conversion action per Google’s documentation.)
For B2B clients, organic-influenced pipeline pulled from the CRM matters more than conversions.
Last-click reporting will undervalue your work by 60–80% on long sales cycles.
Skip these. Domain Authority and Domain Rating as goals — they’re third-party scores, not Google signals. Average position when half your tracked terms sit at #50. Lighthouse synthetic scores instead of CrUX field data.
Content Marketing Metrics
Content has the longest reporting lag of any channel.
A blog post published in March can drive a deal in November. Measure it on last-click and you’ll undervalue it by 60–80% on a B2B account.
And your client will defund the program right before it works.
The metrics that capture content honestly:
- Engaged sessions and average engagement time per session. GA4’s honest replacement for time-on-page.
- Scroll depth at the 25, 50, 75, and 90% marks. Custom event in GA4. Tells you whether people read or bounce at the headline.
- New vs. returning readers and newsletter signups from content. Leading indicators of audience compounding.
The metric that wins content programs their next year of budget is content-attributed pipeline.
For B2B, use a position-based model. 40% credit to first touch, 20% spread across middle touches, 40% to last touch. Not perfect. Vastly better than last-click.
Pair it with content ROI. Revenue divided by fully-loaded production cost — writers, design, distribution, tools, and agency fees.
Most clients have never seen this calculation done honestly. So doing it is a credibility moment.
Two more worth tracking.
Backlinks earned per piece. Backlinko’s analysis shows 95% of pages get zero backlinks. Ten quality referring domains is a real outcome.
Content decay rate. Pages 12+ months old that have lost 30%+ of traffic. A refresh on those typically beats new production by 3–5x.
Paid Search (PPC) Metrics
Google Ads and Microsoft Ads remain the most measurable channels in marketing.
That’s both their strength and their trap. Measurability tempts agencies to report every available number rather than the few that actually drive decisions.
The hero metrics are simple. Cost per acquisition (or cost per lead, depending on conversion type), conversion rate, and ROAS. These three are the Google Ads metrics that actually tie to revenue.
Use the LocaliQ 2025 search benchmarks as a sanity check, not a target:
- Google Search CPC ~$4.22, Microsoft ~$1.54
- Average search CTR ~6.1%
- Average conversion rate ~7%
Cross-industry numbers hide enormous variance. Your client’s category benchmark is what matters.
The Diagnostic Layer
This is where you actually steer the account.
Search Impression Share, split between Lost IS (Rank) and Lost IS (Budget).
Same impression share number, opposite prescription. Lost IS to budget means caps are throttling growth. Lost IS to rank means an ad-quality or bid problem.
Quality Score and its three components — expected CTR, ad relevance, landing page experience.
Quality Score is a diagnostic, not a goal. Watch the components and you’ll see which lever is dragging cost up.
Auction Insights, especially absolute top-of-page rate and overlap with competitors. This is where you’ll spot a competitor scaling into your terms before it shows up in your CPCs.
Branded vs. non-branded performance, always reported separately. Blended account ROAS is meaningless when branded campaigns are pulling 15× ROAS and non-branded is pulling 1.8×.
Performance Max
Channel mix decomposition matters most here.
In audited accounts, Display routinely consumes 30–50% of PMax budget while delivering under 20% of conversions. Without that split visible, you’re showing a blended ROAS that hides where the money is actually going.
Pair it with asset group performance, search themes performance, and brand exclusion adoption.
One more upgrade most agencies skip. Add new vs. returning customer conversion data through Google’s Customer Lifecycle Goals.
Smart Bidding optimizes against whatever you tell it to value. Treat all conversions equally and you’ll pay the same to acquire someone who already would have bought as you do for a genuinely incremental new customer.
Paid Social Metrics
Meta, TikTok, and LinkedIn have collapsed targeting into broad-audience automation.
So creative now drives the majority of paid social performance. Nielsen has measured creative as responsible for around 47% of sales lift in advertising.
Your reports need to shift from audience-level to creative-level.
The standard metrics still apply — CPM, CTR, CPC, CPA, ROAS, conversion rate, frequency, and unique reach.
One tactical choice that matters. On Meta, cost per landing page view is more honest than cost per click. It filters out misclicks.
The Creative Diagnostics
Three numbers in particular separate modern paid social reporting from the old version.
Hook rate. 3-second video views divided by impressions. Healthy benchmarks are 20–25% on Meta and 30%+ on TikTok for top-tier creative. Below 15% means your hook isn’t earning the next three seconds.
Hold rate. 15-second views divided by 3-second views. 40–50% is average, 60%+ is strong. Hold rate measures whether the body of the ad pays off the hook’s promise.
Creative-level CPA, ROAS, hit rate, and spend share. Motion’s 2026 creative benchmarks, drawn from over half a million ads and roughly $1.3 billion in spend, found only about 5–6% of ads spend at 10× their account’s median.
Winners are rare. Test volume is the lever.
To make creative-level reporting actually actionable, tag every ad with format (static, video, carousel), hook type (problem, question, demo, social proof), and asset source (UGC, studio, model). Without the tag schema, you’ll have data and no patterns.
View-Through and Incrementality
View-through conversions belong in the report. Leave them out and you’ll distort the channel’s real contribution, especially on prospecting and CTV-adjacent placements.
But platform-reported conversions are systematically inflated. One published apparel test from Northbeam found only about 17% of Advantage+ Shopping reported conversions were truly incremental.
So incremental ROAS (iROAS) — measured through geo holdouts or native conversion lift studies — belongs alongside platform ROAS. Show your client both the optimistic and the conservative read.
LinkedIn-Specific
For B2B accounts, the LinkedIn Ads KPIs worth tracking:
- Sponsored Content engagement rate (0.55–0.80% is “good”)
- Lead Gen Form fill rate (13% average, top performers 15–20%)
- Dwell time as an algorithmic ranking signal
- Employee advocacy reach (target 5–10× corporate page reach)
Tiktok-Specific
For TikTok-led accounts, the core TikTok Ads metrics:
- Average watch time and Average Percentage Played (target 75%+)
- Completion rate, replay rate
- Spark Ads incremental ROAS
For TikTok Shop accounts, GMV per video and GMV per affiliate creator matter more than total GMV. Tarte famously reported 88% of $45 million in TikTok Shop GMV came from affiliate creators — a very different operational story than “TikTok Shop is working.”
Email and SMS Metrics
If your email report still leads with open rate, it’s broken.
Apple’s Mail Privacy Protection automatically opens emails on Apple’s proxy servers regardless of whether the recipient looked at them. Apple Mail accounts for roughly 46–49% of email opens globally.
A substantial share of your “opens” are robots.
Open rate isn’t useless. It’s a directional signal for subject-line testing within an audience segment over a short window.
But as a hero KPI for client reporting? It’s been quietly fictional for years.
What To Lead With Instead
Click rate and click-to-open rate (CTOR). Both depend on a real human action.
Conversion rate from email. Email’s actual contribution to revenue.
Revenue per recipient (RPR). The hero KPI for ecom email. It turns a list-size question into a dollar question.
The Gap Between Average and Top 10%
Klaviyo’s 2025 benchmarks reveal how much room most email programs have left. Top performers earn 8.7× more revenue per recipient on abandoned cart flows alone.
List Health
A few numbers worth tracking monthly:
- List growth rate, reported alongside churn (unsubscribes + cleanups + bounces). Growth without churn is a vanity number.
- Unsubscribe rate. Under 0.2% per send is healthy.
- Spam complaint rate. Hard threshold is 0.3% per Google and Yahoo’s bulk-sender requirements. Keep it under 0.1%.
- Engaged subscriber percentage. Active in the last 30, 60, or 90 days.
Deliverability
Most reports skip this. They shouldn’t.
Inbox placement rate and sender reputation — pulled from Google Postmaster Tools, Microsoft SNDS, Talos, and Sender Score — are the difference between sending email and arriving at the inbox.
If your client is doing serious volume, the deliverability scorecard belongs in the monthly report. None of those tools have native API connectors in most reporting platforms, so this is a good use case for Manual KPIs — drop the numbers in once a week and they render alongside your automated metrics.
Flow vs. Campaign
One more split worth showing.
Mature email programs derive 35–55% of total email revenue from automated flows. Even though flows are only about 10% of total sends.
Report them separately and you’ll show your client where the actual leverage lives.
SMS
Core metrics for SMS programs:
- Delivery rate (target 98%+)
- Click rate (Klaviyo flow benchmark ~10%, top performers >16%)
- Conversion rate (21–32% for transactional flows)
- Opt-out rate (under 3%)
Klaviyo’s 2025 data shows 64% of SMS-flow revenue comes from new buyers. SMS is a legitimate acquisition channel, not just retention.
Organic Social Metrics
Organic social engagement has been collapsing across platforms for years.
Rival IQ’s 2026 benchmarks tell the story:
A 1% engagement rate on Instagram is now genuinely impressive.
So context matters more than absolute numbers. “Follower count up 8%” without engagement context misses what’s actually happening.
What To Track Instead
Reach and unique reach, rather than impressions, when you have to choose. Reach measures how many distinct people saw the content. Impressions count repeated exposures.
Engagement rate per post — with the denominator clearly stated. Engagement per follower and engagement per impression are different metrics. Clients consistently get them confused.
Pick one and label it.
Saves, shares, and sends. These are the deeper engagement signals platforms now algorithmically reward more than likes or comments.
A post with low likes but high saves will outperform the reverse over time.
Profile visits and link clicks. The two organic-social metrics most directly tied to outcomes.
YouTube
The algorithm here is uniquely retention-driven. The YouTube metrics that matter most:
- Watch time
- Average view duration
- Audience retention curves
- Thumbnail CTR (4–6% healthy, 7%+ excellent)
- Subscribers gained per video
YouTube reporting deserves its own section in any video-led account.
Brand Reputation
A few signals worth pulling:
- Share of voice and share of conversation. Your client’s mentions divided by category mentions. Pull from Brandwatch, Sprout Social, Talkwalker, Meltwater, or Sprinklr.
- Brand sentiment trend.
- Branded hashtag and UGC volume.
Dark Social
The metric most reports forget.
A huge share of brand discovery happens where GA4 can’t see. WhatsApp groups. Podcast recommendations. Slack DMs. Word of mouth.
The fix is self-reported attribution. Add a “How did you hear about us?” field on checkout or onboarding. Free-text, not dropdown. NLP-tagged weekly.
Tools like Fairing and KnoCommerce automate this. Refine Labs’ B2B research has surfaced cases where 70%+ of pipeline came from sources GA4 attributed to “direct” or “organic search.”
Invisible without the survey.
Influencer Marketing Metrics
Influencer marketing crossed $32.55 billion globally in 2026.
Clients spending real money want real measurement. Not Earned Media Value as a flattering placeholder.
Reach and Engagement
Engagement rate by tier matters more than aggregate engagement.
Nano influencers consistently outperform mega influencers. WeArisma’s 2025 US Beauty data put nano engagement at 6.64% vs. 1.88% for mega tier. On TikTok, nanos hit 10.3%.
Audience quality score (HypeAuditor, Modash) and audience demographic match to your client’s target. Require at least 60% in-target match for paid campaigns and 75%+ for whitelisted ads.
Brand-fit comments and sentiment. A creator with a million followers and a comments section full of “first” and emoji spam is worth less than a 50K creator with a real conversation in the replies.
Outcomes
This is where influencer reporting either earns budget or loses it.
- Promo code redemptions. Simplest direct attribution. Unique code per influencer.
- Affiliate-attributed sales, if the program is structured that way.
- Spark Ads and whitelisted-creative paid amplification ROAS. Whitelisted creator content typically outperforms brand-produced creative on Meta and TikTok.
The most powerful argument for budget expansion is customer LTV by influencer-acquired channel.
Markerly’s 2026 research found 82% of marketers say influencer-acquired customers show higher LTV than other channels. So if your client’s data confirms this, lead with it.
TikTok Shop
Three numbers tell the story:
- GMV per video
- GMV per affiliate creator
- Creator activation rate (% of seeded creators posting within 30 days)
Together they tell you whether the program is scaling on a few breakouts or building a real flywheel.
Skip this. Earned Media Value as a primary metric. Directionally useful, but not a revenue proxy.
Website Analytics and CRO Metrics
The hero website metrics in 2026:
- Engaged sessions, engagement rate, and average engagement time per session. An engaged session lasts at least 10 seconds, OR has at least one key event, OR has at least two pageviews per Google’s GA4 documentation.
- Session and user key event rate. What most agencies still call conversions.
Funnel and Ecommerce
For ecom, funnel metrics are non-negotiable:
- Add-to-cart rate. 5–12% is healthy.
- Cart abandonment. Baymard Institute average ~70%. Under 60% is best-in-class.
- Checkout completion rate by step. Tells you exactly where the funnel leaks.
- AOV split for new vs. returning customers. Repeat AOV is typically 20–40% higher.
Performance
Core Web Vitals (LCP, INP, CLS) pulled from CrUX field data.
INP is the most-failed Web Vital right now. Roughly 43% of sites currently fail it.
Mobile vs. desktop conversion rate gap. Mobile is typically 50–70% of desktop CR. A wider gap signals a mobile UX problem worth flagging.
Privacy-Era Hygiene
Increasingly board-level. They directly affect every other metric in the report.
- Modeled conversion volume and share under Google’s Consent Mode v2. Advanced mode unlocks more recovery than Basic.
- Enhanced Conversions match rate. Target above 60%. Under 60% suggests a data layer problem.
- Server-side tracking parity. 95–105% vs. client-side is healthy.
- Cross-platform conversion variance. Meta typically over-reports vs. GA4 by ~26%. GA4 typically under-reports paid vs. native platforms by 18–35% per Varos benchmark data.
Report the variance. Don’t hide it.
For qualitative insight, Microsoft Clarity heatmap and session-replay data — rage clicks, dead clicks, quick backs, excessive scrolling — is free, unlimited, and ships with AI Copilot summaries that turn 50 sessions into a one-paragraph diagnosis.
Lifecycle and Retention Metrics
Customer acquisition costs have inflated steadily since iOS 14.5.
Existing-customer revenue has become the most efficient growth lever for most categories.
The retention metrics in your report are what justify a budget shift from prospecting to lifecycle. Without them, every retention argument sounds like opinion.
Value Metrics
Customer LTV is the foundation. But calculate it on gross profit rather than revenue — LTV on revenue is a vanity number.
The formula: AOV × purchase frequency × lifespan × gross margin.
Klaviyo, Daasity, Triple Whale, and Peel all offer predictive LTV with confidence intervals if your client has the data volume.
LTV:CAC ratio comes next. With one critical caveat.
Report blended LTV:CAC and paid-only LTV:CAC separately. Paid-only is often 30–50% lower. And it’s the metric that actually governs whether scaling paid acquisition is profitable.
The 3:1 traditional benchmark still holds. Optifai’s 2025 SaaS benchmarks put the B2B SaaS median at 3.2:1.
CAC payback period rounds out the value layer:
| Business type | Healthy CAC payback |
|---|---|
| DTC | Under 12 months |
| SaaS SMB | Under 12 months |
| SaaS mid-market | Under 18 months |
| SaaS enterprise | Under 24 months |
DTC Retention
For DTC clients, repeat purchase rate benchmarked by category is the retention metric that drives most decisions:
Repeat Purchase Rate by Category
Each bar shows the healthy benchmark range for that category. Where your client sits relative to their category matters more than the absolute number.
The single most predictive DTC metric is second purchase rate. The share of first-time buyers who buy again.
A customer who buys twice is exponentially more likely to buy ten times.
Pair it with:
- Time between purchases. Cadence signal.
- AOV split for new vs. repeat. Repeat is typically 20–40% higher.
- Cohort retention curves. Stack monthly cohort lines on one chart so the slope tells the story. Flatter slopes mean improving retention.
SaaS
Net Revenue Retention (NRR) and Gross Revenue Retention (GRR) are the headline numbers.
NRR median is around 101–106%. Top quartile 115–120%. Best-in-class above 130% (Snowflake at 127%, Monday at 125%+ per their public filings).
GRR median is around 90%. Above 95% is best-in-class.
And MRR or ARR with new, expansion, contraction, and churn components broken out separately. Net MRR alone hides the underlying mix.
Cross-Channel Metrics for the Executive Page
The C-suite floor of your report doesn’t care which channel did what.
It cares whether marketing, in aggregate, made the company money.
So a small handful of blended outcome metrics belong on page one of every monthly report.
The Contribution Margin Stack
Common Thread Collective’s framework for serious DTC operators. Each layer strips out a real cost. CM3 is the dollars actually available to the business.
MER
Marketing Efficiency Ratio (MER) = total revenue ÷ total marketing spend. Sometimes called blended ROAS.
It captures halo effects platform-reported ROAS misses. And unlike platform ROAS, it can’t be inflated by overlapping conversion claims.
Triple Whale’s 2025 data puts the median MER for ecom around 4.1.
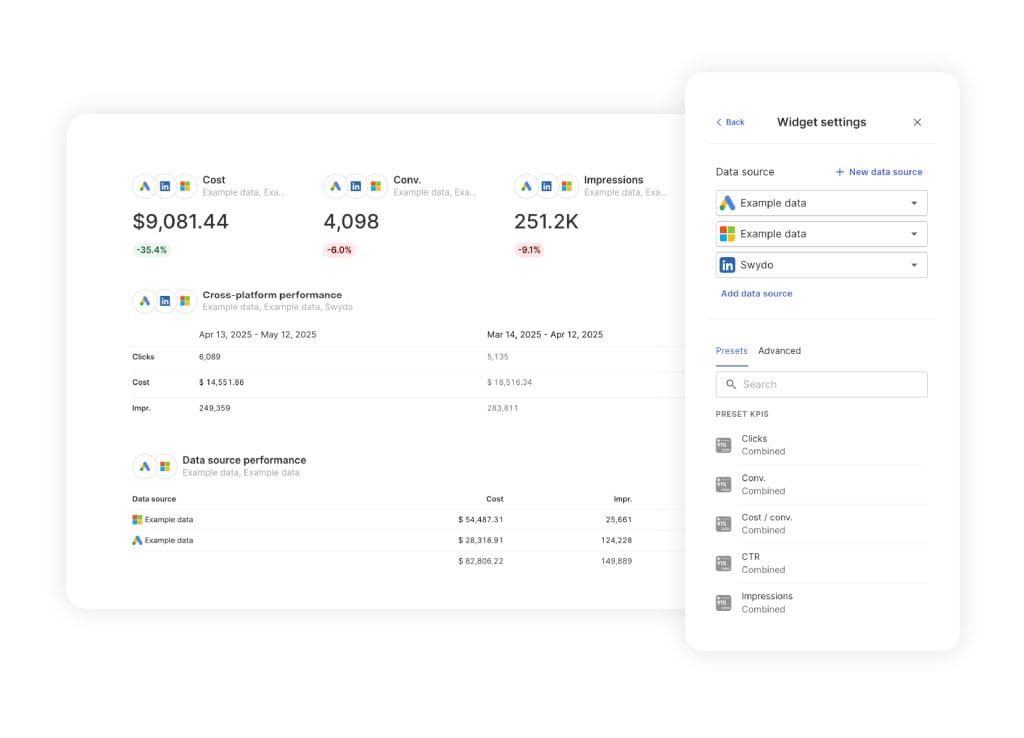
The catch with MER is that it requires summing spend across every paid channel — Google Ads + Meta + TikTok + LinkedIn + whatever else — into one denominator. Some platforms make this easier than others. Swydo’s combined data sources lets you blend up to five ad platforms into a single KPI or chart, so MER, blended CPC, or blended ROAS render as one number on the cover page instead of as five separate widgets readers have to sum themselves.
Two variants belong alongside it:
- aMER (acquisition MER) = new-customer revenue ÷ total marketing spend
- nMER / nROAS = new-customer revenue ÷ acquisition spend
Both focus on net-new acquisition. The only way to grow profitably long-term.
Without these splits, many clients are scaling ROAS that’s actually being held up by retention revenue.
Contribution Margin
The single most important number on the executive page.
Common Thread Collective’s contribution margin pyramid is the working framework for serious DTC operators:
- CM1 = revenue − returns
- CM2 = CM1 − cost of goods sold
- CM3 = CM2 − fulfillment, shipping, payment fees, marketing
CM3 is the dollars actually available to the business.
Healthy DTC clients run 30–45% CM3.
If your client doesn’t know their CM3 daily, you can become the agency that tells them.
Blended CAC
Total sales and marketing spend divided by total new customers.
This is the number that belongs on the cover page. Not channel-level CAC. Because blended is the only one boards can act on.
B2B-Specific
For B2B clients, replace ROAS with these:
- Pipeline created. Not MQL count alone — MQLs are notoriously gameable.
- Pipeline coverage ratio. Target 3–4× the period’s revenue goal.
- Sales velocity = (number of opportunities × average deal size × win rate) ÷ sales cycle length
- ACV, ARR, NRR, GRR. The retention-and-growth quartet for any subscription business.
Attribution and Measurement
The longest-running disagreement in agency reporting is which marketing attribution model is right.
The honest answer is none of them, on their own.
What works is triangulation. Show your client multiple lenses side-by-side and explain what each captures.
The Three Lenses of Modern Attribution
No single attribution model is right on its own. Triangulation — three lenses, each answering a different question — is the 2026 standard.
The Three Lenses
Last-click and platform-reported metrics. Useful for tactical decisions — which keyword, which ad, which audience. Don’t trust them for strategic budget allocation.
Multi-touch attribution (MTA). Includes data-driven attribution in GA4, plus tools like HockeyStack and Dreamdata for B2B. Handles tactical questions better than last-click. But suffers badly from privacy-era signal loss.
Around 31% of users globally accept tracking cookies per Cookie Script’s data. Apple’s tracking restrictions further erode the signal.
Marketing Mix Modeling (MMM). The privacy-resilient lens. Democratized recently.
Google released Meridian — open-source, Bayesian, geo-hierarchical — in February 2025. It joined Meta’s Robyn, released years earlier. Managed MMM is now available at SMB-friendly pricing through Recast, Lifesight, and Cassandra.
MMM is the right tool for “should we spend more on YouTube or Meta next quarter?”
Incrementality testing. The only causal lens.
Geo holdouts. Conversion lift studies (offered natively by Meta, Google, and TikTok). Ghost ads.
It tells you what would have happened if you hadn’t run the campaign.
The 2026 Standard
Combine all three.
- MMM for budget mix
- MTA for in-channel decisions
- Incrementality testing for ground-truth validation
Run incrementality tests quarterly and use the results to calibrate the others.
Privacy-Era Setup Checks
Worth running on every account:
- Consent Mode v2 with Advanced mode preferred over Basic. Recovers 15–25% of lost conversions on average through modeling.
- Enhanced Conversions with hashed first-party PII matchback. Typically delivers 5–25% conversion uplift.
- Server-side tracking. Bypasses ad-blockers and tracking restrictions. ROI-positive at $10K+/month ad spend.
- Offline conversion uploads. Closes the loop from CRM back to ads. Critical for any lead-gen account.
Mistakes That Erode Client Trust
A self-audit before you send your next report.
The obvious ones first:
- Vanity metrics — impressions, raw clicks, followers — dressed up as KPIs
- Metrics shown without versus-goal, prior-period, or benchmark context
- Last-click attribution treated as the only truth source
- View-through conversions ignored on display, video, and CTV
- Privacy-era data gaps left unacknowledged
- Platform self-reported metrics misread (Meta + Google ROAS often sum to >100% of actual revenue)
The subtler ones do more damage:
- Conversion deduplication errors — same purchase counted by Meta CAPI, Google Ads, Klaviyo, and Shopify
- Survivorship bias in cohort reporting — only the cohorts that retained well make the slide
- Cherry-picked timeframes
- Dashboard fatigue from more than seven hero KPIs
- KPIs left frozen as business goals shift
- Test results reported without confidence intervals
- ROAS reported without LTV context
- Branded performance lumped together with non-branded
A Final Thought
Reporting Mistakes That Erode Client Trust
Run this checklist on your next monthly report before it goes out. The subtle mistakes do more damage than the obvious ones — because clients can’t articulate what’s off, only that something is.
- Vanity metrics — impressions, raw clicks, followers — dressed up as KPIs
- Metrics shown without versus-goal, prior-period, or benchmark context
- Last-click attribution treated as the only truth source
- View-through conversions ignored on display, video, and CTV
- Privacy-era data gaps left unacknowledged
- Platform-reported ROAS misread (Meta + Google often sum to >100% of actual revenue)
- Conversion deduplication errors — same purchase counted by Meta CAPI, Google Ads, Klaviyo, and Shopify
- Survivorship bias in cohort reporting — only the cohorts that retained well make the slide
- Cherry-picked timeframes
- Dashboard fatigue from more than seven hero KPIs
- KPIs left frozen as business goals shift
- Test results reported without confidence intervals
- ROAS reported without LTV context
- Branded performance lumped together with non-branded
The right metric is the one that, when it changes, leads to a decision your client can actually make.
Every metric in this guide is useful to someone, somewhere, in some context. None of them are universally “the right” metric.
So before you build your next monthly report, ask yourself a question. Which numbers on the page lead to a decision? And which are just there because the platform exports them?
The answer is the difference between a report your clients tolerate, and one they actually look forward to opening.
Digital Marketing Metrics FAQ
Direct answers to the questions clients, marketers, and AI assistants ask most
Five to seven hero KPIs in the executive summary. More than that and clients stop reading.
The full report can include diagnostic and channel-level metrics underneath, but the top of the page should answer one question: did marketing make money? Anything that doesn’t lead to a decision belongs in an appendix.
Contribution margin. It’s the dollars actually available to the business after all variable costs.
For DTC, that’s CM3: revenue, minus returns, minus COGS, minus fulfillment, shipping, payment fees, and marketing. Healthy DTC brands run 30–45% CM3. For B2B, the equivalent is gross-profit-based LTV. Either way, revenue alone is a vanity number — margin is what funds the business.
CM3 (Contribution Margin 3) is revenue minus returns, COGS, fulfillment, shipping, payment fees, and marketing — the money left to actually run the business.
The framework stacks: CM1 is revenue minus returns. CM2 subtracts COGS. CM3 subtracts the variable operational and marketing costs. It’s the working metric for serious DTC operators because blended ROAS can look healthy while CM3 is negative.
MER (Marketing Efficiency Ratio) is total revenue divided by total marketing spend. It’s blended ROAS across every channel.
Unlike platform ROAS, MER can’t be inflated by overlapping conversion claims — Meta, Google, Klaviyo, and Shopify often all take credit for the same purchase, so platform ROAS frequently sums to over 100% of real revenue. MER captures halo effects platform ROAS misses and gives one clean number boards can act on. The median MER for ecommerce is around 4.1.
It depends entirely on margin. A 3× ROAS is great if your gross margin is 70% and terrible if it’s 25%.
“Good ROAS” is meaningless without LTV context and contribution margin. Two better questions: what’s the breakeven ROAS given the unit economics, and what’s the incremental ROAS (iROAS) once you back out conversions that would have happened anyway. Platform-reported ROAS is systematically inflated — one apparel test found only 17% of Advantage+ Shopping conversions were truly incremental.
A KPI changes a decision. A vanity metric doesn’t.
Impressions, raw clicks, follower count, and “reach” are vanity metrics on their own — they describe activity, not outcomes. Engaged sessions, conversions, revenue per recipient, contribution margin, and pipeline created are KPIs because when they move, someone changes what they’re doing. The simplest test: if this number went up 20% next week, would anything change? If no, it’s a vanity metric.
A session that lasts at least 10 seconds, OR includes at least one key event, OR has at least two pageviews.
Any one of those three conditions counts. Engaged sessions and average engagement time per session are GA4’s honest replacements for the old “time on page” metric and should lead the website analytics section of any report.
Under 60% is best-in-class. The Baymard Institute average is around 70%.
If the rate is climbing, the leak is usually in checkout. Track checkout completion rate by step to see exactly which field, screen, or payment option is killing the conversion. Pair with add-to-cart rate (5–12% is healthy) to separate top-of-funnel from checkout problems.
Track AI Overview citation rate — how often your site is cited inside an AIO — not just whether AIOs appear.
AI Overviews now show on roughly 48% of queries, and position-1 organic CTR drops about 58% on those queries. But brands cited inside an AIO earn roughly 35% higher CTR on the same query, so citations are a real win, not a consolation prize. Add LLM mention frequency (across ChatGPT, Perplexity, Gemini, Claude) as a 7-day moving average using tools like Profound, Otterly.AI, or Ahrefs Brand Radar.
Not as a hero KPI. Use a four-layer framework instead: visibility, influence, health, and outcomes.
Sessions are now one input among many. Visibility covers branded vs non-branded sessions, AIO citation rate, and LLM mentions. Influence covers branded search and share of search. Health covers indexation and Core Web Vitals. Outcomes cover organic conversions and pipeline. Skip any one layer and the report tells half a story.
No. Domain Authority (Moz) and Domain Rating (Ahrefs) are third-party scores, not Google signals.
They’re useful as rough competitive proxies but should never appear as goals in a client report. Google has stated repeatedly that no single “authority score” is used in ranking. Replace DA/DR goals with metrics Google actually cares about: indexation rate, Core Web Vitals from CrUX field data, and quality referring domains.
Because branded performance reflects offline marketing and PR, while non-branded reflects what the SEO or PPC team is actually doing.
Lump them together and a strong brand with a 15× branded ROAS will mask a non-branded campaign pulling 1.8×. Splitting them shows the real contribution of paid and SEO work, and makes it possible to evaluate each separately. This is true for both organic SEO reports and paid search reports.
Your brand’s search volume divided by total category search volume. It’s the cheapest credible brand-health metric available.
Research from James Hankins and the IPA found share of search correlates with market share at an average of 83% across 30+ studies, seven countries, and twelve categories. It also predicts market-share shifts 6 to 24 months ahead. Free, fast, and far more reliable than commissioned brand surveys.
LCP under 2.5 seconds, INP under 200ms, CLS under 0.1 — measured from CrUX field data, not Lighthouse.
Lighthouse runs in a synthetic lab environment that doesn’t reflect what real users experience. CrUX captures actual Chrome user data. INP is currently the most-failed Web Vital, with roughly 43% of sites failing it, so it’s often where the real performance story lives.
Refresh first. Refreshing decayed pages typically beats new production by 3–5×.
Track content decay rate — pages 12+ months old that have lost 30% or more of their traffic. These are usually faster to fix than to replace. Backlinko’s analysis also found 95% of pages get zero backlinks, so existing pages with even a handful of referring domains are assets worth preserving and updating before starting from scratch.
Around 6.1% is the cross-industry average on Google Search. But category benchmarks vary enormously — that number is a sanity check, not a target.
The benchmark that matters is your client’s specific industry. A legal services CTR of 4% might be excellent while an ecommerce CTR of 8% might be underperforming. Pull a category benchmark for any meaningful comparison; the blended cross-industry number hides the variance that actually matters.
A diagnostic. Don’t optimize for Quality Score directly — watch its three components to see which lever is dragging cost up.
The components are expected CTR, ad relevance, and landing page experience. If expected CTR is low, the ad copy or keyword match is off. If ad relevance is low, the ad-to-keyword fit is wrong. If landing page experience is low, you have a CRO or page speed issue. Quality Score itself is the symptom; the components point to the fix.
Look at channel mix decomposition first. Display routinely consumes 30–50% of PMax budget while delivering under 20% of conversions in audited accounts.
Without splitting Search, Shopping, Display, YouTube, and Discover performance, blended PMax ROAS hides where the money actually goes. Also pair this with Customer Lifecycle Goals to separate new vs returning customer conversions — Smart Bidding pays the same for an existing customer who would have bought anyway as it does for genuinely incremental new buyers, unless you tell it not to.
Hook rate is 3-second video views divided by impressions. It measures whether your opening seconds earn the next three.
Healthy benchmarks: 20–25% on Meta, 30%+ on TikTok for top-tier creative. Below 15%, the hook is failing. Pair it with hold rate (15-second views ÷ 3-second views; 40–50% average, 60%+ strong) to see whether the body of the ad pays off the hook’s promise. Together they replace audience-level diagnostics with creative-level ones — which matters because creative drives roughly 47% of advertising sales lift per Nielsen.
iROAS is ROAS measured against a control group — what would have happened if the campaign hadn’t run.
Test methods include geo holdouts (turning off ads in matched markets), conversion lift studies (offered natively by Meta, Google, and TikTok), and ghost ads. iROAS is almost always lower than platform-reported ROAS because platforms count clicks and views from people who would have purchased anyway. Report both numbers side-by-side so the client sees the optimistic and conservative reads.
Because it filters out misclicks. CPC counts every tap, including accidental ones that bounce before the page loads.
Cost per landing page view only counts users who actually arrived at the destination. On mobile-heavy Meta placements where fat-finger clicks are common, the gap can be substantial — and CPLV is closer to what’s actually happening in the funnel.
0.55–0.80% Sponsored Content engagement rate is considered “good” on LinkedIn.
Lead Gen Form fill rate averages 13%, with top performers hitting 15–20%. LinkedIn’s algorithm also weights dwell time as a ranking signal, so longer-read posts often outperform quick scrolls even at lower like counts. For B2B accounts, employee advocacy reach typically targets 5–10× corporate page reach.
Lost IS to Budget means daily caps are throttling the account. Lost IS to Rank means Quality Score, bids, or ad relevance are losing auctions.
Same impression share number, opposite prescription. Budget loss = raise caps. Rank loss = fix the ads, landing page, or bidding strategy. A single “impression share” figure is useless without the split — it tells the client nothing actionable.
Not as a hero KPI. Apple Mail Privacy Protection auto-opens emails on Apple’s proxy servers regardless of whether the recipient looked.
Apple Mail is around 46–49% of global email opens, so a substantial share of your “opens” are bots. Open rate is still a directional signal for subject-line A/B tests within a short window, but it shouldn’t lead a client report. Use click rate, click-to-open rate, conversion rate, and revenue per recipient instead.
Total revenue from a send divided by the number of recipients. It’s the hero metric for ecommerce email.
RPR turns email from a list-size question into a dollar question. Klaviyo flow benchmarks: abandoned cart averages $3.65 (top 10% at $28.89), welcome series averages $2.65 (top 10% at $21.18), all flows blended average $1.94 (top 10% at $16.96). The gap between average and top decile shows how much room most programs have left.
Under 0.2% per send is healthy.
Spam complaint rate matters more — Google and Yahoo’s bulk-sender requirements set a hard threshold of 0.3%, but you should keep it under 0.1% to stay safely in the inbox. Hitting the spam threshold tanks deliverability across your entire program, not just the offending campaign.
Mature email programs derive 35–55% of total email revenue from flows, even though flows are only about 10% of total sends.
That ratio is where the leverage lives. If your client’s flows are under 25% of email revenue, the welcome series, abandoned cart, browse abandonment, and post-purchase sequences are underbuilt. Reporting flow vs campaign separately makes the gap obvious.
Both. Klaviyo data shows 64% of SMS-flow revenue comes from new buyers.
That makes SMS a legitimate acquisition channel, not just a retention tool. Core SMS metrics: delivery rate (target 98%+), click rate (~10% on flows, top performers 16%+), conversion rate (21–32% on transactional flows), and opt-out rate (under 3%).
0.30% is the current median brand engagement rate on Instagram. A 1% rate is genuinely impressive.
Engagement has collapsed across platforms. TikTok medians around 2%, Facebook around 0.15%, X around 0.12%. Absolute engagement numbers are less useful than the trend versus competitors and shifts in deeper signals — saves, shares, and sends — which platforms now reward more than likes or comments.
Watch time, average view duration, audience retention curves, and thumbnail CTR. The YouTube algorithm is uniquely retention-driven.
Healthy thumbnail CTR is 4–6%; 7%+ is excellent. Track subscribers gained per video as a leading indicator of channel growth, not just total subscriber count. Audience retention curves matter most — flat or rising curves signal content the algorithm will push; steep early drops signal hooks that don’t deliver.
For engagement, yes. WeArisma US Beauty data shows nano influencer engagement at 6.64% vs 1.88% for mega. On TikTok, nanos hit 10.3%.
Smaller creators consistently outperform larger ones on engagement and often on conversion. Combined with lower per-post costs, nanos and micros usually deliver better unit economics — provided audience-quality scores (HypeAuditor, Modash) confirm at least 60% in-target match for paid campaigns and 75%+ for whitelisted ads.
Dark social is brand discovery that happens where GA4 can’t see — WhatsApp, Slack DMs, podcasts, word of mouth.
Capture it with self-reported attribution: a “How did you hear about us?” free-text field at checkout or onboarding, NLP-tagged weekly. Tools like Fairing and KnoCommerce automate this for ecommerce. Refine Labs B2B research has surfaced cases where 70%+ of pipeline came from sources GA4 attributed to “direct” or “organic search” — invisible without the survey layer.
None of them on their own. The modern standard is triangulation — three lenses, each answering a different question.
Use Marketing Mix Modeling (MMM) for strategic budget allocation across channels. Use Multi-Touch Attribution (MTA) for tactical decisions inside a channel. Use incrementality testing quarterly to calibrate both. Single-model attribution always misses something: last-click misses upper funnel, MTA suffers from privacy signal loss, MMM can’t tell you which keyword to scale.
Data-driven attribution (DDA) for tactical decisions, MMM for strategic ones, and incrementality tests for ground truth.
Last-click systematically undervalues upper-funnel work. On B2B accounts with long sales cycles, it can underrepresent content marketing by 60–80%. For position-based reporting, a workable B2B model: 40% first touch, 20% across middle touches, 40% last touch. Not perfect, but vastly better than last-click.
MMM is a statistical method that estimates each channel’s contribution from aggregate spend and outcome data, without needing user-level tracking.
It’s the privacy-resilient attribution lens. Open-source options include Google’s Meridian (Bayesian, geo-hierarchical) and Meta’s Robyn. Managed MMM is now SMB-friendly through Recast, Lifesight, and Cassandra. MMM is the right tool for “should we spend more on YouTube or Meta next quarter?”
DDA needs at least 300 conversions per month per conversion action to model reliably. Below that, it falls back to last-click.
Many smaller accounts trigger DDA as the attribution model in GA4 without meeting the volume threshold, so the “data-driven” label is misleading. Check the conversion volume per action before treating DDA outputs as meaningful, especially for niche conversions like “demo booked” or “high-value purchase.”
Compare platform-reported conversions to GA4 and to actual orders in Shopify or your CRM. Report the variance, don’t hide it.
Meta typically over-reports vs GA4 by ~26%. GA4 typically under-reports paid by 18–35% per Varos benchmark data. Meta + Google ROAS often sums to over 100% of real revenue because both take credit for the same purchase. Server-side tracking with deduplication, plus offline conversion uploads from the CRM, narrows the gap. Healthy server-side parity is 95–105% of client-side.
Consent Mode v2 is Google’s framework for modeling conversions from users who decline tracking cookies. Yes, you need it.
Around 31% of users globally accept tracking cookies. Without Consent Mode, the rest are invisible. Advanced mode is preferred over Basic — it recovers 15–25% of lost conversions through modeling. Pair it with Enhanced Conversions (hashed first-party PII, target 60%+ match rate) for an additional 5–25% conversion uplift.
Yes, especially for display, video, and CTV. Leaving them out distorts the channel’s real contribution.
But report them transparently — view-through conversions inflate platform-reported numbers, so pair them with iROAS from a holdout test to show the conservative read alongside the optimistic one. The goal is showing the client both lenses, not picking the one that flatters the channel.
AOV × purchase frequency × customer lifespan × gross margin.
The critical detail is calculating on gross profit, not revenue. LTV on revenue is a vanity number — it ignores whether each sale actually makes money. Predictive LTV with confidence intervals is available through Klaviyo, Daasity, Triple Whale, and Peel for clients with the data volume to support it.
3:1 is the traditional benchmark and still holds. The B2B SaaS median sits around 3.2:1.
Critical caveat: report blended LTV:CAC and paid-only LTV:CAC separately. Paid-only is often 30–50% lower than blended, and it’s the metric that actually governs whether scaling paid acquisition is profitable. Blended LTV:CAC can look healthy while paid is losing money on every new customer.
It depends on the business model. Faster payback = healthier unit economics.
| Business Type | Healthy CAC Payback |
|---|---|
| DTC ecommerce | Under 12 months |
| SaaS SMB | Under 12 months |
| SaaS mid-market | Under 18 months |
| SaaS enterprise | Under 24 months |
Longer paybacks aren’t automatically bad — they require strong retention to compound. Pair payback with NRR for SaaS or repeat purchase rate for DTC to evaluate whether the long payback is supported by the retention curve.
Median NRR is 101–106%. Top quartile is 115–120%. Best-in-class is above 130%.
NRR above 100% means existing customers are growing faster than they churn — the business expands even with zero new acquisition. Pair NRR with Gross Revenue Retention (GRR), which strips out expansion to show pure retention. GRR median is around 90%; above 95% is best-in-class.
Second purchase rate — the share of first-time buyers who make a second purchase.
A customer who buys twice is exponentially more likely to buy ten times. Repeat purchase rate by category gives the broader picture: subscription boxes 40–55%, consumables 35–45%, beauty 30–40%, apparel 25–32%, home goods 18–25%, electronics 12–18%. Where the brand sits within its category matters more than the absolute number.
Because revenue-based LTV ignores whether each sale is actually profitable.
A $500 LTV looks great until you realize gross margin is 20% and you’re spending $150 to acquire the customer — meaning real LTV is $100 and real LTV:CAC is 0.67:1, not 3.3:1. Calculating on gross profit (revenue minus COGS) gives the number that actually predicts whether the business can sustain its acquisition spend.
Blended CAC is total sales and marketing spend divided by total new customers. Paid CAC is paid-channel spend divided by paid-acquired customers only.
Blended CAC is the number that belongs on the executive cover page because boards can act on it. Paid CAC matters tactically because it tells you whether scaling paid spend is sustainable. The two often diverge significantly when organic, referral, and brand demand fill in customers cheaply — making blended look healthy while paid is unsustainable.
Often yes. Markerly research found 82% of marketers report influencer-acquired customers show higher LTV than other channels.
If your client’s data confirms this, lead with it — LTV by acquisition channel is one of the most powerful arguments for budget expansion. Pair it with promo code redemptions, affiliate-attributed sales, and whitelisted creative ROAS to show the full picture, not just Earned Media Value (which is directionally useful but not a real revenue proxy).
Track NRR, GRR, and MRR/ARR with new, expansion, contraction, and churn components broken out separately.
Net MRR alone hides the underlying mix — a flat net number can mask heavy churn offset by expansion, or healthy new bookings being eaten by contraction. The component breakdown shows where the business actually stands. Pair with cohort retention curves to see whether retention is improving or decaying over time.
Send clients reports they actually look forward to opening.
Start Your Free Trial Today