
Organic click-through rate on informational searches showing an AI Overview fell from 1.76% to 0.61% between June 2024 and September 2025. SEO forecasting still works. You project future organic traffic, leads, and revenue from search volume, current rankings, click-through rates, and past performance. But a model built on pre-Overview click rates overpromises on every keyword Google now answers on the results page itself.
Rankings hold or improve, traffic doesn’t follow, and by month four the projection you sold in the pitch is the number you spend the quarterly call defending.
Here’s the order. What forecasting is and what AI Overviews changed to it, then the five inputs you need, then a five-stage build with the exact spreadsheet formulas, then how to turn the finished number into a target your client watches all month. The spreadsheet model, the CTR curve, and the discount math work in whatever tool you already have.
What Is SEO Forecasting?
SEO forecasting estimates a site’s future organic performance from data you already hold: search volume, current rankings, click-through rates, and past traffic, projected forward into a number you can put in front of a client or a finance team.
The naive version grabs the search volume for a keyword, assumes a number-one ranking, multiplies by a fixed click-through rate, and calls the result traffic. That version assumes every number-one ranking earns the same share of clicks, which stopped being true once a large share of searches started resolving on the results page.
A forecast worth defending treats click-through rate as the variable that moves, segments keywords by what the results page looks like for each one, and hands the client a range instead of a single confident number.
Why SEO Forecasting Still Matters, and What AI Overviews Changed
Forecasting does two jobs for an agency: it wins the pitch, and it sets an expectation you can still hit in month twelve. A forecast turns “trust us, SEO works” into a roadmap with numbers attached, and it protects you later, because a client who agreed to a realistic projection has no reason to be surprised when the curve is slow at the start.
What changed is the click. On searches where Google shows an AI Overview, the answer sits at the top of the page and the user often never clicks through. Seer Interactive analyzed 3,119 informational queries and found organic click-through rate on AI Overview searches fell 61%, from 1.76% to 0.61%. You can read the full study for the query-level breakdown. Rankings became a weaker predictor of clicks, and clicks are still the thing that drives leads.
The old model still runs, as long as you discount the keywords an Overview intercepts before you multiply.
Two consequences for your work:
- A number-one ranking on an AI Overview search is worth a fraction of what it used to be, so forecast it as a mid-page result unless your brand is the one being cited inside the Overview.
- Citation presence belongs in the forecast as its own input, because brands cited in AI Overviews earned about 35% more organic clicks than brands that weren’t.
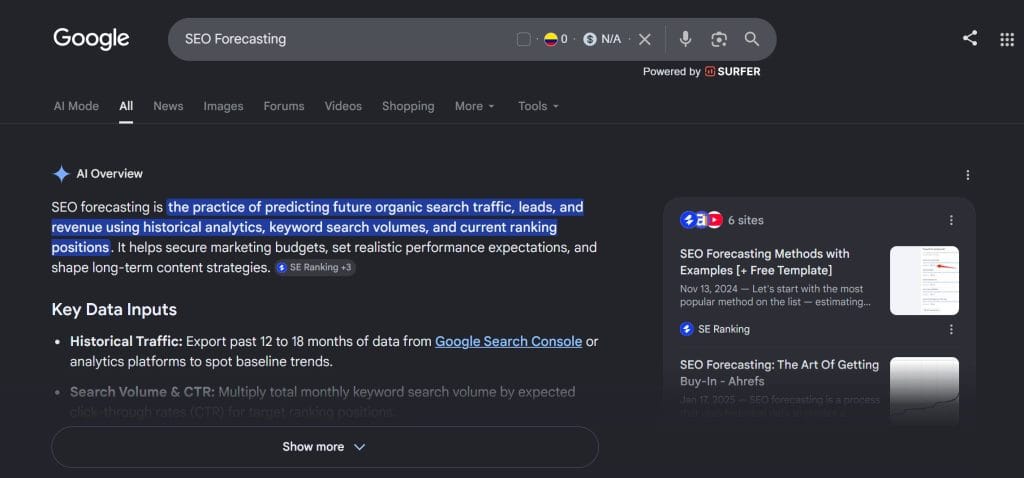
What an AI Overview Does to Your Clicks
When an AI Overview appears, the same ranking earns far fewer clicks. Forecast the two kinds of search separately.
| Search position | Typical CTR, no AI Overview | What to expect with an AI Overview |
|---|---|---|
| Position 1 | 28% to 35% | 10% to 18% |
| Positions 2 to 3 | 12% to 18% | 4% to 8% |
| Positions 4 to 10 | 2% to 9% | 1% to 3% |
The 61% drop comes from Seer Interactive’s analysis of 3,119 informational queries, June 2024 to September 2025. Position-level CTR ranges are planning figures, not guarantees. The gap widens when the brand is not cited inside the Overview, and narrows when it is.
What You’ll Need
Five inputs build a solid forecast, and four of them are free. Start with the data, then add the layer that puts it in front of the client.
- Google Analytics 4 and Google Search Console. Your first-party record of what already happens: organic sessions, conversions, impressions, clicks, and average position. Audit the setup before you trust it. Broken conversion tracking is the most common reason a forecast is wrong from the first cell.
- At least twelve months of historical traffic. Twelve months shows you seasonality instead of letting you mistake a summer dip for a decline. Less than that and you’re guessing at the shape of the year.
- A keyword tool with click and volume data. Semrush and SE Ranking both do this, and both flag AI Overview presence, which you need for the discount step.
- A spreadsheet. Google Sheets is where you’ll model scenarios and show your working.
- A reporting layer to put it in front of the client. Swydo’s SEO reporting tool pulls your forecast and your live SEO metrics into one client-facing report, so the projection and the actual results sit side by side rather than in two files nobody opens together. Our 38 and growing integrations cover the SEO stack you’re forecasting from, including GA4, Search Console, Semrush, SE Ranking, and AccuRanker. The 14-day trial covers 10 data sources, which is enough to wire up a full client before you decide.
How to Forecast SEO Traffic, Step by Step
The workflow is the same whether you’re forecasting one page or a whole account: set the goal, pull a clean baseline, flag the keywords AI Overviews touch, model the traffic, then wrap it in a range. Steps one and two are prep. Steps three through five are three routes to the same modeling stage, and you can pick one or stack them.
Steps six and seven are for accounts where keyword data alone won’t carry the forecast.
The Five-stage Seo Forecast
Agree the goal
Decide with the client which metric and timeframe you’re forecasting.
Pull the baseline
Twelve clean months from GA4 and Search Console, checked for seasonality.
Flag AI Overview keywords
Split keywords into Overview and no-Overview lists, since they get different CTRs.
Often skippedModel AI-adjusted CTR
Volume times CTR, discounted for the keywords an Overview intercepts.
Build a range
Best, worst, and most-likely scenarios, plus a sensitivity check.
1. Set the Goal and Pull Your Baseline
Start with the metric the client cares about, not the one that’s easiest to project. Some want leads, some want branded demand, some need a number to defend their own budget upward. Pin down which conversions count and what “good” looks like at three, six, and twelve months, then decide which SEO metrics you’ll report on, because a forecast is only useful when you track the same thing you predicted.
Then build the baseline:
- Pull twelve months of organic sessions and conversions from GA4, plus impressions, clicks, and average position from Search Console. Line them up by month.
- Audit the tracking. Check conversion events and goal setups so you’re not projecting off broken data.
- Note the seasonal peaks and any past algorithm-update dips, so you can tell a normal dip from a trend.
- Pull the high-impression, low-click keywords from Search Console. You already rank for these, so they’re the fastest wins to fold into a forecast.
| Timeframe | Traffic Goal | Conversion Goal | Revenue Goal | Key Performance Indicators |
|---|---|---|---|---|
| 3 Months | ||||
| 6 Months | ||||
| 1 Year |
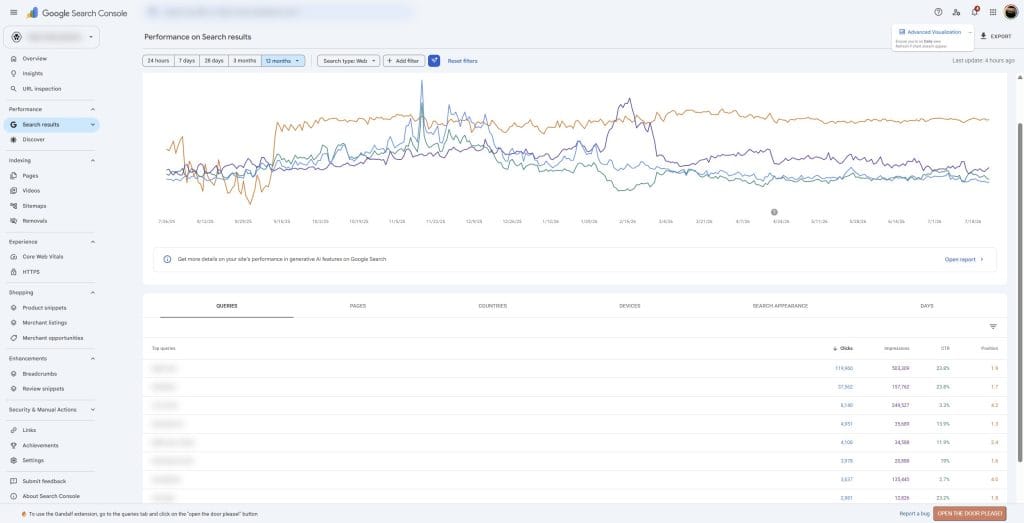
2. Flag the Keywords That Trigger AI Overviews
Split your keyword set into two lists before you model anything: searches where an AI Overview appears, and searches where it doesn’t. The two lists carry different click-through rates, and lumping them together produces the confident, wrong number.
Both major keyword tools surface this. In Swydo, the Semrush integration pulls two AI Overview fields into a report: the count of keywords triggering an AI Overview, and the exact keywords triggering placement. Per client, that shows you how much of the target set is exposed to click compression and whether the brand is being cited in those Overviews over time. Tag the exposed keywords in your sheet with a yes or a no, and use that flag in the next step.
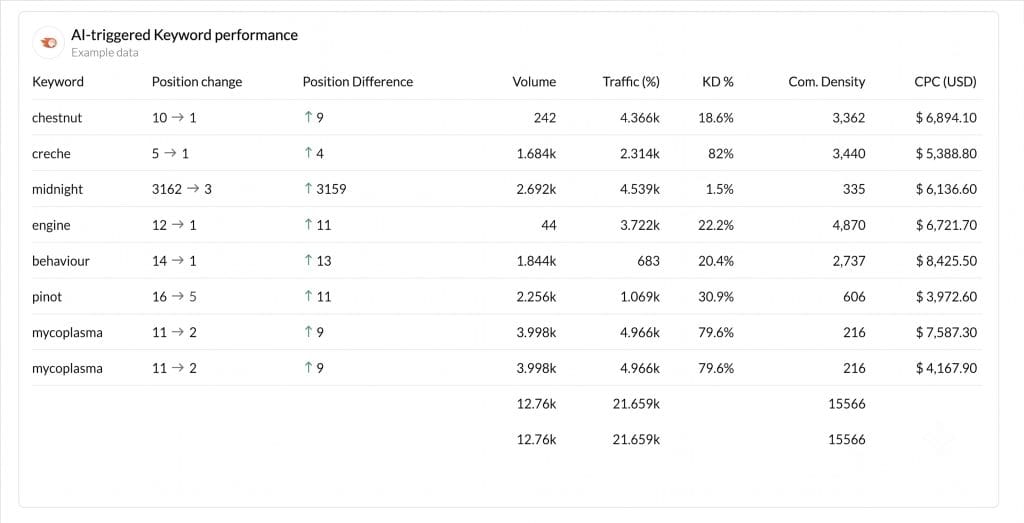
3. Forecast Keywords With Semrush
Semrush is the fastest route to per-keyword forecasts. Work through it in order:
- Build the keyword set. Open the Keyword Magic Tool and pull the client’s targets, including long-tail and question keywords, not just the head terms.
- Grab the data for each keyword. Take search volume from Keyword Overview, current position from Position Tracking, and estimated CTR by position from Organic Research. Note the Personal Keyword Difficulty and Potential Traffic figures too, since both weigh your own domain’s authority rather than a generic average.
- Find the gaps. Run the Keyword Gap tool against two or three competitors to surface keywords they rank for and the client doesn’t.
- Mark the AI Overview keywords. Semrush shows which keywords trigger an AI Overview. Flag those, because they need the discount when you build the model.
- Do the math. For each keyword, Potential Traffic equals Search Volume times your AI-adjusted CTR, and Potential Conversions equals Potential Traffic times your conversion rate. Cut the CTR on the flagged keywords before you multiply.
- Sanity-check the total. A keyword that jumps from zero to ten thousand visitors means a broken formula.
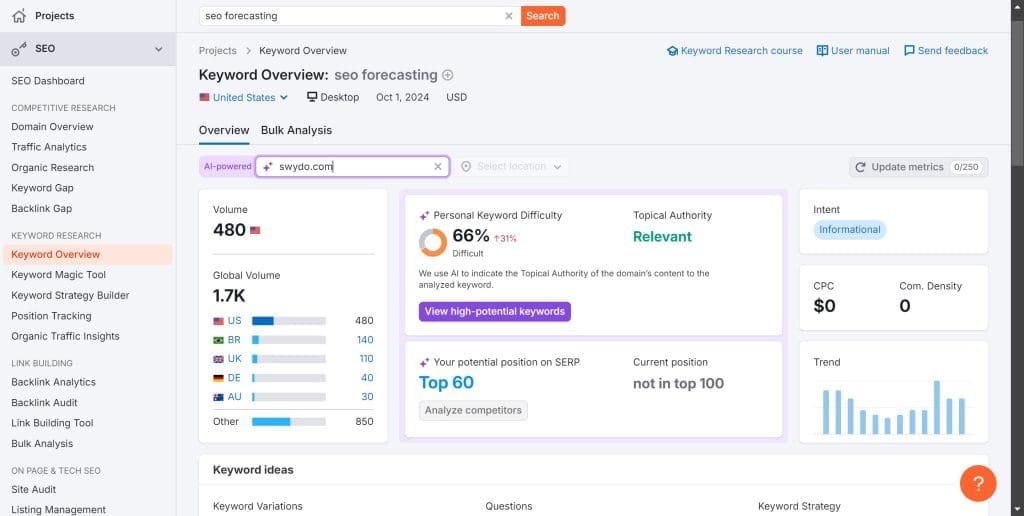
4. Forecast With SE Ranking’s SEO Potential Tool
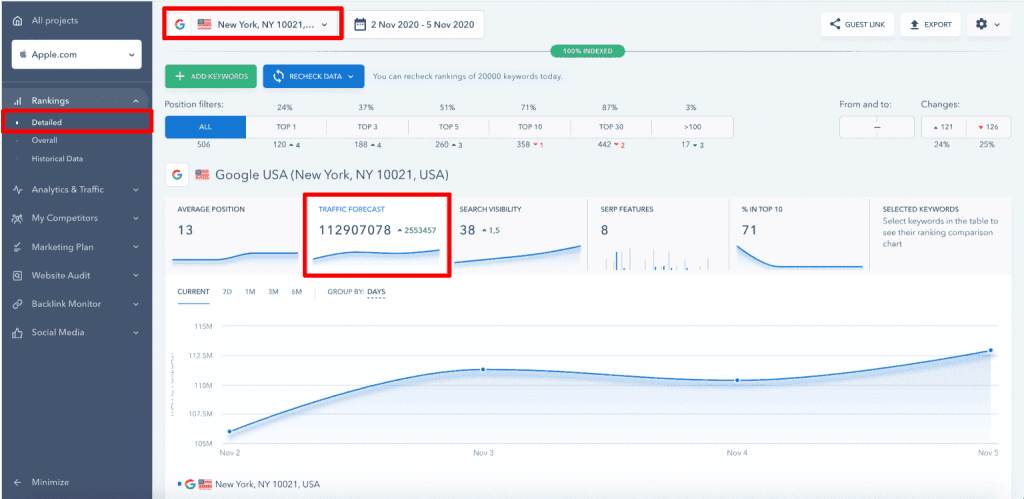
SE Ranking does the CTR and traffic math for you, which helps when you want a second number to check Semrush against:
- Set up the project. Add the target keywords and current rankings to SE Ranking’s Rank Tracker.
- Configure conversion settings. Set the conversion ratio and profit per conversion. One buyer in fifty visitors is a 2% conversion rate.
- Review current performance. Read the current traffic forecast, traffic cost, and estimated income based on where the site ranks today.
- Model the ceiling. In the SEO Potential tool, set “Estimated top” to 1. That returns the maximum traffic and leads you’d pull if you ranked first for every target keyword, which anchors the optimistic end of your range.
- Read the outputs. The tool returns expected traffic volume, what that traffic would cost through Google Ads, and the expected number of prospects.
- Compare competitors. Use the competitor tracking to benchmark your forecast against rivals’ actual performance.
Already on SE Ranking? Swydo pulls its Traffic Forecast straight into client reports, so the estimate lands next to the live rankings rather than in a separate export.
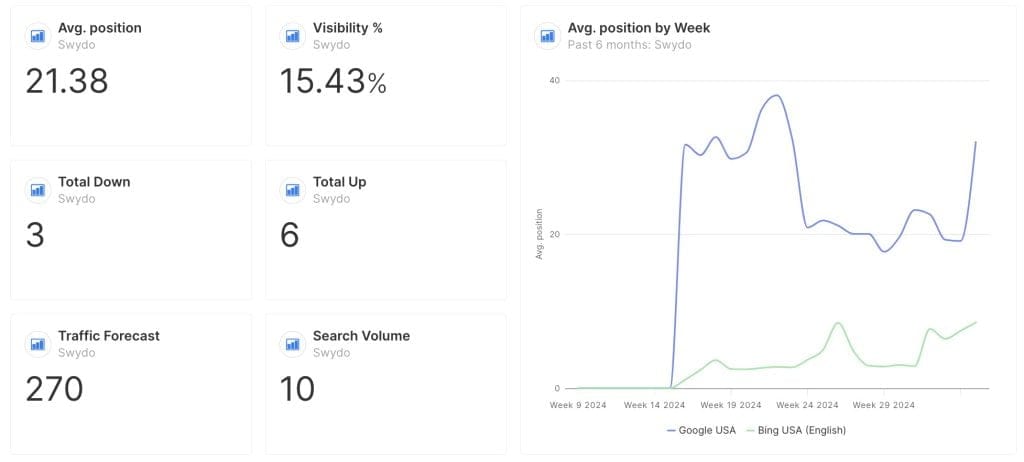
One honest limit: the SE Ranking integration doesn’t carry deep ranking history beyond average position, so the twelve months a statistical model needs still comes from your own GA4 and Search Console records.to client reports, so the estimate lands next to the live rankings rather than in a separate export.
5. Build the Model in Google Sheets
A spreadsheet gives you full control of every assumption and is the best format for a pitch, because you can show your working and model scenarios side by side. Build it once and reuse it per client.
Set up the columns. Create a sheet with these thirteen columns:
| Column | Holds | Source or formula |
|---|---|---|
| A | Keyword | your target keyword |
| B | Search volume | Semrush or SE Ranking |
| C | AI Overview | yes or no, from step two |
| D | Current rank | Search Console or your rank tracker |
| E | Forecasted rank | the position you’re targeting |
| F | AI Overview discount | formula below |
| G | Current CTR | formula below |
| H | Forecasted CTR | formula below |
| I | Current traffic | =B2*G2 |
| J | Forecasted traffic | =B2*H2 |
| K | Conversion rate | your historical rate |
| L | Current conversions | =I2*K2 |
| M | Forecasted conversions | =J2*K2 |
Column F, the AI Overview discount. This is the piece the old models miss. When an Overview shows, the ranking earns a fraction of its usual clicks, so apply a haircut:
=IF(C2="yes",0.4,1)
That cuts the click rate by 60% on any keyword with an Overview and leaves the rest at full value. Tune the 0.4 to your own data: lighter if your brand is often cited in Overviews, heavier if it never is.
Columns G and H, the click-through rates. Both turn a rank into a CTR off a position curve, then multiply by the discount. These are typical no-Overview values you can adjust to your own numbers. Current CTR reads the current rank in D:
=IF(D2<=1,0.28,IF(D2<=3,0.15,IF(D2<=5,0.09,IF(D2<=10,0.04,IF(D2<=20,0.015,0.005)))))*F2
Forecasted CTR is the same formula pointed at the forecasted rank in E:
=IF(E2<=1,0.28,IF(E2<=3,0.15,IF(E2<=5,0.09,IF(E2<=10,0.04,IF(E2<=20,0.015,0.005)))))*F2
Traffic and conversions. Current traffic is volume times current CTR (=B2*G2), forecasted traffic is volume times forecasted CTR (=B2*H2), and the two conversion columns multiply each traffic figure by your conversion rate.
Add summary stats below the table. Assuming your keywords fill rows 2 to 100, put this block underneath:
| Metric | Formula |
|---|---|
| Total current traffic | =SUM(I2:I100) |
| Total forecasted traffic | =SUM(J2:J100) |
| Traffic increase | =SUM(J2:J100)-SUM(I2:I100) |
| Percentage traffic increase | =(SUM(J2:J100)-SUM(I2:I100))/SUM(I2:I100) |
| Total current conversions | =SUM(L2:L100) |
| Total forecasted conversions | =SUM(M2:M100) |
Chart it. Highlight the keyword column and the current and forecasted traffic columns, then Insert then Chart and pick a bar chart. Give the current and forecasted bars different colors so the uplift reads at a glance.
Google Sheets Forecast Example – Use this template and make a copy for your own forecasting model.

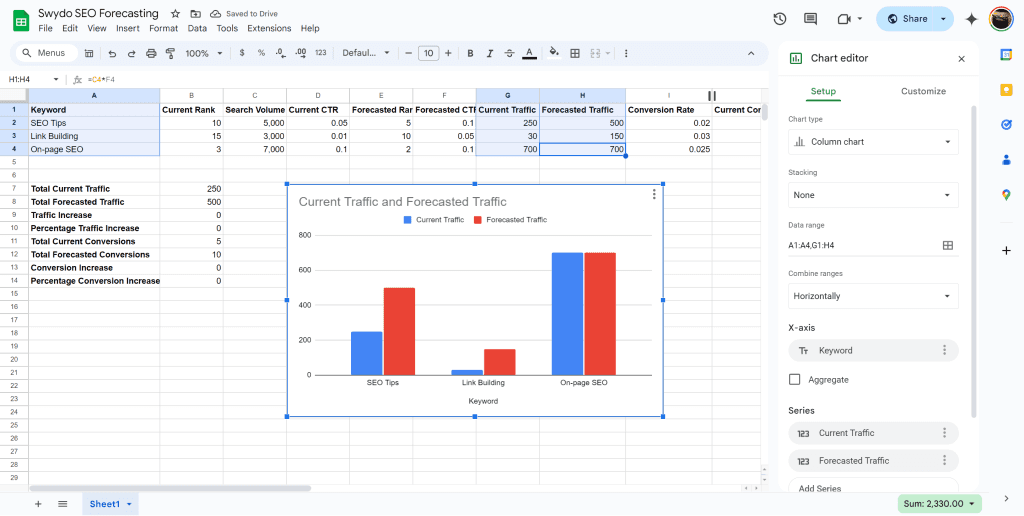
Build three scenarios. Copy the model onto three tabs named Best Case, Worst Case, and Most Likely, then change only the forecasted rank in column E on each. Best case assumes strong positions, worst case modest ones, most likely wherever your judgment lands. The forecasted CTR recalculates from the rank on every tab, so each one produces its own traffic and conversion total. The spread between the three is your forecast range.
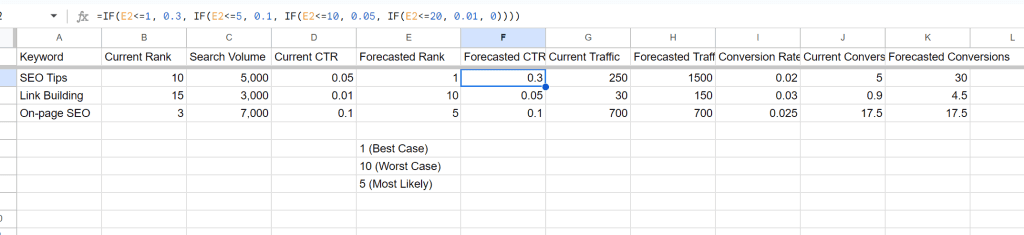
Pressure-test it with a sensitivity table. On a tab named Sensitivity, list the CTR and conversion rate you expect at each rank band, using the rank floor as the lookup key:
| Rank floor | CTR | Conversion rate |
|---|---|---|
| 1 | 0.28 | 0.030 |
| 2 | 0.15 | 0.025 |
| 4 | 0.09 | 0.020 |
| 6 | 0.04 | 0.015 |
| 11 | 0.015 | 0.010 |
| 21 | 0.005 | 0.008 |
Pull the conversion rate into the model with an approximate-match lookup on the forecasted rank:
=VLOOKUP(E2,'Sensitivity'!$A$2:$C$7,3,TRUE)
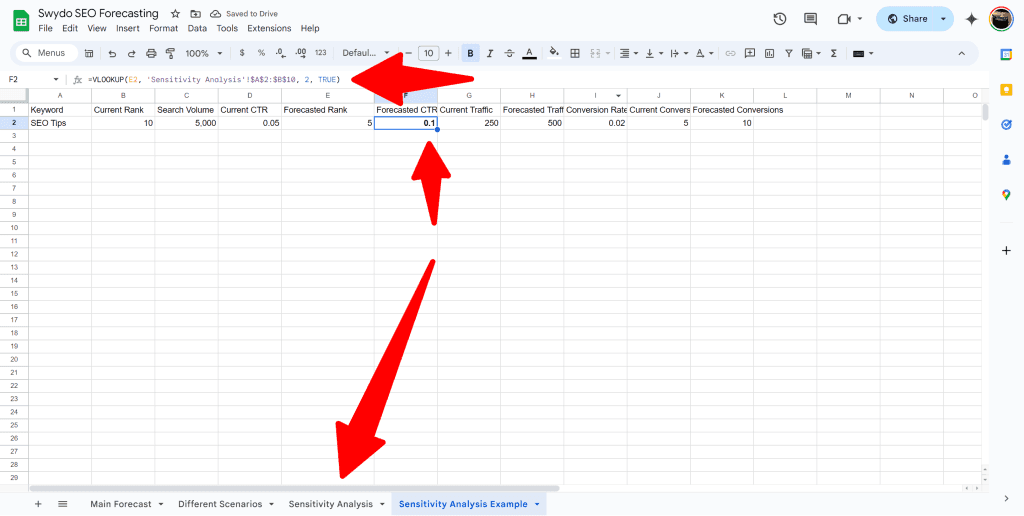
The rank floors have to be numbers, not text like “6-10”. An approximate VLOOKUP walks a sorted numeric column and grabs the last row at or below your rank, so a forecasted rank of 8 correctly lands on the row for 6. Text ranges break that match without an error and hand you the wrong rate, which is a common reason a spreadsheet forecast is quietly off. Nudge the numbers and watch the bottom line. If a half-point change in conversion rate swings the forecast hard, the client needs to know the estimate is fragile before they bank on it.
6. Project the Trend With Statistics
When an account has clean history, a statistical model reads the trend better than a keyword-by-keyword build. Use it alongside the keyword method, not instead of it.
- Gather the data. Twelve or more months of organic traffic, rankings for key terms, and conversions, with major site changes and algorithm updates marked.
- Spot the patterns. Look for seasonality and the overall direction before you model, so you know what the output should roughly look like.
- Pick a model. Linear regression fits a straight-line trend and suits steady accounts. Exponential smoothing handles seasonal peaks and troughs better.
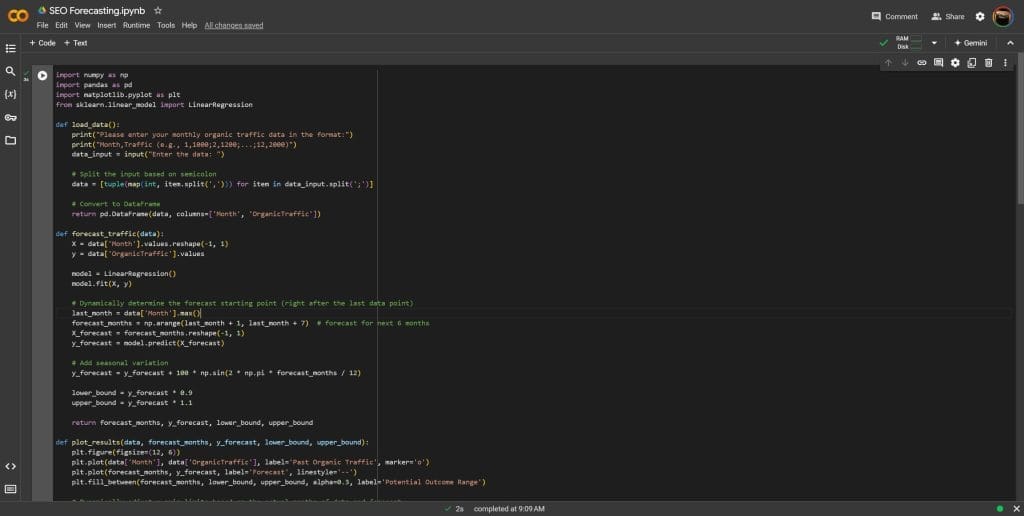
- Run it. Excel does this with the FORECAST and TREND functions. For more control, a Colab notebook runs the same regression in Python: open the notebook, save a copy to your Drive, run each cell, enter your monthly data when prompted, and read the forecast and its range off the chart.
- Interpret and refine. Add new data as it comes in and adjust for known future events like a planned migration. The forecast sharpens every month you feed it.
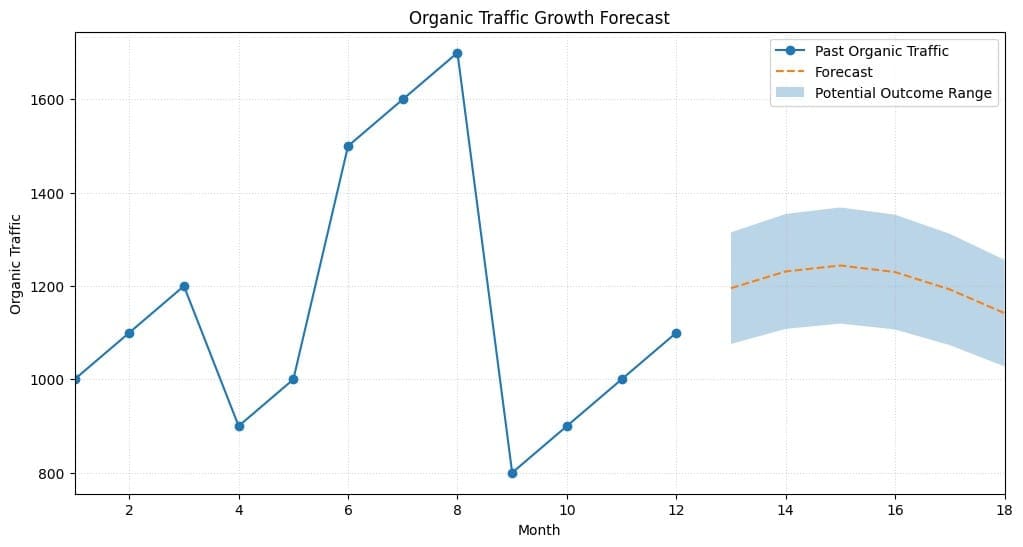
Without making you do all of the coding. I created a Python code using Linear Regression to create the forecast. Here’s how you can use it:
Open the Google Colab Link:
Make a Copy of the Notebook:
- Once the notebook is open, go to the top menu and click on File > Save a copy in Drive. This will create a copy of the notebook in their own Google Drive, allowing them to modify and run the code.
- Alternatively, they can click on File > Download .ipynb to download the notebook and upload it back into Colab later.
Run the Code:
- Once the copy is saved, they can run each code cell by clicking on the play button (or press Shift + Enter).
- When prompted, they can enter their monthly organic traffic data in the format
Month,Traffic(e.g.,1,1000;2,1200;3,1300). - The code will process the data and generate a forecast for the next 6 months.
View the Forecast:
- The notebook will display a chart showing both the historical data and forecasted traffic for the next 6 months.
- It will also print the forecasted traffic values, including a range for potential outcomes.
Pro Tip: Forecasts are guides, not guarantees. Use them to inform strategy, but be prepared to adapt as real-world data comes in.
7. Benchmark Against Competitors
When the client is a new domain with no history to project from, borrow it from the competition.
- Find the real rivals. Look past who the client thinks they compete with. Focus on who actually ranks in the SERP for their target keywords.
- Pull their performance. Estimate their organic traffic with a tool like SimilarWeb or Semrush, and note their rankings, content cadence, and backlink profile.
- Find the gaps. Spot where the client lags and where they already have an edge, which separates the quick wins from the long game.
- Set realistic benchmarks. Use a competitor on a similar growth path, not the category giant. The market leader’s traffic is a fantasy target for a new site, and setting it as the goal just sets up the disappointment.
Three Forecasting Methods, and When to Use Each
| Method | Best for | What you need | Effort |
|---|---|---|---|
| Keyword-based estimation | Most forecasts, and any pitch you need to defend line by line | Keyword volumes, CTR curve, AI Overview flags, forecasted ranks | Low |
| Statistical forecasting | Established accounts with clean history and clear seasonality | Twelve or more months of traffic, a regression or smoothing model | Medium |
| Competitor benchmarking | New domains with no data of their own to project from | A traffic-estimate tool and a realistic peer, not the category giant | High |
How to Turn a Forecast Into Client Goals You Can Track
A forecast is worth more than the pitch it won once the client can check it against real results every month. Three things have to sit in the client’s report for that: the projection, the live data, and a pacing target that says whether the account is on track.
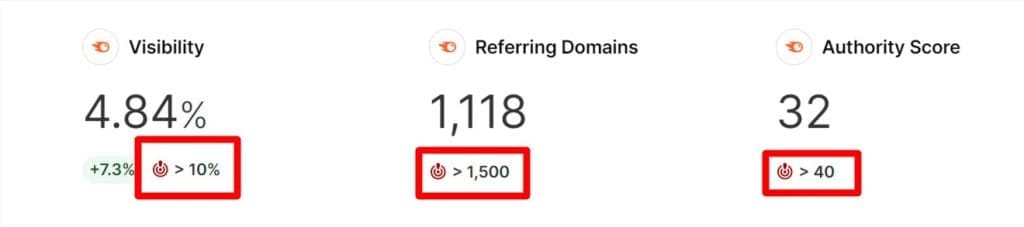
Set the forecast as a goal you monitor. In Swydo, goal tracking turns each forecasted target into a pacing metric with On Track, Off Track, and Achieved states, so you and the client both see whether the account is tracking toward the number you promised. The Recent Periods view shows historical values while you set the target, so you’re benchmarking against what happened rather than a guess.
If you built the model in a spreadsheet, you don’t have to rebuild it. Swydo’s Google Sheets integration imports the forecast straight into the client report, where it sits alongside the live data from GA4, Search Console, and your rank tracker. Put the projected line and the actual line on the same page and the monthly call gets shorter.

Then give the client one place to look at all of it. The Client Portal combines Reports, Boards, and Goals into a single secure link, so the forecast report, the KPI board, and the pacing goals live at one URL instead of three. Open the client’s account, go to the Portal tab, pick what to include, and preview it before you send. Add a password when the numbers warrant it, and regenerate the link at any point so the previous one stops working, which helps when a marketing manager leaves mid-contract.
Clients who want to interrogate the numbers can do it themselves. Turn on AI for your clients in Settings, and they can ask the dashboard why a month came in under forecast instead of emailing you on the 18th. That usage draws on the same AI credit pool as your own summaries: 4,000 credits a month, roughly 95 per report summary, billed only on what you use and capped at a spend limit you set. Credits reset monthly and don’t carry over, so a light month is money back rather than banked capacity. Check Billing → view usage details to see which threads and team members spent what.
For the accounts that need closer watching, SEO monitoring alerts catch the moment reality diverges from the forecast, so a bad month becomes a conversation you start rather than one the client starts for you.
Is SEO Forecasting Still Worth It?
Yes, as a planning tool rather than a crystal ball, and anyone selling it as the second thing is setting a trap. A forecast is your best estimate given imperfect information, and its job is to make the budget decision less blind.
The mistakes that break forecasts are consistent and worth naming. There’s the straight-line assumption, when rankings really improve in lumps and plateaus. There’s the seasonality blind spot, where a normal Q1 dip reads as failure. There’s the stale click-through rate that predates AI Overviews, which is why so many forecasts on desks right now are already too optimistic. And there’s the number-one ranking promised on a keyword the client has no realistic shot at, which feels good in the pitch and terrible in month six.
So what does your current model account for? If the answer is rankings and a fixed CTR, it’s measuring a version of search that’s already gone.
Final Thoughts
Run the arithmetic on your own list. Take your target keywords, multiply each one’s volume by its position CTR, then multiply the AI Overview keywords by 0.4. If half your list carries an Overview flag, that single change cuts your forecast by about 30%, which means the version you’re showing clients today is the one running 30% high.
Fix it because of month four, when the client compares your projection against their own analytics and decides whether the next invoice is worth paying.
Pull your top 50 keywords, flag the ones with an Overview, and apply the discount. One afternoon, and you’ll know how far off the current number is.
SEO Forecasting FAQ
Direct answers on predicting organic traffic as AI reshapes the results page
SEO forecasting predicts a site’s future organic traffic, leads, or revenue using search volume, current rankings, click-through rates, and past performance. It’s a planning tool, not a guarantee. A good forecast sets expectations you can hit and gives you a defensible number for budgets and pitches.
SEO forecasting is only as accurate as its inputs. Clean historical data, realistic rank assumptions, and click-through rates that match the current results page get you close. Stale numbers or a wishful number-one ranking for every keyword do not. Present the output as a range so it reflects real uncertainty.
Use a position-based CTR curve, then discount any keyword that shows an AI Overview. Without an Overview, position one earns roughly a quarter to a third of clicks, tapering fast down the page. With an Overview present, cut those rates sharply, because the answer box catches the click before it reaches your link. One flat CTR table across both is the most common way a forecast overstates traffic.
Most SEO forecasts play out over six to twelve months. Rankings and content need time to mature before traffic follows, so new pages and competitive terms sit at the slow end while pages you’re optimizing move faster. Build that ramp into the forecast so the client expects a curve, not an overnight jump.
Twelve months is the practical minimum. A full year reveals seasonality and gives a statistical model enough signal to find the real trend, while six noisy months point you the wrong way with false confidence. If the account is too new, use competitor benchmarking and build your own history as you go.
No, but they break the old method. Forecasting still works. What stopped working is assuming a ranking earns a stable share of clicks, because AI Overviews answer many searches on the page itself. Discount the keywords where an Overview appears and the forecast stays useful.
Stable rankings with falling traffic almost always means click-through rate dropped, not position. AI Overviews and other zero-click features answer many searches directly, so users see your listing but don’t click. Check whether your top keywords trigger an AI Overview. That’s the usual cause, and it’s why forecasts built on old click rates now run high.
AI Overviews cut the clicks a ranking earns, so the same position drives less traffic than it used to. On searches where an Overview appears, a number-one ranking behaves more like a mid-page result. Split your keywords by Overview presence, apply a heavier discount to the exposed ones, and forecast the two groups separately.
Not with the volume-times-CTR method, because AI assistants like ChatGPT and Perplexity don’t publish search volume or ranking positions. Treat AI search as a channel you monitor rather than one you forecast to a precise number. Track referral traffic in your analytics and how often your brand gets cited in AI answers, then watch the trend.
Yes, at a lower value. A keyword with an Overview isn’t worth zero, because people still click through for detail, comparison, and buying intent the box doesn’t fully answer, and a cited brand earns extra clicks. Forecast them as a separate group with a heavier discount, and track whether you’re the one getting cited.
Use keyword-based estimation for most forecasts, since it’s transparent and easy to defend line by line. Switch to statistical forecasting when you have clean history and clear seasonality, and fall back on competitor benchmarking for a brand-new site with no data of its own. Match the method to the situation instead of forcing one.
A spreadsheet is enough, and often better for a pitch. You control every assumption and can show your working across best, worst, and most-likely tabs. A dedicated tool saves time and adds features like ranking probability at scale. The accuracy comes from your inputs either way.
Pull at least twelve months of history, then apply each month’s seasonal pattern to your baseline instead of assuming flat growth. Exponential smoothing handles this automatically. In a spreadsheet, weight each forecast month by how that same month performed the year before. Skip this and a normal off-season dip looks like failure.
Turn forecasted traffic into money in three moves. Multiply traffic by conversion rate to get leads, multiply leads by close rate and average deal value to get revenue, then compare that revenue to your SEO cost. Present the result as a range tied to your best, worst, and most-likely scenarios so the ROI reflects real uncertainty.
Lead with a range, not a single number, and tie it to the metric the client cares about. Show best, worst, and most-likely side by side, then place the projected line next to real results as they arrive. Explain the assumptions in plain terms so the client trusts the forecast and isn’t surprised later.
Put the forecast, the live rankings, and the pacing goals behind one link instead of emailing a spreadsheet. A client portal combines the report, the KPI board, and the goals into a single password-protected URL your client can open whenever they want, which turns the forecast from a document they read once into a number they watch. You can regenerate the link to cut off the old one when contacts change.
Replace the vague promise that SEO works with a realistic traffic and revenue projection for the prospect’s own keywords, plus the work required to reach it. That gives a skeptical buyer a concrete reason to say yes, and it’s the backbone of any SEO proposal worth sending. Keep it credible, because an inflated forecast wins the deal and then loses it when the numbers miss.
Get ahead of it. If you track the forecast against real results, a miss becomes a conversation you start, showing what diverged and what you’re changing. Then update the forecast, because a projection you revise with fresh data is more trustworthy than one you defend past its expiry. Treat it as a living estimate.
Show clients your SEO forecast next to their real results, in one report.
Start Your Free Trial Today