
Most agencies drown their clients in data while proving nothing about business impact. They report impressions, rankings, and traffic spikes, yet clients still ask the same question at every meeting: “So what does this actually mean for my revenue?”
This guide solves that disconnect. Every metric here connects directly to business outcomes, —no fluff, no vanity metrics, and specific guidance on how to measure and report effectively.
Once you have a solid grasp on these key SEO metrics, you’ll be well-equipped to track your SEO progress effectively and craft compelling reports that showcase the value of your SEO efforts.
The Way We Search Is Now Completely Different
Understanding why certain metrics matter requires understanding the environment they exist in. Two forces have reshaped how we measure SEO success: AI-powered search features and increasingly aggressive algorithm updates focused on content quality.
AI Overviews Are Reshaping Click Behavior
Google’s AI Overviews appear at the top of search results and answer queries directly, which means users often get what they need without clicking through to any website. This shift has measurable consequences for organic traffic.
AI Overviews Impact on Organic Click-Through Rates
How AI-generated answers are reshaping click behavior by SERP position
Source: GrowthSRC Media analysis of 200,000+ keywords across 30+ websites
The Data Behind the Shift
GrowthSRC Media analyzed over 200,000 keywords across 30+ websites in ecommerce, SaaS, B2B, and EdTech. Their study found that click-through rates for position #1 dropped from 28% to 19%, representing a 32% decline. Position #2 experienced an even steeper 39% drop, falling from 20.83% to 12.60%.
One counterintuitive finding emerged from this research: positions #6 through #10 saw CTR increases of approximately 30%. The researchers attribute this to AI Overviews failing to fully satisfy user intent, which causes searchers to scroll past them looking for more substantive content.
Algorithm Updates Continue to Prioritize Quality
Google’s algorithm updates provide signals about what the search engine values. Tracking these updates helps explain why certain sites gain or lose visibility, and what patterns correlate with success.
Recent Update Patterns
According to Search Engine Land’s analysis, Google launched four confirmed algorithm updates in 2025: three core updates (March, June, December) and one spam update (August). The December core update rolled out over 18 days and caused significant ranking fluctuations, particularly for health publishers and YMYL (Your Money or Your Life) content.
Sites that maintained stability through these updates shared common characteristics: strong technical foundations, content demonstrating genuine expertise, and user experience metrics that indicated visitor satisfaction. Sites that dropped often had thin content, aggressive advertising, or quality signals that didn’t match their claimed authority.
The Difference Between Metrics and KPIs Determines Your Reporting Value
Many agencies treat every number in Google Analytics as equally important. This approach buries meaningful insights under mountains of data that clients don’t know how to interpret. Distinguishing between raw metrics and strategic KPIs separates reports that prove value from reports that prove nothing.
How to Apply This Distinction
Metrics measure activity. Click-through rates, bounce rates, and keyword rankings all describe what happened. They provide data points for analysis but don’t answer business questions on their own.
Metrics vs. KPIs: The Reporting Difference
Transform raw data into business insights that prove value
METRICS
Measures activity
KPIs
Measures business impact
Before building any report, clarify with your client what business outcomes matter most. Then select metrics that directly connect to those outcomes and present them as KPIs with clear business context.
KPIs (Key Performance Indicators) measure progress toward specific business objectives. They transform raw data into insights that connect SEO performance to revenue, leads, or other outcomes the client actually cares about.
Consider the difference in practice: “Organic traffic increased 25%” is a metric. “Organic traffic from high-intent keywords increased 25%, driving 40 additional qualified leads worth an estimated $120,000 in pipeline” is a KPI that demonstrates business impact.
Before building any report, clarify with your client what business outcomes matter most to them. Then select metrics that directly connect to those outcomes and present them as KPIs with clear business context.
Top 10 SEO Metrics That Drive Client Results
Key performance indicators that connect SEO efforts to business outcomes
Impact on Client’s Business Organic search drives approximately 53% of all trackable website traffic (64% for B2B), making it the largest single traffic source for most businesses
Tools for Measurement Google Analytics 4, Swydo, Google Search Console
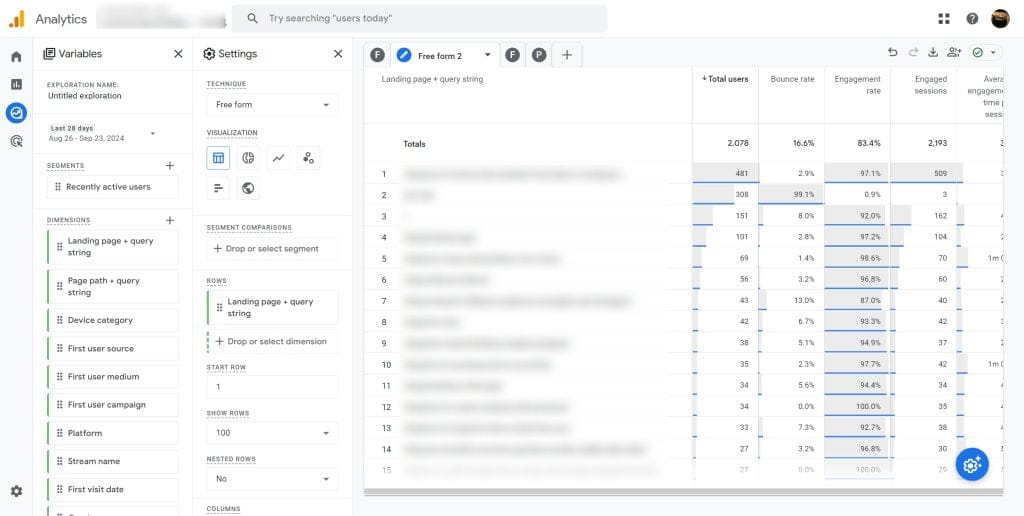
Recommended Action Steps Create GA4 segments to isolate high-value organic visitors; track users who view multiple pages, spend significant time on site, or reach key conversion pages
Common Pitfalls Focusing only on traffic volume without considering traffic quality; organic traffic share has decreased ~3.65% as AI features capture user attention
Advanced Tips Focus reporting on year-over-year trends rather than month-to-month fluctuations; compare engagement metrics between traffic segments to identify highest-value sources
Client Communication Strategy Showcase year-over-year growth and highlight quality improvements alongside volume metrics
Impact on Client’s Business Links SEO efforts directly to revenue; SEO leads close at 14.6% vs 1.7% for outbound marketing (8.5x higher)
Tools for Measurement Google Analytics 4, Swydo Custom Metrics
Benchmarks Average SEO conversion rate is 2.4%; Legal services: 7.5%, Local services: 3.3%, B2B SaaS: 2.1%, E-commerce: 1.8-2.3%
Recommended Action Steps Track both macro conversions (purchases, demos) and micro conversions (newsletter sign-ups, downloads); use multi-touch attribution for longer sales cycles
Common Pitfalls Ignoring micro-conversions that signal user intent; relying solely on last-click attribution models
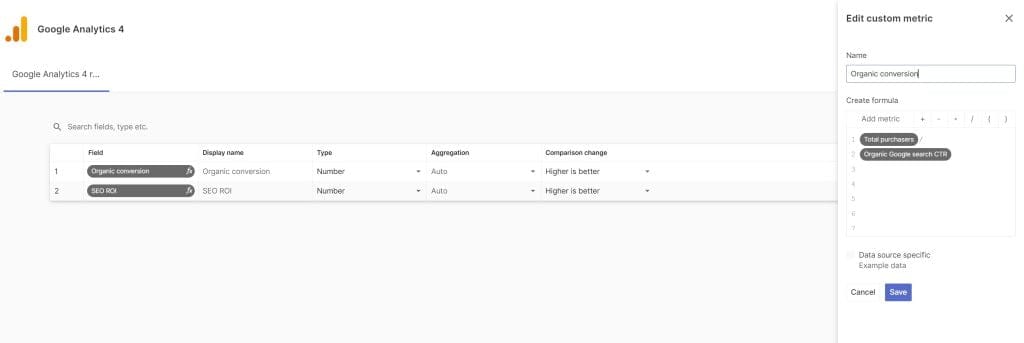
Advanced Tips Use Swydo’s custom metrics to create organic conversion rate calculations that demonstrate tangible business impact
Client Communication Strategy Explain how conversion rate improvements directly impact revenue using the formula: (Conversions ÷ Organic Visitors) × 100
Impact on Client’s Business Indicates visibility for specific search terms; position #1 no longer guarantees traffic when AI Overviews dominate
Tools for Measurement SEMrush, SE Ranking
Recommended Action Steps Prioritize high-intent, transactional keywords; track SERP features alongside rankings; monitor if content gets cited in AI Overviews
Common Pitfalls Chasing #1 rankings for all keywords instead of focusing on high-value, conversion-driving terms
Advanced Tips A #3 ranking for “enterprise HR software pricing” delivers more value than #1 for “what is HR software” due to buyer intent; use SE Ranking for traffic forecasting
Client Communication Strategy Always correlate ranking changes with traffic and conversion metrics to demonstrate actual business impact
Impact on Client’s Business Google-confirmed ranking factors; serve as tiebreakers when content quality is equal; only 47-55% of websites meet all thresholds
Tools for Measurement Google PageSpeed Insights, Pingdom, Swydo integration
Current Thresholds LCP (Largest Contentful Paint): Under 2.5 seconds; INP (Interaction to Next Paint): Under 200ms (replaced FID March 2024); CLS (Cumulative Layout Shift): Under 0.1
Recommended Action Steps Optimize images, minify CSS/JavaScript, use lazy loading and asynchronous script loading
Common Pitfalls Neglecting mobile page speed, which is prioritized by Google’s mobile-first indexing
Advanced Tips Achieving “good” scores across all metrics provides measurable advantage over 45-53% of competitors who haven’t prioritized technical performance
Client Communication Strategy Demonstrate how speed improvements lead to better user engagement and higher conversions
Impact on Client’s Business Reveals how compelling your search listings are; optimizing CTR increases traffic without improving rankings
Tools for Measurement Google Search Console
Updated Benchmarks Position 1: 19-27%, Position 2: 12.6-18%, Position 3: 8.5-10%; CTRs dropped ~32% for position #1 due to AI Overviews; informational queries with AI Overviews saw 61% CTR decline
Recommended Action Steps Write title tags communicating specific value; implement structured data for rich snippets; identify pages with high impressions but below-average CTR
Common Pitfalls Overlooking meta description optimization; not accounting for SERP composition changes
Advanced Tips Test different meta descriptions; pages cited in AI Overviews receive 35% more organic clicks
Client Communication Strategy Show how CTR improvements correlate with increased traffic without needing ranking improvements
Impact on Client’s Business Signals trust and authority; over 99% of AI Overview citations come from domains already ranking in top 10
Tools for Measurement SEMrush, Ahrefs, Majestic
Recommended Action Steps Prioritize high-quality, relevant backlinks; monitor total referring domains and link acquisition velocity; analyze anchor text distribution
Common Pitfalls Focusing solely on quantity; creating unnatural link patterns; not conducting toxic link audits
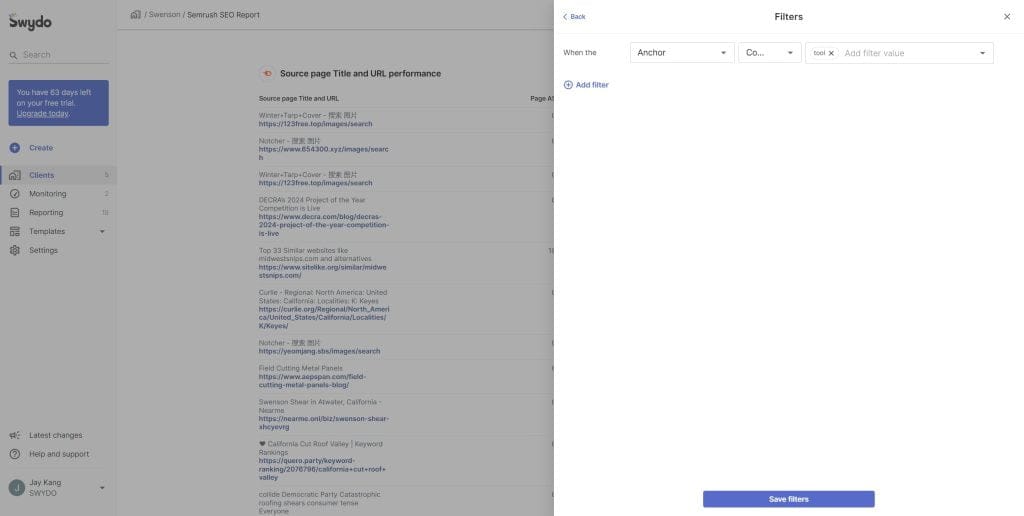
Advanced Tips Build relationships with industry influencers for natural link-building; use Semrush integration to filter backlinks by specific anchor text from your link building efforts
Client Communication Strategy Explain how quality backlinks enhance site authority, improve rankings, AND increase visibility in AI-powered search features
Impact on Client’s Business Provides useful competitive benchmarks; helps set realistic expectations about ranking difficulty
Tools for Measurement Moz (Domain Authority), Ahrefs (Domain Rating), Semrush (Authority Score)
Recommended Action Steps Use metrics to benchmark against competitors; focus on activities that improve authority (quality content, earned backlinks)
Common Pitfalls Obsessing over small fluctuations; treating the score itself as a goal rather than focusing on underlying improvements
Advanced Tips A DA 25 site competing against DA 70+ sites needs different expectations than competing at parity; set realistic improvement goals based on competitor analysis
Client Communication Strategy Clarify these are third-party estimates, not Google ranking factors; use DA/DR to set client expectations about ranking potential and timeline
Impact on Client’s Business Critical due to Google’s mobile-first indexing; mobile devices drive over 62% of global website traffic
Tools for Measurement Google Analytics 4, Swydo
Recommended Action Steps Compare engagement and conversion metrics between mobile and desktop; test on actual mobile devices regularly
Common Pitfalls Assuming responsive design is sufficient without testing mobile-specific issues; not checking client’s specific mobile split (varies by industry)
Advanced Tips Significant gaps between mobile and desktop engagement often indicate mobile UX problems hurting overall SEO performance
Client Communication Strategy Highlight the growing importance of mobile traffic and how mobile experience directly affects rankings across all devices
Impact on Client’s Business Correlates with user satisfaction metrics that Google’s algorithms increasingly prioritize
Tools for Measurement Google Analytics 4, Hotjar (for heatmaps)
Key Metrics Engagement Rate, Average Engagement Time per Session, Engaged Sessions per User, Scroll Depth (via custom events)
Benchmarks E-commerce bounce: 35-55%, Blog posts: 70-90%, Professional services: 50-75%
Common Pitfalls Misinterpreting high bounce rates without considering content type and intent
Advanced Tips Use heatmaps to identify and fix issues with high-bounce pages; add scroll depth tracking for content-heavy sites
Client Communication Strategy Explain when high bounce rate is acceptable (blog posts where users found their answer) vs. problematic (product pages signaling UX issues)
Impact on Client’s Business The definitive metric for proving SEO value; translates all other metrics into financial terms; 70% of marketers report SEO generates more sales than PPC
Tools for Measurement Custom Calculation, Google Analytics 4, Swydo automated reporting
Industry Benchmarks (3-year) Real estate: 1,389%, Financial services: 1,031%, B2B SaaS: 702%, Legal services: 526%, E-commerce: ~317%
Formula ROI (%) = (Revenue from Organic Search – Cost of SEO Services) ÷ Cost of SEO Services × 100
Common Pitfalls Relying solely on last-click attribution; not accounting for SEO’s compound value over time
Advanced Tips For B2B, track pipeline value using multi-touch attribution; assign estimated values to leads based on historical close rates; expect positive ROI within 6-12 months, peak results in years 2-3
Client Communication Strategy Regularly report ROI in financial terms; set expectations that SEO costs are front-loaded while returns compound over time
The 10 SEO Metrics That Drive Client Results
Each metric in this section connects to tangible business outcomes. We’ve included benchmarks, measurement approaches, and the context needed to interpret results accurately. Use this as a framework, then customize based on each client’s specific industry and goals.
1. Organic Traffic
Organic traffic measures how many visitors arrive through unpaid search results. While seemingly straightforward, this metric requires careful interpretation because raw visitor counts don’t reveal traffic quality or business value.
Benchmarks and Context
BrightEdge research found that organic search drives approximately 53% of all trackable website traffic, making it the largest single traffic source for most businesses. For B2B companies specifically, that figure rises to 64%. When combined with paid search, search channels account for 68% of all website traffic.
However, SE Ranking’s analysis indicates organic traffic’s overall share has decreased by approximately 3.65% as AI features capture user attention before click-through. This makes traffic quality metrics increasingly important alongside volume.
How to Measure Effectively
Create GA4 segments that isolate high-value organic visitors by tracking users who view multiple pages, spend significant time on site, or reach key conversion pages. Compare engagement metrics (average engagement time, engaged sessions per user) between traffic segments to identify which organic sources deliver the most valuable visitors.
Focus reporting on year-over-year trends rather than month-to-month fluctuations, which often reflect seasonality or algorithm volatility rather than campaign performance.
2. Conversion Rate from Organic Traffic
This metric links SEO efforts directly to revenue by measuring what percentage of organic visitors complete desired actions. Without conversion tracking, you can prove traffic increases but cannot demonstrate business impact.
Industry Benchmarks
FirstPageSage’s conversion data shows the average SEO conversion rate is 2.4%, with significant variation by industry.
Organic Conversion Rate Benchmarks by Industry
Percentage of organic visitors who complete desired actions
SEO leads close at 14.6% compared to just 1.7% for outbound marketing — demonstrating the intent advantage of organic search traffic.
Source: FirstPageSage Conversion Data, SeoProfy ROI Analysis
One statistic demonstrates why organic traffic quality matters: according to SeoProfy’s ROI analysis, SEO leads close at a 14.6% rate compared to just 1.7% for outbound marketing efforts. This 8.5x difference in close rates reflects the intent advantage of visitors who actively searched for solutions.
Implementation
Formula:
Set up conversion tracking in GA4 for both macro conversions (purchases, form submissions, demo requests) and micro conversions (newsletter sign-ups, resource downloads, video views). Use multi-touch attribution models for clients with longer sales cycles to ensure SEO receives appropriate credit for assists, not just last-click conversions.
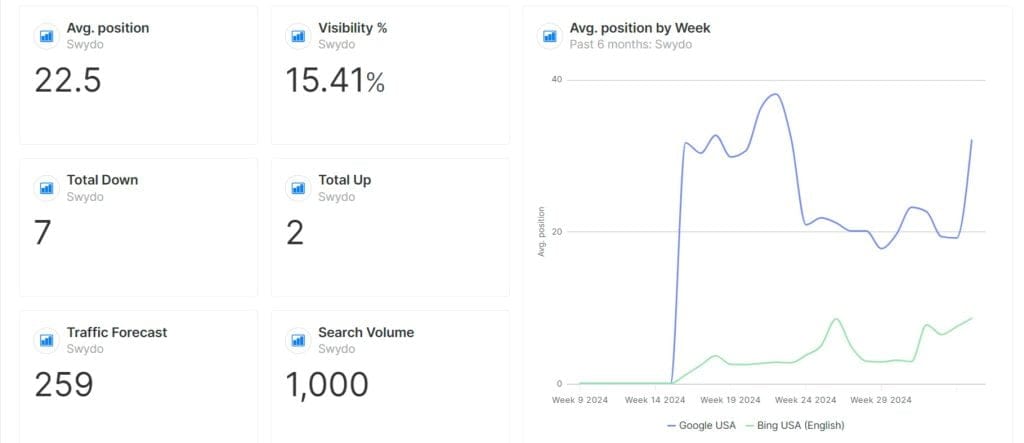
3. Keyword Rankings for Strategic Terms
Keyword rankings indicate visibility for specific search terms, but their value has become more nuanced. Position #1 no longer guarantees traffic when AI Overviews dominate informational queries, which means ranking strategy must account for SERP composition as well as position.
Strategic Considerations
Prioritize high-intent, transactional keywords where users are ready to take action. A #3 ranking for “enterprise HR software pricing” typically delivers more value than a #1 ranking for “what is HR software” because the former attracts decision-stage buyers while the latter attracts early-stage researchers who may never convert.
Track SERP features alongside rankings. If AI Overviews appear for your target keywords, monitor whether your content gets cited in those overviews, since citations can drive traffic even without traditional position #1 rankings.
Tracking Approach
Mix short-tail and long-tail keywords aligned with different customer journey stages. When reporting to clients, always correlate ranking changes with traffic and conversion metrics to demonstrate actual business impact rather than celebrating position improvements that don’t translate to results.
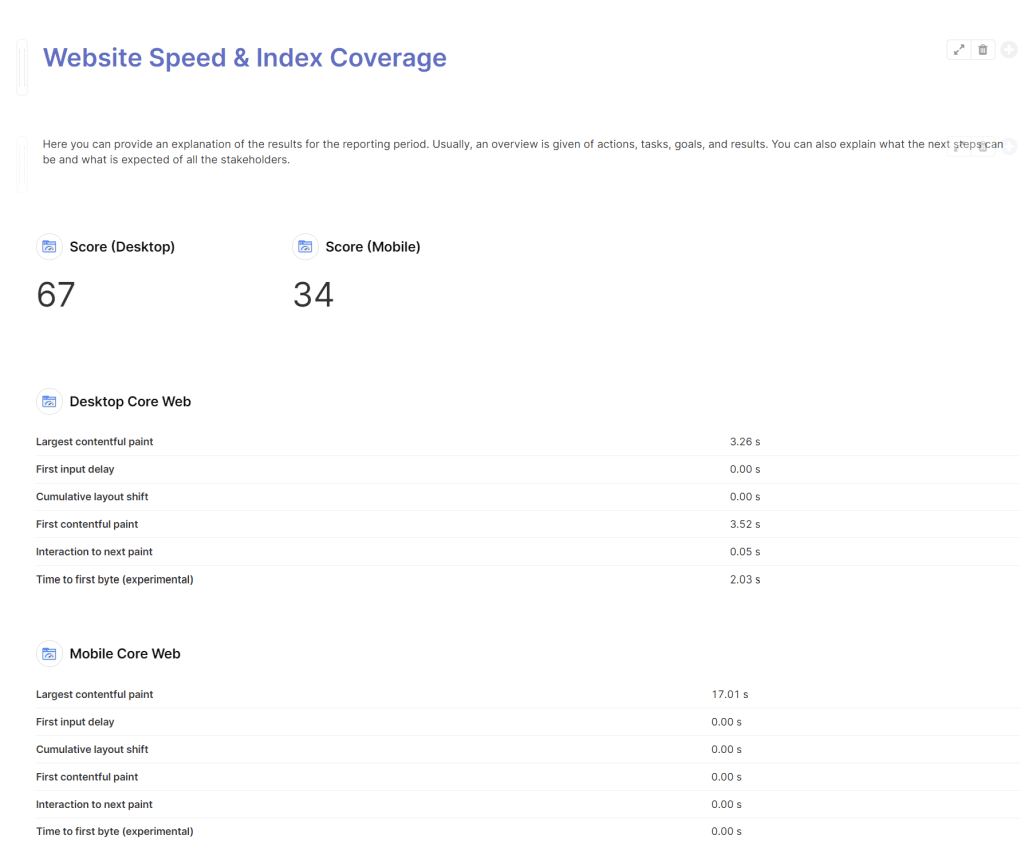
4. Core Web Vitals
Core Web Vitals measure user experience through loading performance, interactivity, and visual stability. Google has confirmed these as ranking factors, and they serve as tiebreakers when content quality is otherwise equal between competing pages.
Current Thresholds
Google’s official documentation specifies three metrics with “good” thresholds:
- LCP (Largest Contentful Paint): Under 2.5 seconds. This measures how quickly the main content becomes visible.
- INP (Interaction to Next Paint): Under 200 milliseconds. This replaced FID in March 2024 and measures responsiveness to user interactions.
- CLS (Cumulative Layout Shift): Under 0.1. This measures visual stability by tracking unexpected layout shifts.
Core Web Vitals: Google’s UX Ranking Factors
Meet these thresholds to pass Google’s page experience signals
LCP
Largest Contentful Paint
INP
Interaction to Next Paint
CLS
Cumulative Layout Shift
45-53%
of websites fail
Only 47-55% of websites meet all Core Web Vitals thresholds. Passing gives you a measurable competitive advantage.
Source: Google PageSpeed Insights, aTeam Soft Solutions Analysis
Competitive Opportunity
aTeam Soft Solutions’ analysis found that only 47-55% of websites meet all Core Web Vitals thresholds. For clients in competitive spaces, achieving “good” scores across all three metrics provides a measurable advantage over the majority of competitors who haven’t prioritized technical performance.
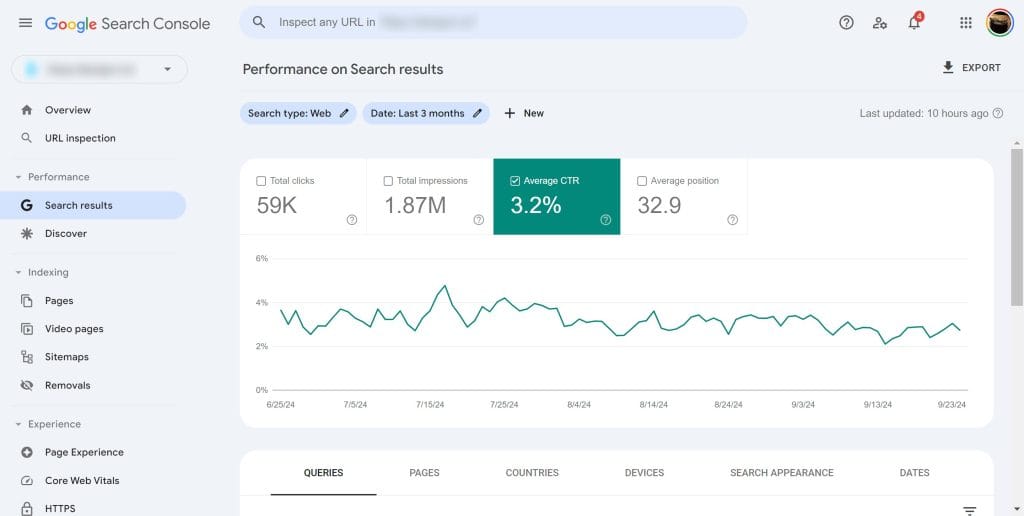
5. Organic Click-Through Rate (CTR)
Organic CTR measures how often users click your search listing after seeing it in results. This metric reveals how compelling your titles and descriptions are relative to competitors, and optimizing it can increase traffic without improving rankings.
Updated Benchmarks
The GrowthSRC study documented significant CTR declines across top positions, with the average decrease across positions #1-5 reaching approximately 17.92% year-over-year. Current benchmarks show position 1 averaging 19-27%, position 2 at 12.6-18%, and position 3 at 8.5-10%.
Seer Interactive’s research adds important context: organic CTRs for informational queries featuring AI Overviews dropped 61%, while queries without AI Overviews still saw a 41% decline. This suggests broader shifts in user behavior beyond AI features alone, possibly driven by users seeking answers through ChatGPT, Perplexity, and other platforms.
Optimization Tactics
Write title tags that communicate specific value and differentiate from competitors. Include the primary benefit or outcome rather than just describing what the page covers. Implement structured data markup to enable rich snippets that make your listing visually distinct in results.
Use Google Search Console to identify pages with high impressions but below-average CTR. These represent your biggest opportunities for traffic gains without ranking improvements.
.
6. Backlink Quality and Quantity
Backlinks signal to search engines that other websites consider your content valuable enough to reference. Quality has always mattered more than quantity, and this distinction has become even more critical as algorithms improve at detecting manipulative link patterns.
Why Quality Matters for AI Visibility
seoClarity’s research found that over 99% of AI Overview citations come from domains already ranking in the top 10 organic positions. This means your backlink profile affects visibility in AI-powered search features as well as traditional rankings. Building domain authority through quality links creates compounding benefits across multiple visibility channels.
Metrics to Track
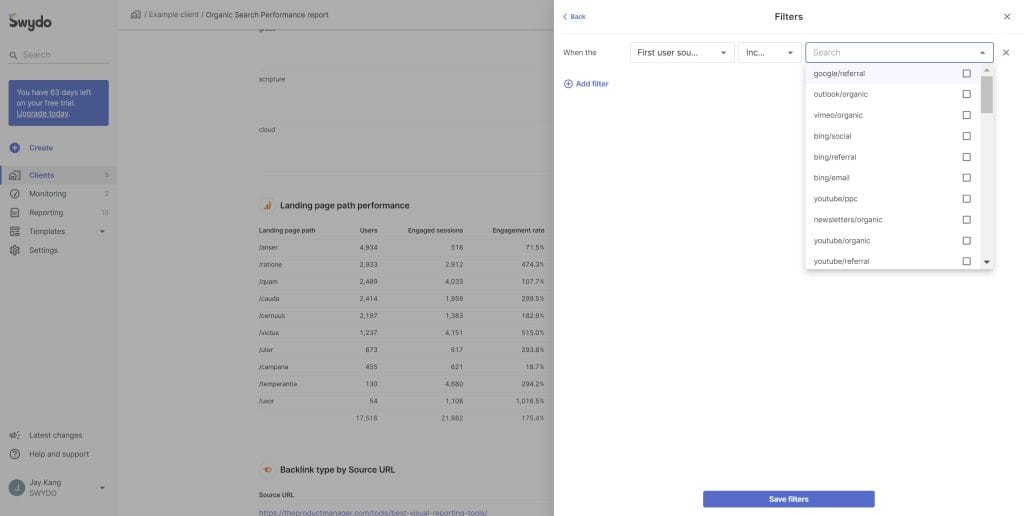
Monitor total referring domains alongside individual link quality and relevance. Track link acquisition velocity to ensure growth appears natural rather than artificially inflated. Analyze anchor text distribution to maintain a mix of branded terms, naked URLs, and keyword variations that reflects organic linking patterns.
Conduct quarterly toxic link audits using tools like Ahrefs or Semrush, but use Google’s disavow tool sparingly and only when you have evidence that specific links are causing problems.
7. Domain Authority and Comparable Metrics
Third-party authority scores from Moz (Domain Authority), Ahrefs (Domain Rating), and Semrush (Authority Score) provide useful competitive benchmarks, but they require careful interpretation because they don’t directly influence Google rankings.
Appropriate Uses
Use these metrics to set realistic expectations about ranking difficulty and to track directional progress over time. A site with Domain Authority 25 competing for keywords dominated by DA 70+ sites needs different expectations than a site competing at parity.
When reporting to clients, always clarify that these are third-party estimates based on link profiles, and that Google uses different signals internally. Focus on the activities that improve authority (quality content, earned backlinks) rather than treating the score itself as a goal.
8. Mobile Traffic Percentage
Google indexes the mobile version of websites first, which means mobile performance directly affects rankings across all devices. Understanding your client’s mobile traffic mix helps prioritize optimization efforts and identify experience gaps.
Current Statistics
Statista data cited in SE Ranking’s analysis shows mobile devices drive over 62% of global website traffic. This percentage varies by industry and audience, so check your client’s specific mobile split in GA4 rather than assuming the global average applies.
Optimization Priorities
Compare engagement and conversion metrics between mobile and desktop users. Significant gaps often indicate mobile experience problems that hurt overall SEO performance. Test your client’s site on actual mobile devices regularly because responsive design doesn’t guarantee good mobile UX.
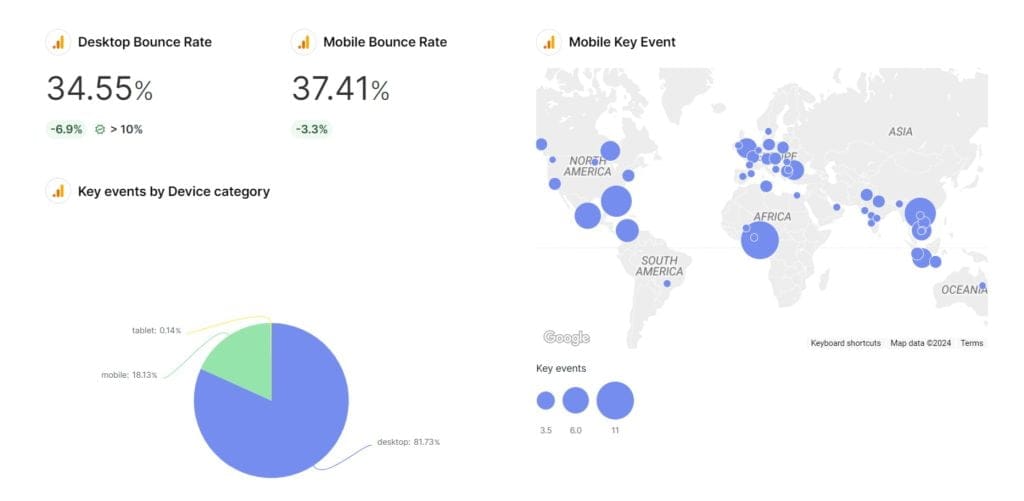
9. Engagement Metrics
GA4’s engagement metrics provide richer insights than traditional bounce rate by measuring how users actually interact with content. These signals correlate with the user satisfaction metrics that Google’s algorithms increasingly prioritize.
Key Metrics to Monitor
Track Engagement Rate (the inverse of bounce rate in GA4), Average Engagement Time per Session, and Engaged Sessions per User. For content-heavy sites, add scroll depth tracking through custom events to understand how far users read before leaving.
Interpretation Guidelines
A high bounce rate on informational blog posts may be acceptable if users found their answer quickly. A high bounce rate on product pages or service landing pages signals problems. Always interpret engagement metrics in context of page purpose and user intent.
Typical benchmarks vary by page type: e-commerce bounce rates run 35-55%, blog posts 70-90%, and professional services 50-75%. Compare your client’s pages against similar content types rather than site-wide averages.
10. Return on Investment (ROI)
ROI is the definitive metric for proving SEO value because it translates traffic and rankings into financial terms clients understand. Every other metric in this guide feeds into ROI calculation by contributing to revenue or efficiency gains.
Industry Benchmarks
FirstPageSage’s SEO ROI statistics show significant variation by industry when measured over a 3-year period.
SEO ROI by Industry (3-Year Average)
Return on investment varies significantly across sectors
Source: FirstPageSage SEO ROI Statistics, Databox Research
Timeline expectations matter when setting client expectations. According to the same research, positive ROI typically occurs within 6-12 months, with peak results in years 2-3 as content assets compound in value. Databox research cited by SeoProfy found that 70% of marketers report SEO generates more sales than PPC advertising.
Calculation Method
For B2B clients with longer sales cycles, use multi-touch attribution and track pipeline value rather than closed revenue alone. Assign estimated values to leads based on historical close rates and average deal size to demonstrate ROI before deals actually close.
Emerging Metrics: AI Visibility and Brand Authority
As AI reshapes search, agencies that track emerging visibility signals will demonstrate more complete performance pictures than those relying solely on traditional metrics. These measurements complement the core metrics above rather than replacing them.
AI Share of Voice
This metric tracks how often your client’s brand appears in AI-generated responses across platforms including Google AI Overviews, ChatGPT, Perplexity, and Gemini. As users increasingly get answers from AI summaries rather than clicking through to websites, visibility within those summaries becomes valuable in its own right.
Why Citations Matter
Seer Interactive’s research found that pages cited in AI Overviews receive 35% more organic clicks and 91% more paid clicks compared to pages that rank but aren’t cited. Being included in AI-generated answers provides measurable traffic advantages beyond traditional ranking position.
How to Track
Test your client’s top 30-50 target queries monthly across ChatGPT, Perplexity, and Google AI Overviews. Document which queries trigger AI responses, whether your client’s brand appears, and what competitors are cited instead. Several SEO platforms now include AI Overview tracking in their SERP feature reports, which can automate some of this monitoring.
Google Search Console includes AI Mode clicks under the “Web” search type, though separate filtering for AI-specific traffic isn’t available yet. Track overall performance trends and correlate with your manual AI visibility audits.

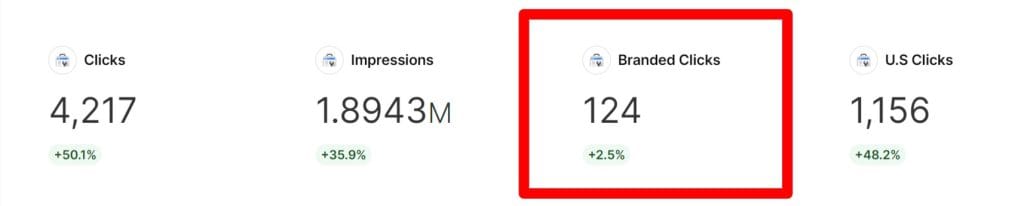
Branded Search Volume and Clicks
Branded search volume measures how many people search specifically for your client’s company or product names. This metric indicates brand awareness and often correlates with overall SEO resilience because strong brands maintain traffic through algorithm volatility better than unknown sites.
Strategic Value
Brands with strong search recognition get cited more often in AI responses and maintain more stable rankings during core updates. Correlate Google Search Console branded click data with GA4 direct homepage traffic to build a complete picture of brand strength in search.
Track competitor branded search volumes using tools like Semrush or Ahrefs to identify share of voice opportunities and benchmark your client’s brand awareness growth over time.
The Foundation: E-E-A-T and Content Quality
E-E-A-T (Experience, Expertise, Authoritativeness, Trustworthiness) describes the quality signals Google’s algorithms attempt to identify. While you cannot measure E-E-A-T directly in a dashboard, understanding this framework explains why certain content succeeds and helps diagnose why other content underperforms.
E-E-A-T: Google’s Content Quality Framework
The signals that determine long-term ranking stability
Experience
First-hand engagement with the topic being discussed
Expertise
Demonstrated knowledge and skills through accurate information
Authoritativeness
Recognition by others through backlinks and citations
— Google Search Quality Rater Guidelines
What Google’s Quality Raters Evaluate
Google’s Search Quality Rater Guidelines explicitly states that “Trust is the most important member of the E-E-A-T family because untrustworthy pages have low E-E-A-T no matter how Experienced, Expert, or Authoritative they may seem.”
Experience refers to first-hand engagement with the topic. Content written by someone who has actually done the thing they’re describing carries more weight than content compiled from other sources.
Expertise requires demonstrating necessary knowledge and skills through accurate, detailed information that experts in the field would recognize as credible.
Authoritativeness comes from recognition by others, manifested through backlinks from respected sources, mentions in industry publications, and citations by other experts.
Trustworthiness encompasses site security, factual accuracy, transparent author identification, and clear sourcing of claims.
Applying E-E-A-T to Client Content
Audit your client’s content against these criteria by asking specific questions: Does the author have verifiable credentials or experience in this topic? Are claims supported by citations or data? Does the site have clear contact information, privacy policies, and security certificates? Would an expert in this field consider this content accurate and comprehensive?
For YMYL (Your Money or Your Life) topics covering health, finance, safety, or legal matters, E-E-A-T requirements are especially strict. Content in these areas needs demonstrable expert authorship and rigorous accuracy to rank well.
Common Questions from Clients and Stakeholders
These questions come up repeatedly in client meetings and stakeholder presentations. Having data-backed answers ready positions you as a knowledgeable advisor rather than just a vendor.
What organic traffic growth rate should we expect?
Established sites typically see 10-20% year-over-year growth from consistent SEO investment. New sites or those recovering from penalties can see 50-100%+ growth in their first year of serious optimization. However, raw traffic growth matters less than quality improvement. If traffic increases 15% while conversion rate increases 25%, the business impact exceeds what either number suggests alone.
How long until we see results from SEO?
Technical fixes can show impact within weeks. Content and link building typically require 3-6 months to demonstrate meaningful results. According to FirstPageSage data, positive ROI typically occurs within 6-12 months, with peak results in years 2-3 as content assets accumulate authority and continue generating traffic without ongoing investment.
What ROI can we expect from SEO investment?
Industry averages range from approximately 300% for e-commerce to over 1,000% for real estate and financial services when measured over 3 years. A reasonable target for most B2B companies is 300-500% ROI. Remember that SEO costs are front-loaded while returns compound over time, so year 1 ROI will be lower than years 2 and 3.
Should we track AI search visibility?
Yes, with appropriate expectations about measurement maturity. AI visibility tracking tools are still developing, so current monitoring relies heavily on manual query testing. However, the data showing 35% higher click rates for AI-cited pages makes this worth tracking even with imperfect measurement. Start with manual audits of your top 30-50 keywords and expand as automated tools improve.
Key Takeaways
Effective SEO reporting connects activities to business outcomes. These principles guide that connection:
- Prioritize business impact over activity metrics. Conversion rates and ROI prove value more effectively than traffic volume or ranking positions alone.
- Quality matters more as AI features reduce overall clicks. The visitors you attract must convert at higher rates to maintain ROI as traffic share shifts.
- Context determines interpretation. Industry benchmarks, page types, and user intent all affect what “good” performance looks like.
- Track AI visibility alongside traditional metrics. Citations in AI-generated responses provide measurable traffic advantages.
- Build E-E-A-T systematically. Experience, expertise, authority, and trust signals determine long-term ranking stability.
- Cite your sources. Every statistic in your reports should be verifiable. This builds client trust and demonstrates your own expertise.
Use this guide as a framework, then customize based on each client’s industry, goals, and competitive landscape. The specific metrics that matter most will vary by business, but the principle of connecting measurements to business outcomes applies universally.
Showcase your client’s SEO results with Swydo. Request a demo or sign up for a free 14-day trial today.
SEO Metrics FAQ
Quick answers to common questions about measuring and reporting SEO performance
Metrics measure activity (clicks, rankings, bounce rates). KPIs measure progress toward business goals. The difference: “Traffic increased 25%” is a metric. “Traffic from buying-intent keywords increased 25%, generating 40 qualified leads worth $120,000 in pipeline” is a KPI. Always connect metrics to revenue or business outcomes when reporting.
Organic search drives approximately 53% of all trackable website traffic, making it the largest single traffic source for most businesses. For B2B companies, organic search accounts for 64% of traffic. When combined with paid search, search channels represent 68% of all website traffic.
E-E-A-T stands for Experience, Expertise, Authoritativeness, and Trustworthiness. Google’s quality guidelines state that Trust is the most important factor—untrustworthy pages have low E-E-A-T regardless of other signals. Strong E-E-A-T helps pages rank better and maintain stability through algorithm updates.
YMYL (Your Money or Your Life) pages cover topics that could significantly impact someone’s health, finances, safety, or wellbeing—including medical advice, financial guidance, legal information, and news. These pages face stricter quality requirements and need demonstrable expert authorship with rigorous accuracy to rank well.
Vanity metrics look impressive but don’t connect to business outcomes. Examples include raw traffic numbers without conversion data, rankings for low-intent keywords, total backlink counts without quality assessment, and impressions without click-through context. Focus instead on metrics tied to revenue, leads, or conversions.
The average SEO conversion rate is 2.4%, but this varies significantly by industry. Legal services average 7.5%, local services (HVAC, plumbing) 3.3%, B2B SaaS 2.1%, and e-commerce 1.8-2.3%. Compare your performance against industry benchmarks and your own historical data.
Divide the number of conversions from organic traffic by the total number of organic visitors, then multiply by 100. For example: 50 conversions ÷ 2,000 organic visitors × 100 = 2.5% conversion rate. Track both macro conversions (purchases, demos) and micro conversions (downloads, signups) for a complete picture.
SEO leads close at 14.6% compared to just 1.7% for outbound leads—an 8.5x difference. This happens because organic visitors are actively searching for solutions, indicating existing intent. Outbound leads haven’t expressed interest yet, requiring more nurturing before they’re ready to buy.
Macro conversions are primary business goals: purchases, form submissions, demo requests, or signed contracts. Micro conversions are smaller actions indicating progress: newsletter signups, resource downloads, video views, or adding items to cart. Track both—micro conversions often predict future macro conversions.
Create segments in analytics to isolate high-value visitors by tracking users who view multiple pages, spend significant time on site, or reach conversion pages. Compare engagement metrics (average engagement time, pages per session) between traffic segments. High-quality traffic has higher engagement and conversion rates, not just higher volume.
Core Web Vitals measure user experience through three metrics. Target these “good” thresholds: LCP (Largest Contentful Paint) under 2.5 seconds for loading speed, INP (Interaction to Next Paint) under 200 milliseconds for interactivity, and CLS (Cumulative Layout Shift) under 0.1 for visual stability. Only 47-55% of websites pass all three.
Current benchmarks show position 1 averaging 19-27% CTR, position 2 at 12.6-18%, and position 3 at 8.5-10%. CTRs have declined significantly due to AI features and SERP changes. If your CTR is below these benchmarks, optimize title tags and meta descriptions to communicate specific value and differentiate from competitors.
Domain Authority (Moz), Domain Rating (Ahrefs), and Authority Score (Semrush) are third-party estimates based on backlink profiles—they don’t directly influence Google rankings. Use them for competitive benchmarking and setting realistic expectations, but focus on the activities that build actual authority: quality content and earned backlinks.
Google uses mobile-first indexing, meaning it primarily uses the mobile version of your site for rankings. Mobile devices now drive over 62% of global website traffic. If mobile users have worse engagement or conversion rates than desktop users, it signals mobile experience problems that hurt your overall SEO performance.
Context matters more than the number. Blog posts typically have 70-90% bounce rates (acceptable if users found their answer). E-commerce pages run 35-55%, and professional services 50-75%. A high bounce rate on product or service pages signals problems; on informational content, it may be fine. Compare against similar page types, not site-wide averages.
Quality matters significantly more. One backlink from a relevant, authoritative site provides more value than dozens from low-quality sources. Track total referring domains, but focus on acquiring links from sites with genuine authority in your industry. Algorithms have become increasingly effective at detecting and devaluing manipulative link patterns.
AI Overviews have significantly reduced CTRs. Position #1 CTR dropped 32% (from 28% to 19%), and position #2 dropped 39%. Informational queries with AI Overviews saw 61% CTR declines. However, positions 6-10 actually saw 30% CTR increases, likely because AI Overviews often fail to fully satisfy user intent.
Over 99% of AI Overview citations come from domains already ranking in the top 10 organic positions. Focus on traditional SEO fundamentals: build domain authority through quality backlinks, create comprehensive content demonstrating expertise, and maintain strong technical SEO. There’s no shortcut—sites that rank well get cited.
AI share of voice measures how often your brand appears in AI-generated responses across platforms like Google AI Overviews, ChatGPT, and Perplexity. Pages cited in AI Overviews receive 35% more organic clicks than uncited pages. Track your top 30-50 keywords monthly to monitor AI visibility alongside traditional rankings.
Branded search volume indicates brand awareness and correlates with SEO resilience. Strong brands maintain more stable traffic through algorithm updates and get cited more often in AI responses. Track branded clicks in Google Search Console and correlate with direct traffic to measure brand strength in search over time.
Technical fixes can show impact within weeks. Content and link building typically require 3-6 months for meaningful results. Positive ROI usually occurs within 6-12 months, with peak results in years 2-3 as content assets accumulate authority. SEO costs are front-loaded while returns compound over time.
Three-year ROI varies significantly by industry: real estate averages 1,389%, financial services 1,031%, B2B SaaS 702%, legal services 526%, and e-commerce 317%. A reasonable target for most B2B companies is 300-500% ROI. Research shows 70% of marketers report SEO generates more sales than PPC advertising.
Use this formula: (Revenue from Organic Search – Cost of SEO Services) ÷ Cost of SEO Services × 100. For B2B with longer sales cycles, track pipeline value using multi-touch attribution. Assign estimated values to leads based on historical close rates and average deal size to demonstrate ROI before deals close.
Established sites typically see 10-20% year-over-year growth from consistent SEO investment. New sites or those recovering from penalties can see 50-100%+ growth in their first year. Focus on quality improvement alongside volume—if traffic grows 15% while conversions grow 25%, the business impact exceeds either number alone.
Connect every metric to business outcomes. Show pipeline value from organic leads, compare SEO lead close rates (14.6%) versus outbound (1.7%), calculate customer acquisition cost versus other channels, and track revenue attributed to organic traffic. Present year-over-year trends rather than month-to-month fluctuations that reflect seasonality.
Multi-touch attribution distributes conversion credit across all touchpoints in a customer journey, not just the last click. This matters because SEO often assists conversions that other channels close. Without multi-touch attribution, SEO gets undercredited for its role in driving awareness and consideration before final purchase.
Track the SEO metrics that matter and prove your agency’s value to clients with precision.
Start Your Free Trial Today