Tracking and sharing Google Ads KPIs is one of the most measurable and transparent performance indicators to show the value of your Google Ads efforts to your clients.
A staggering 92% of customer purchases occur through searches on Google. This means if you’re a PPC marketer, Google Ads is one of the most effective platforms to run your campaigns.
And if you’re tracking those campaign results, you have tons of metrics, KPIs, and a wealth of data to mine and report on. Knowing what you should be tracking can be overwhelming, so we are here to help you.
Why it’s crucial to analyze your Google Ads performance
Tracking your Google Ads KPIs allows you to measure the effectiveness of your ad campaigns in the most quantifiable way. You’ve created and launched an outstanding campaign, now it’s time to take the next step and see how it’s performing. And what better way to do that than by tracking statistics that drive your business? Think of it like looking through a crystal ball. You must also figure out what you want to achieve with your campaign. Are you seeking more website traffic, increased brand awareness, or higher sales? Once you know your goals, you can zero in on the correct statistics and watch your success soar. By tracking your KPIs, you can make better decisions, optimize your campaigns, and spend money only where they move the needle.
By analyzing your Google Ads KPIs, you:
- Know which campaigns generate the most leads depending on your goals
- Determine which keywords and ad groups are getting you the best results
- Identify areas of improvement and cut back or allocate your budget wherever necessary
Choosing Google Ads KPIs depending on your campaign goals
There is no one size fits all KPIs to choose from. The metrics you choose vary from business to business. If you’re an e-commerce marketer using Google Ads, your KPIs will vary from that of a B2B company that primarily uses the platform to generate leads. PPC and SEO expert Veronika Holler says: “Analysis and reporting are the A to Z of successful campaigns. The most important KPI for me is the conversion value – but of course, the KPIs depend on the campaign’s goals. If I have a brand awareness campaign, I look at the impressions and clicks. Ultimately, however, I bring everything together and examine the revenue.”
The bottom line is to track the data driving your business goals and bringing in the revenue, and you want to keep a close eye on those numbers. A good way to start this is by defining your overall advertising goal and tying that in with the core of Google Ads data.
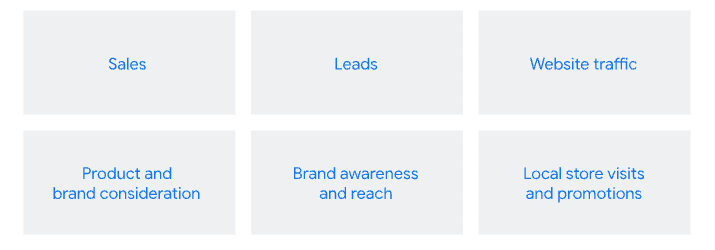
For instance, branding campaigns aim to increase your brand visibility and reach a wider target audience. Achieving these goals is possible by creating Google Ads video and display campaigns and utilizing the brand awareness and reach objective, which can increase website traffic and stimulate customer engagement with your brand. Besides the usual brand awareness metrics like impressions, unique reach, and avg. impression frequency, you should also take into account the following metrics:
- Maximum cost-per-thousand-impressions (max. CPM)
- Average cost-per-thousand-impressions (avg. CPM)
- All video sequence impressions (All video seq. impr.)
- Watch time and avg. watch time / impr
These will tie together your brand awareness and reach campaign goals. It’s important to note that the goal is to reach a wider audience, and while conversions are crucial, they aren’t the key metric for this type of campaign.
Whereas, while running a Google Ads sales campaign, your KPIs would focus on ROAS (return on ad spend), cost of conversion, and the average cost per click. Similarly, a local store visits and promotion campaign would focus on store visits, store sales, call clicks, direction clicks, impressions, the geographic performance of the ad, etc.
However, some standard metrics remain constant and can be the key performance indicators you should always track in your reports and dashboards.
Standard Google Ads metrics you should track in your reports
The goal is to get insights into your ad performance and optimize it over time for better results. How well are your leads converting? Is the cost per lead too high? Are your clients getting the best returns for their marketing buck?
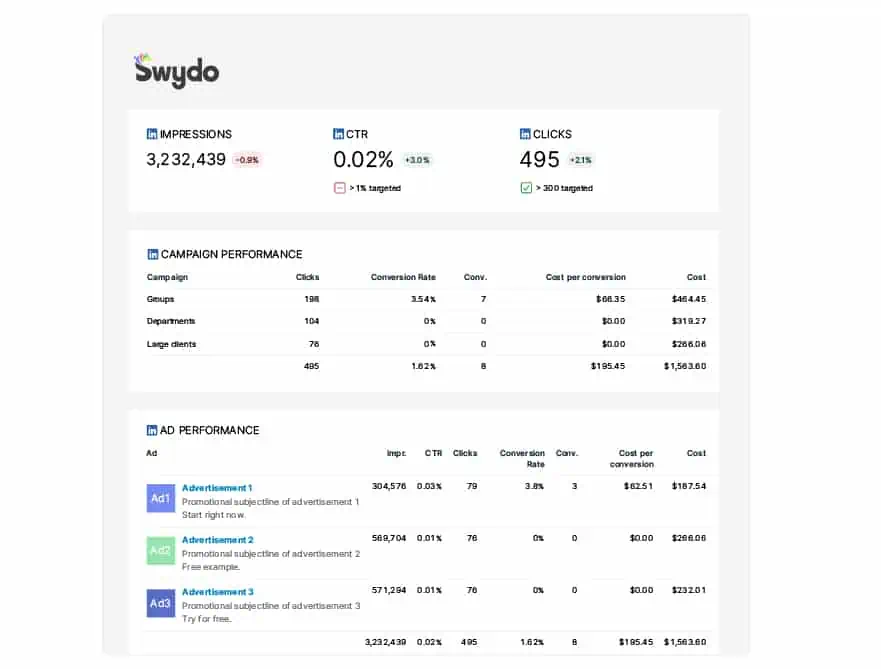
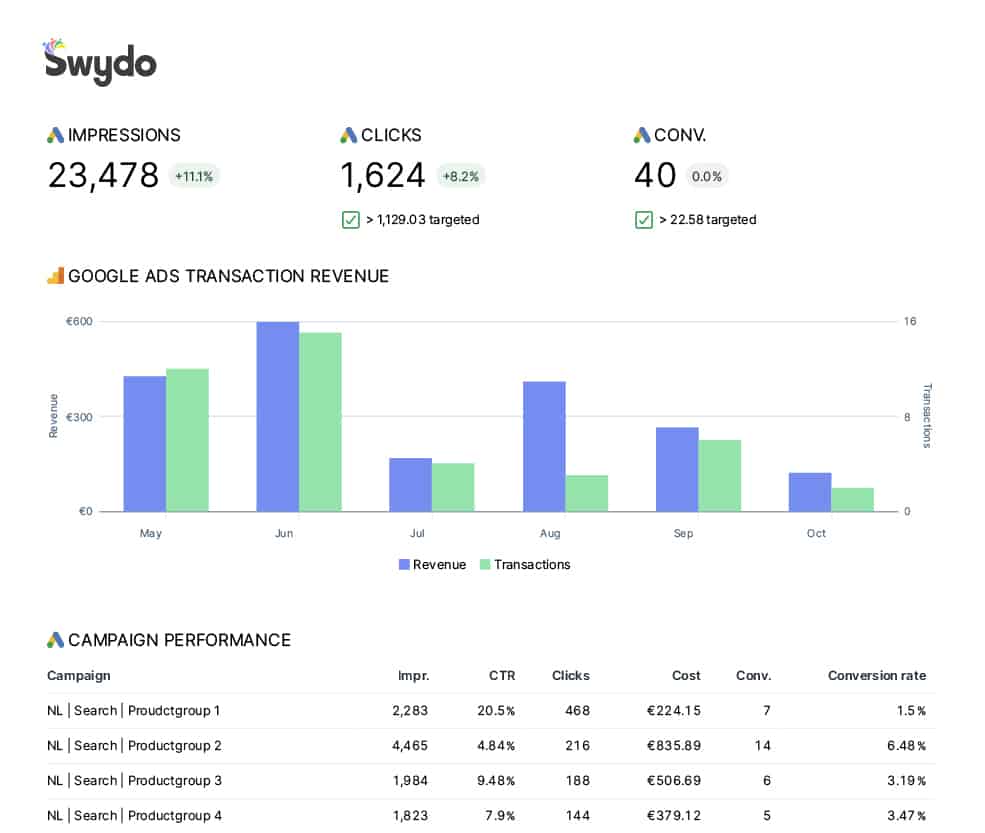
Tracking these Google Ads KPIs will help you get a detailed overview of these numbers. With Swydo, you can start with a preset Google Ads Report template filled with all these important KPIs and more.
Let’s simplify these for you:
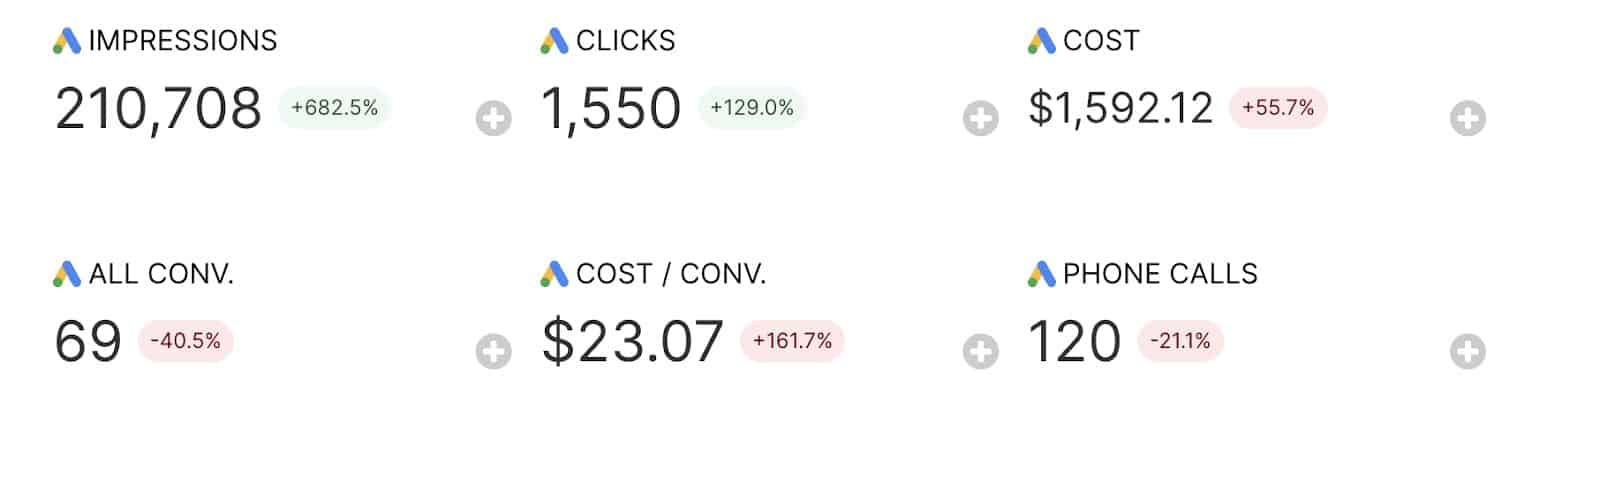
1. Impressions
This metric tells you the number of times your ad has been displayed or seen, whether clicked or not. Each time your ad appears on Google or the Google Network, it’s counted as one impression.
What can you do to improve impressions? The quickest way to boost this number is to increase your ad budget, as it controls how often your ad is shown to your target group. Having said that, improving the quality of content and imagery in your ad creative is also a cost-effective way to boost your impressions. Use crisp, error-free copy and visually appealing images or videos as it reflects on your brand quality and also increases your brand awareness.
2. Clicks
It’s called pay-per-click for a reason, right? Simply said, this metric demonstrates the number of times your ad was clicked. But don’t solely focus on this metric, you need to look at both this and CTR for a holistic picture of your campaign performance.
3. Click Through Rate (CTR)
The difference between CTR and clicks is that clicks refer to the number of times users click on your ad, while CTR represents the proportion of clicks relative to the total number of times your ad was shown (impressions). Clicks give you the raw number of interactions, whereas CTR provides a percentage that offers insights into your ad’s performance.
More often than not, advertisers do not pay attention to their ad copy and landing page, which is one of the reasons why your ad may have a reasonable click-through rate but not a high conversion rate.
What can you do to improve CTR? Google Ads Specialist Nick Jervis explains: “Optimizing your ad copy and landing page is one of the most essential aspects. With an overload of multiple client campaigns, advertisers rely on Google AI’s suggestions to improve their ad copy and spend almost no time writing a good landing page. It is an incredibly important part of the process, and if you see people clicking on your ad but not converting – you know where the error lies. You’re paying for those clicks, and if they don’t turn into clients, you need to realign your messaging proposition and make sure your copy is relevant to the keywords you’re targeting.
4. Cost
This is how much advertisers spend for their ads to appear in front of their audience. There are two ways in which this is evaluated in Google Ads:
- Cost Per Click (CPC): This metric is how much the advertiser spends each time someone clicks on their ad. For Google’s Search Network, the average CPC is $1 to $2, whereas for Google’s Display Network, it is $1 or less. This is an interesting metric to track because if your campaigns are well-optimized over a period of time, you will see a gradual decline in your CPC.
- Cost Per Acquisition (CPA): This is the amount of money you need to pay to Google each time someone does something you want them to do after seeing your ad, like buying something from your website or filling out a form. The average amount you’ve been charged for conversion from your ad.
What can you do to reduce costs? Since these are very specific actions, the ad viewer’s experience on your website or landing page matters the most. Focus on improving the quality of content, focus on highly relevant keywords, and how closely your ad matches the intent behind a user’s search. Prune through the search terms daily and add the search term as a phrase match or negative keyword. Do not leave any search term with an impression > 10 or click > 1 untouched. The key is to give users what they want.
5. Conversion
This is what you make of it. Simply said, you determine what conversion means to you. It’s not a fixed metric, and you can set up conversion tracking within your Google Ads account to measure your conversion rate effectively.
6. All Conversions
How is this different from conversions? When Google Ads tracks conversions, it’s only tracking conversions generated from the ads and not everything happening behind the scenes. The “All Conversion” metric measures sales not only through ads but also all the other conversions like page views, sign-ups, etc. This flexible metric gives you a broader view of how your business is performing.
To start using All conversions, you’ll need conversion tracking, including website, phone call, store visits, or in-app conversion tracking.
7. Phone Calls
An often overlooked metric. It is an important one to track, especially when tracking lead generation. For local businesses, phone calls could also be used for sales tracking. Phone call tracking can be a valuable piece to bring together your Google Ads reporting puzzle.
These seven KPIs are a great starting point for your Google Ads performance reporting. More often than not, you would want to customize your reporting metrics and KPIs depending on your clients and stakeholders and show your impact where it matters most. One of the easiest ways of tracking your marketing ROI is with Swydo.
How to use Swydo to improve and customize your Google Ads reporting
Integrate all your Google Ads data seamlessly into one platform, making it easily accessible and understandable. No more wasted time trying to make sense of multiple spreadsheets and reports.
Use Swydo’s Google Ads Integration to track Google Ads Metrics effortlessly. Monitor your campaign and see how you’re progressing toward your goals. Help your clients gain insights into campaign performance and ROI.
You can also display your Ad creatives in your report and add text commentary to explain the ‘why’ behind your strategy and budget allocation ideas!
Get in touch
Setting up your Google Ads reports or dashboards is easy with Swydo. Schedule a walkthrough, and we will answer all your questions and show you how to leverage our reporting and monitoring platform. Prefer doing it on your own? Visit our help center, check out the video tutorials, contact us through live chat, or email support@swydo.com.
Kernwoorden: Client reporting, Google Ads, KPIs