We get it – nobody loves creating client reports.
They often feel like a tedious chore, something you squeeze in between brainstorming sessions and client meetings.
But here’s the reality: those reports are far more powerful than you might think.
It’s not just about sending your clients a monthly update filled with metrics and charts (though those are important too).
What is Client Reporting?
At its core, client reporting is your agency’s way of telling a story. It’s how you showcase your hard work, demonstrate your value, and build a stronger partnership with your clients. It’s the bridge between your day-to-day efforts and your client’s business goals.
Think of client reporting as your monthly (or weekly, or quarterly) chance to:
- Show your clients exactly what you’ve been up to
- Celebrate the wins (big and small)
- Tackle challenges head-on
- Prove that their investment in your agency is paying off
In the following sections, we’ll dive into why client reporting is far more powerful than you might think, and how it can become your secret weapon for agency success.
1. Transparency Cultivates Trust
Trust is everything. Clients need to know they can rely on you, that you’re not just spinning numbers or hiding behind confusing jargon. That’s where transparent reporting comes in.
Think of your reports as a window into your agency’s operations. When that window is clear, clean, and shows the full picture – the wins, the losses, and everything in between – it builds trust.
It shows clients you’re not afraid to own your mistakes and that you’re committed to continuous improvement. This level of openness builds a sense of partnership, where clients feel informed and valued, not just another account on your roster.
- Open the lines of communication: Encourage consistent communication through regular reports, ensuring clients stay informed and engaged. It’s like having a standing weekly meeting, without actually having to schedule one.
- Showcase tangible value: Highlight the concrete impact of your work through reports, justifying the client’s investment and reinforcing your value proposition.
- Builds confidence: Transparency builds confidence in your agency’s capabilities and creates a sense of partnership. When clients see you’re upfront about everything, they’re more likely to trust your recommendations and strategies.
- Set clear expectations: Craft an initial client report that outlines what the client should expect in both the short-term and long-term. Include benchmarks, goals, and initial data points to demonstrate your plan and set the stage for a successful collaboration from the get-go.
- Differentiate your agency: In a crowded marketplace, quality reporting sets you apart. When prospective clients see that your agency goes beyond just running campaigns and also provides in-depth, actionable insights, you instantly stand out.
A clear view of all facets of a campaign or project gives clients a realistic perspective, creating an environment of trust and open collaboration. Transparency is the foundation upon which lasting client relationships are built.
2. Accountability in Action
Reports aren’t just about pretty graphs and impressive numbers. They’re a powerful statement of accountability. When you consistently deliver detailed reports, you’re demonstrating that you take ownership of your work.
You’re not just throwing strategies at the wall and hoping something sticks; you’re meticulously tracking progress, analyzing results, and making data-driven decisions. It’s proof that you’re not just winging it; you’re invested in their success.
- Take Ownership: Reports show that you’re responsible for both successes and setbacks, creating a sense of reliability and commitment. Be upfront about challenges and showing how you’re proactively addressing them.
- Manage Expectations: Clear reporting helps establish and manage client expectations, keeping everyone is on the same page regarding goals and deliverables, much like a roadmap for your collaboration, keeping everyone aligned and focused.
- Solve Problems Proactively: Use reports to identify potential issues early, allowing you to take corrective action before problems escalate. Show clients that you’re proactive, not reactive, and always one step ahead.
When you show clients you’re responsible and care about their needs, they know you’re on their side. This proves you’re not just another vendor, but a real partner who wants them to succeed.
3. Empower Your Clients with Knowledge
The best client reports don’t just dump data; they translate it into actionable insights. Instead of overwhelming clients with raw numbers, break down what those numbers mean for their business. Show them how your efforts are directly impacting their bottom line. The best client reporting tools offer features that help you go beyond raw data, providing visualizations and summaries that make insights clear and accessible for your clients.
- Educate and Explain: Reports help clients understand the complexities of marketing and the strategies you’re using. Clarify the process and enable them to make informed decisions.
- Drive Data-Driven Decisions: Provide clear insights, which will give clients the power to make informed decisions about their marketing investments. Give them the confidence to say “yes” to the strategies that are working and “no” to those that aren’t.
- Strengthen Collaboration: When clients understand the data, they can actively participate in strategy discussions and contribute valuable feedback. Create a two-way dialogue where everyone feels heard and valued.
It’s also vital to communicate the significance of your findings – and your role in uncovering them. Use reports to call attention to your discoveries and any issues that still need to be addressed. Open communication can go a long way in earning trust, even if there were miscalculations that caused your team to change course.
When plans don’t go as intended, you can still emphasize what actions were taken and what is being done instead. Explaining how you settled on certain approaches can show that you learn from your mistakes, build trust and gain future business.
You’re the expert, but that doesn’t mean clients should be left in the dark. Educating them about the data allows them to become true partners in their marketing journey.
Akvile DeFazio, a digital advertising specialist at @AkvileDeFazio and @AKvertise with a passion for clear communication, understands the importance of educating clients. As she puts it,
‘It’s important to be transparent about changes…and educate the client on how to read the data…[and] understand user behavior…’ she says. To do this, she suggests using reports to ‘show how much weight certain channels hold and how they impact the bottom line…educate them about conversion funnels, user behavior, and how to read the data…’
Ultimately, she believes this leads to better client retention.
4. Champion True Partnerships through Collaboration
Reporting on a regular basis creates a natural rhythm for communication and collaboration. It’s a dedicated time to celebrate wins, troubleshoot challenges, and brainstorm new strategies. It transforms the client-agency relationship from a transactional one into a true partnership, where both sides are working together towards a shared goal.
- Open Dialogue: Reports enable ongoing conversations, ensuring both parties are aligned and working towards the same objectives. Create a space for open and honest communication, where ideas can flow freely.
- Shared Ownership: Involve your clients in the reporting process to create a sense of shared responsibility and investment in the outcomes. Make them feel like they’re part of the team, not just a passive recipient of your services.
- Adaptability: Regular feedback allows you to adapt your strategies based on client input and changing market conditions. It’s about being agile and responsive, showing clients that you’re always listening and willing to adjust course if needed.
- Built-in, Regular Check-in: Well-written client reports as an ongoing dialogue, not a monologue you deliver from on high. They’re a dedicated time to celebrate wins, acknowledge losses, and discuss the next steps.
Effective communication of these aspects allows agencies to validate their strategies and strengthen a collaborative environment where both parties can strategize and pivot based on tangible insights.
5. Drive Growth and Keep Clients Coming Back
Client reporting isn’t just about keeping existing clients happy; it’s about driving growth for your agency. When clients see consistent results and understand the tangible value you bring, they’re more likely to renew contracts and even expand their engagement. Think of reports as a subtle yet powerful sales tool, showcasing your expertise and opening doors to new opportunities.
- Demonstrating ROI: Reports clearly illustrate the return on investment clients receive from your services, making it easier to justify continued or increased spending. Show clients that their marketing dollars are working hard for them.
- Building Loyalty: Consistent, positive results nurture client loyalty and increase the likelihood of long-term partnerships. Prove your worth time and time again, earning their trust and their business.
- Generating Referrals: Satisfied clients are more likely to recommend your agency to others, leading to organic growth and new business opportunities. It’s about turning your clients into your biggest advocates.
- Proof Points for Retention: When clients see their goals met and can trace a line from your actions to those outcomes, they’re likely to stay. Reports that continually deliver insights and show value retain clients while turning them into advocates.
- Upselling and Expansion: Effective reporting plays a key role in upselling. When clients see their goals met and can trace a line from your actions to those outcomes, they’re more likely to consider expanding the scope of your services
Marketing agencies understand that communication, transparency, working relationships, and campaign performance are the top factors influencing client retention–all of which are covered by solid client reporting.
6. The Unexpected Benefits Hidden Within the Data
While data is at the heart of client reporting, the benefits extend far beyond spreadsheets and charts. Regular reporting strengthens relationships, enhances your agency’s reputation, and provides peace of mind for clients. It allows you to proactively address challenges, celebrate successes together, and build a true partnership based on trust and mutual respect.
- Strengthened Relationships: Reports create opportunities for meaningful interactions, create a deeper understanding and connection with clients. Go beyond the numbers and building genuine rapport.
- Enhanced Reputation: Consistent, high-quality reporting builds your agency’s credibility and positions you as a leader in the industry.
- Client Peace of Mind: Regular updates and insights alleviate client anxieties and builds confidence in your agency’s capabilities.Provide reassurance and demonstrate that you’re on top of their campaigns.
- Proactive Problem-Solving: Reports demonstrate your commitment to their success. Reassure clients by showing that you’re actively managing and addressing any challenges in their campaigns.
Benefits of Client Reporting: Detailed Examples
The table below provides a comprehensive overview of the key benefits of client reporting and illustrates how each benefit can be effectively showcased through specific report elements. For every benefit, we outline actionable components to include in your reports, offer practical examples, and explain how these elements enhance client perception.
This detailed guide not only highlights why client reporting is essential but also how to implement it in a way that builds trust, ensures accountability, and enables your clients with valuable insights.
| Benefit | Report Element | Example | Client Perception |
|---|---|---|---|
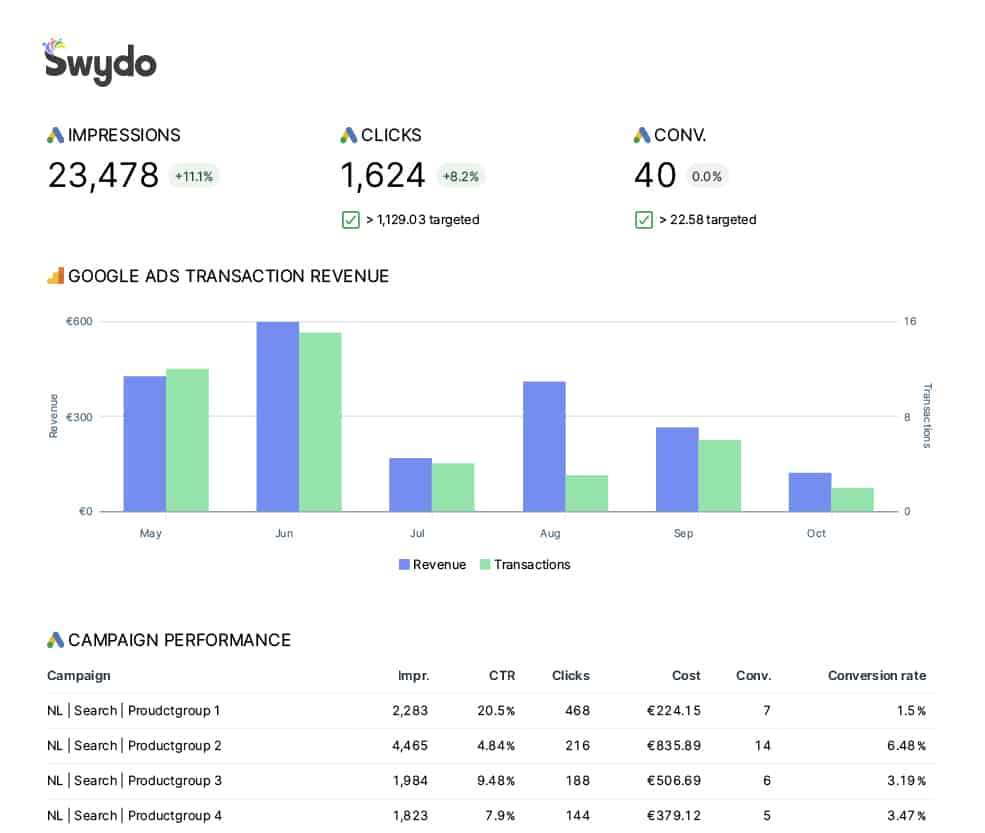
| Transparency Cultivates Trust | Comprehensive Data Breakdown | Detailed analytics on campaign performance, including impressions, clicks, conversions. | Clients see the full scope of activities and results, providing trust in data accuracy. |
| Clear Visuals | Use of charts and graphs to represent data trends and outcomes. | Clients easily understand complex data through visual representation. | |
| Honest Reporting of Challenges | Include sections that discuss underperforming areas and steps taken to address them. | Clients appreciate transparency about setbacks and trust your commitment to improvement. | |
| Benchmark Comparisons | Compare current performance metrics against previous periods or industry standards. | Clients can gauge progress and understand relative performance. | |
| Goal Tracking | Progress indicators showing how current results align with predefined goals. | Clients see clear alignment between actions and objectives, reinforcing trust. | |
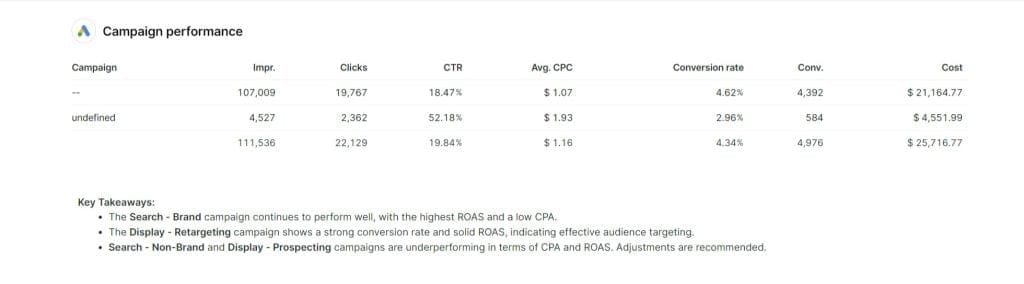
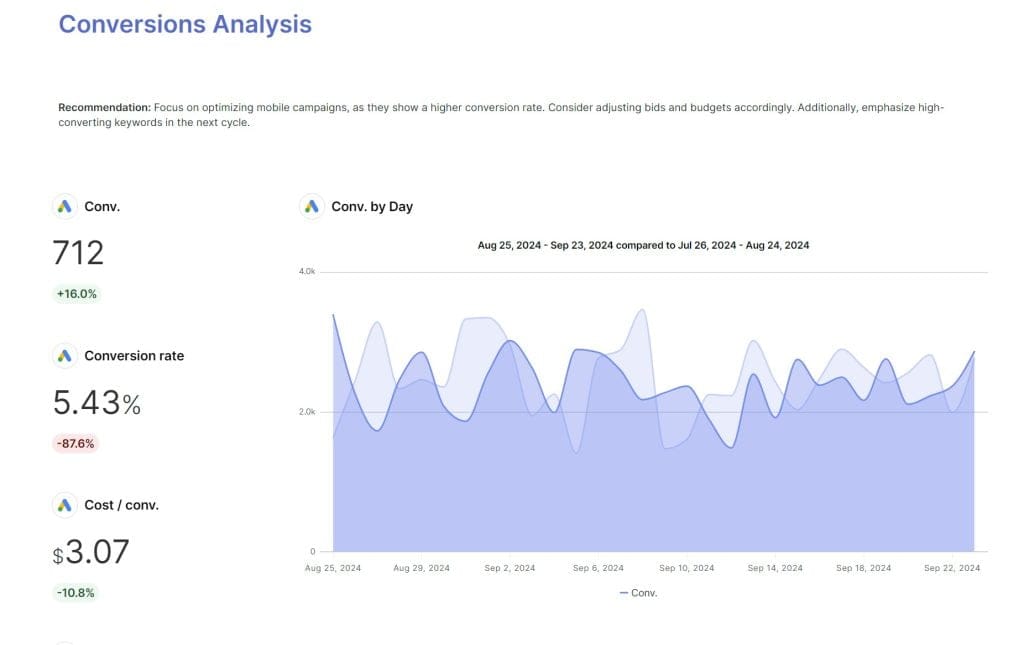
| Accountability in Action | Actionable Insights | Recommendations based on data analysis to optimize future campaigns. | Clients recognize your proactive approach and responsibility for their success. |
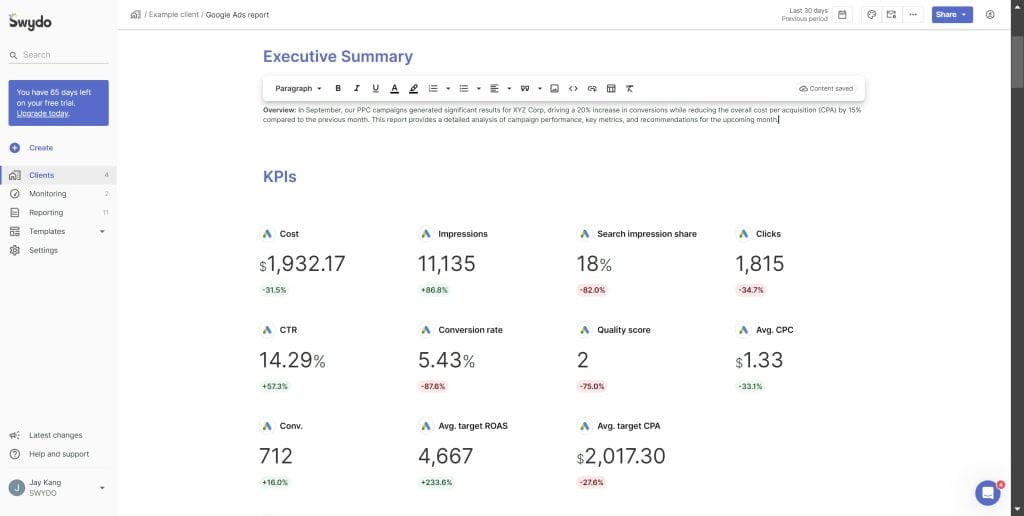
| Performance Metrics | Key Performance Indicators (KPIs) such as ROI, CPA, and conversion rates. | Clients understand the tangible outcomes of your strategies, ensuring accountability. | |
| Monthly Performance Summaries | Executive summaries highlighting major achievements and areas for improvement. | Clients receive concise overviews, supporting your commitment to their goals. | |
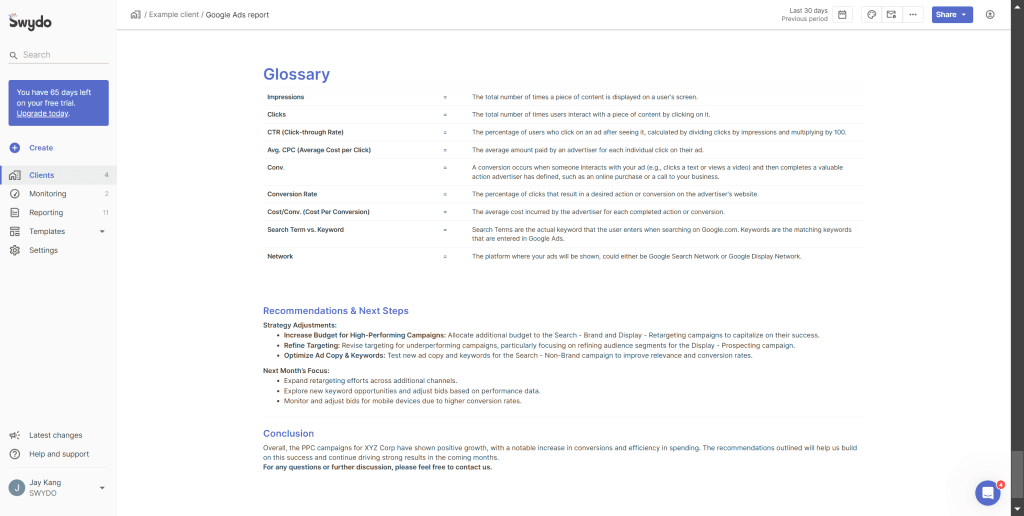
| Enable Your Clients with Knowledge | Educational Content | Glossary of terms, explanations of strategies, and insights into industry trends. | Clients gain a better understanding of marketing processes, empowering informed decisions. |
| Interactive Dashboards | Dashboards that allow clients to filter and explore data on their own. | Clients feel enabled to analyze data independently, enhancing their engagement. | |
| Case Studies and Success Stories | Examples of successful campaigns and the strategies that led to them. | Clients see real-world applications of your methods, increasing their confidence. | |
| Champion True Partnerships through Collaboration | Feedback Sections | Dedicated areas for clients to provide feedback and suggestions. | Clients feel heard and valued, builds a collaborative relationship. |
| Joint Strategy Sessions | Scheduled meetings to discuss report findings and adjust strategies accordingly. | Clients are actively involved in decision-making, strengthening partnership bonds. | |
| Shared Goal Setting | Collaboratively set short-term and long-term goals within reports. | Clients are aligned with your objectives, ensuring mutual commitment. | |
| Transparent Communication Channels | Provide contact information and regular updates outside of reports. | Clients have easy access to communication, enhancing trust and collaboration. | |
| Drive Growth and Keep Clients Coming Back | ROI Analysis | Detailed calculation of return on investment for each campaign. | Clients see the value of their investment, encouraging continued collaboration. |
| Growth Metrics | Tracking metrics like customer acquisition, retention rates, and revenue growth. | Clients observe tangible growth indicators, strengthening their decision to stay. | |
| Referral Program Highlights | Showcase successful referrals and their impact on business growth. | Clients recognize the benefits of referring others, promoting loyalty. | |
| Upsell Opportunities | Identify and suggest additional services that can benefit the client. | Clients see potential for further growth and value in expanding services. | |
| Success Metrics | Highlight key achievements and milestones reached through your services. | Clients feel confident in your ability to drive success, increasing retention. | |
| The Unexpected Benefits Hidden Within the Data | Trend Analysis | Identify emerging trends and how they affect the client’s business. | Clients gain insights into market dynamics, aiding strategic planning. |
| Predictive Analytics | Forecast future performance based on current data patterns. | Clients can anticipate outcomes and make proactive decisions. | |
| Segmentation Reports | Break down data by customer segments to identify high-performing groups. | Clients understand which segments to target for maximum impact. | |
| Anomaly Detection | Highlight unusual patterns or spikes in data that require attention. | Clients are alerted to potential issues or opportunities early on. |
Read our client reporting best practices to continue with your journey.
Conclusion
Client reporting is more than just a necessity; it’s a strategic advantage.
When you focus on transparency, accountability, and data-driven insights, you strengthen client relationships, fuel your agency’s growth, and position yourself as a trusted partner.
So, the next time you’re tempted to rush through a client report, remember its true power.
As Ryan Gould, Vice President of Strategy and Marketing Services, Elevation Marketing emphasizes,
Your client reports present a multitude of opportunities; not only do they let you connect better with your clients, but they allow you to showcase your value… Start by investing in some relevant data-capture tools, finding out what your clients actually want and need from you, and presenting their reports in a way that’s easy to understand and hits their main goals.
It’s proof of your agency’s dedication to quality, a way to deepen connections with clients, and a key driver of long-term success.
Kernwoorden: Client reporting