In this third part of our Demystifying Google Analytics 4 series, we discuss the GA4 reporting interface and how to make the GA4 UI your own. Yes, it also explains how you can replicate many of your favorite Universal Analytics (UA) reports in GA4.
With only months before Universal Analytics stops collecting data, getting to grips with GA4 is essential. So why not take advantage of our special offer to all Swydo customers for 10% off each ticket with code ‘SWYDO10’ on our 6-week GA4 Immersion course.
In the previous article in this series, we discussed how to collect data with GA4 using the different event types and how these can be marked as conversions to report performance against.
So in this article, we will dive into the GA4 reporting interface, showing you some different customization options you can use to tailor the presentation of the data you are collecting to suit your own reporting requirements.
Then in the final two articles we will discuss the following:
Part 4 – GA4 and Swydo: How to get the data you need in the place you need it
Part 5 – What’s next? Get the answers to what the future holds, what do you need to do, and when
You may also want to check out the recording of our recent Measurelabs/Swydo joint webinar exploring the most common GA4 questions marketers have.
However, one of the main benefits of the GA4 reporting interface is how highly customizable it is and that will be our focus in this article.
You can edit the overview and detail reports, as well as the reports navigation menu, and even add your own reporting collections and topics.
Important notes:
You need to be an editor or administrator to make report customizations
You can undo any report customizations you make
Everyone with access will see your customizations
Let’s do this step-by-step.
Overview and detail reports
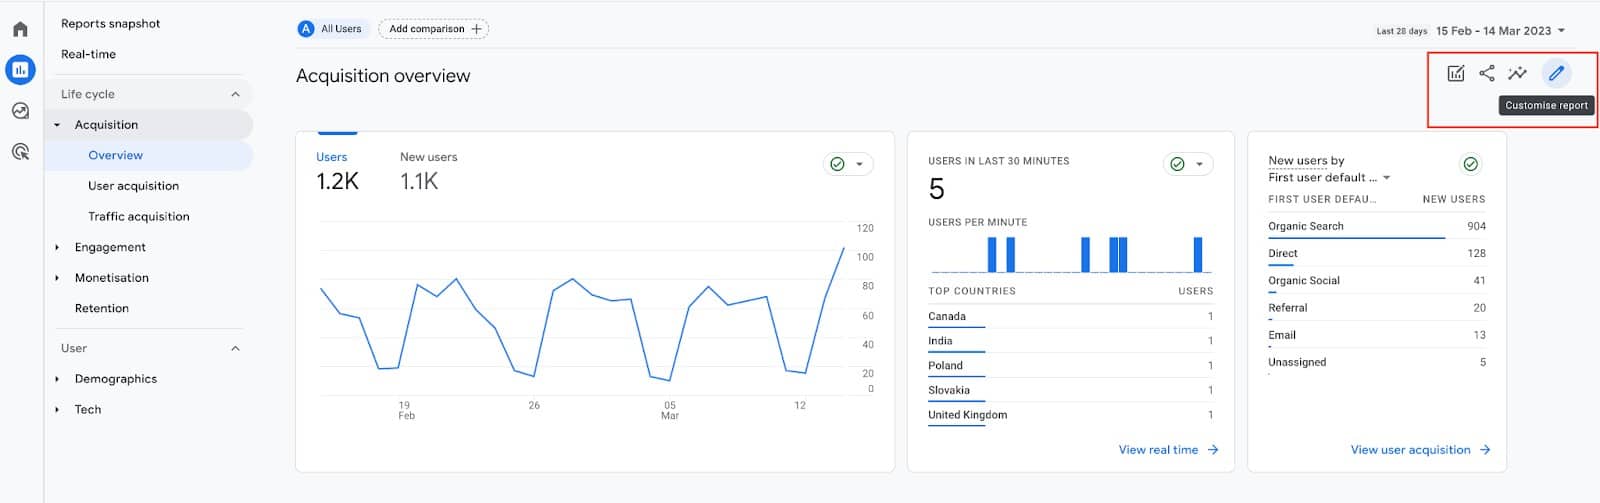
You can edit any existing report in GA4 by simply clicking on the “Customize Report” button in the top right corner (the pencil icon).
Click the pencil icon to start customizing
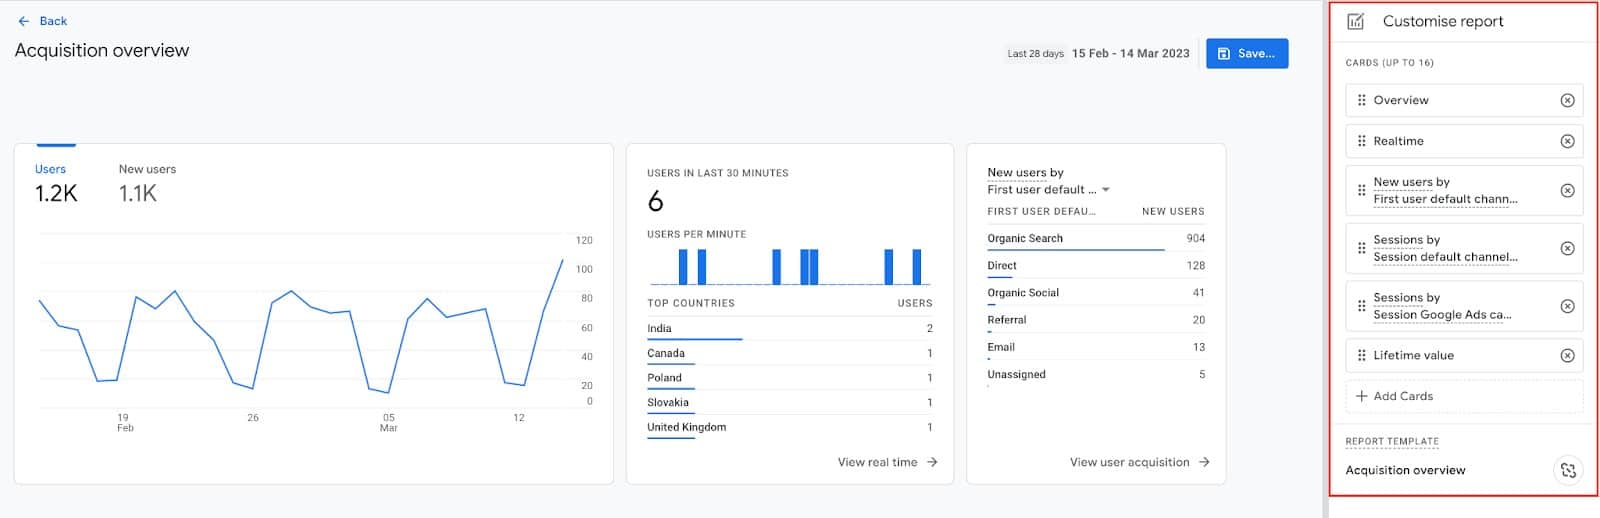
This will bring up the report editor panel on the right-hand side of the report.
Report Editor Panel on the right-hand side
Within this report editor panel, you can remove existing reporting cards (each block of data in the report), reposition them, and add new ones – up to a maximum of 16 cards per report.
The default reports are standard across all GA4 properties so they are likely to include some data that won’t be relevant to your business. In the example above for the Acquisition overview report, one of the default cards included is for Google Ads traffic. This particular website does not advertise with Google Ads so this reporting card could be removed as it will never show any data. We could also add in Conversions by Default Channel Grouping.
Once you are happy with your changes you just need to click “Save” and view your newly customized overview report.
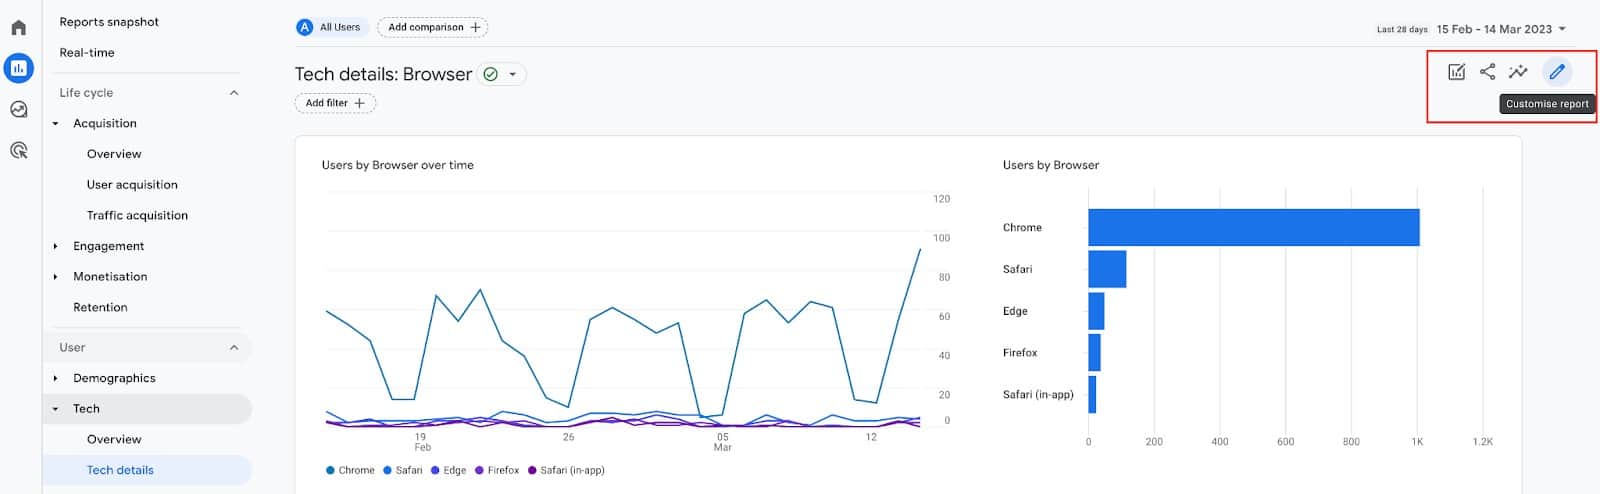
Editing detail reports is very similar so let’s take the example of the “Tech Details” page shown below. Again click the pencil icon in the top right corner.
Editing Tech Details page
This will open up the report editor panel.
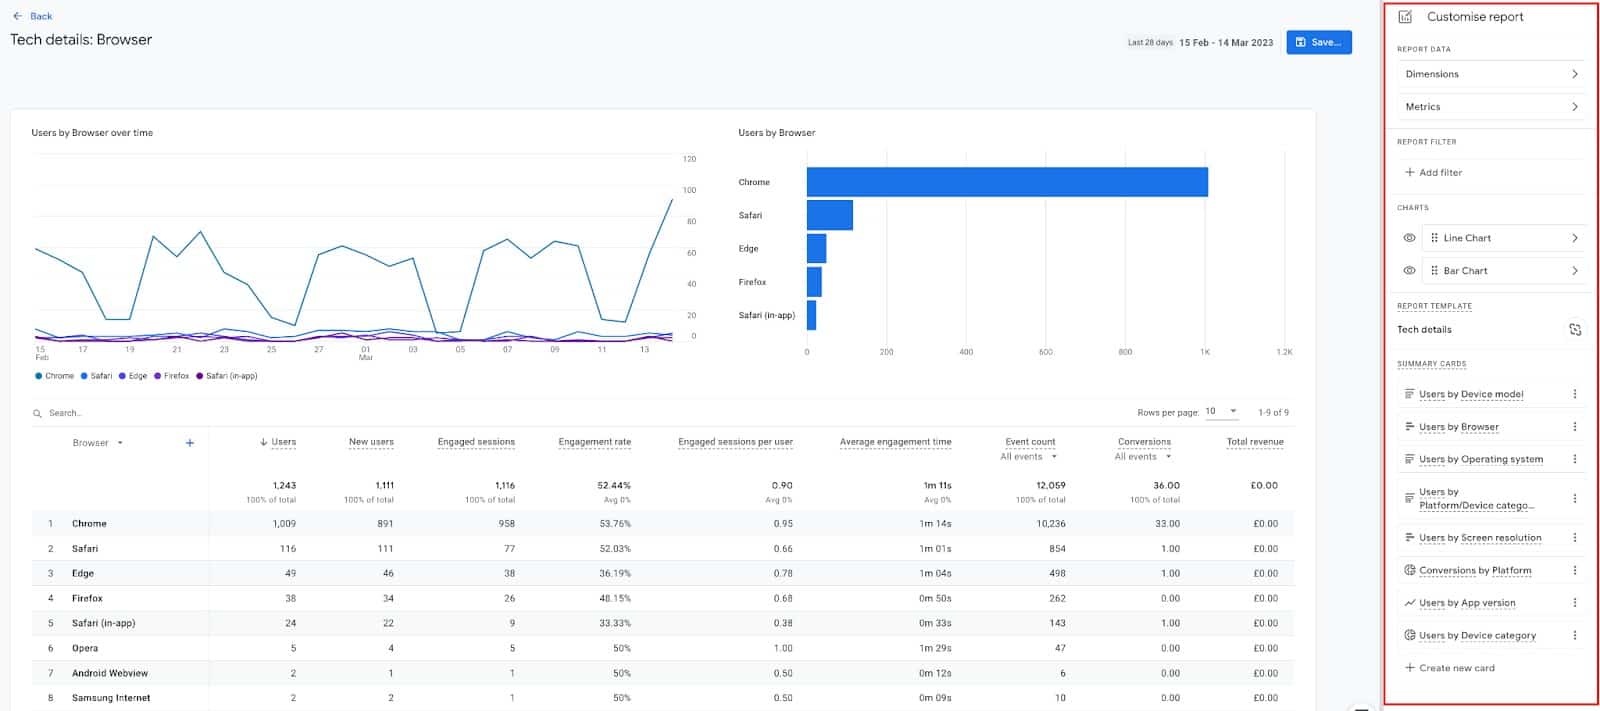
Customizing Report Editor Panel
It’s the same report editor panel that we saw with an overview report but this time we have a few more customization options.
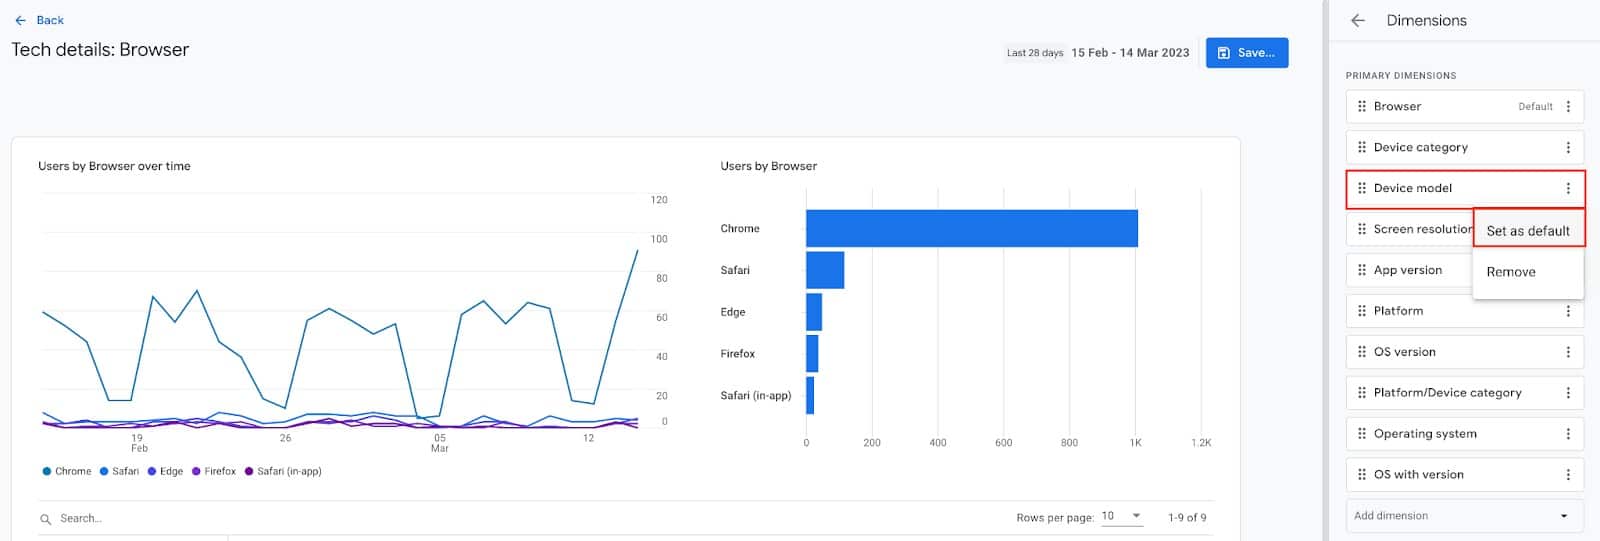
For the two charts shown on the page, we can change the chart type between bar, scatter and line. If you think this is limited, bear in mind this is not dashboard building (like you can do more comprehensively in Google Looker Studio) but simply editing some existing interface reports. You can also hide one or both of the charts and reorder them (left or right) if you wish. You can also change the dimension used in the charts by clicking on the Dimensions list and then choosing a different default dimension, as shown below.
Changing dimensions as default
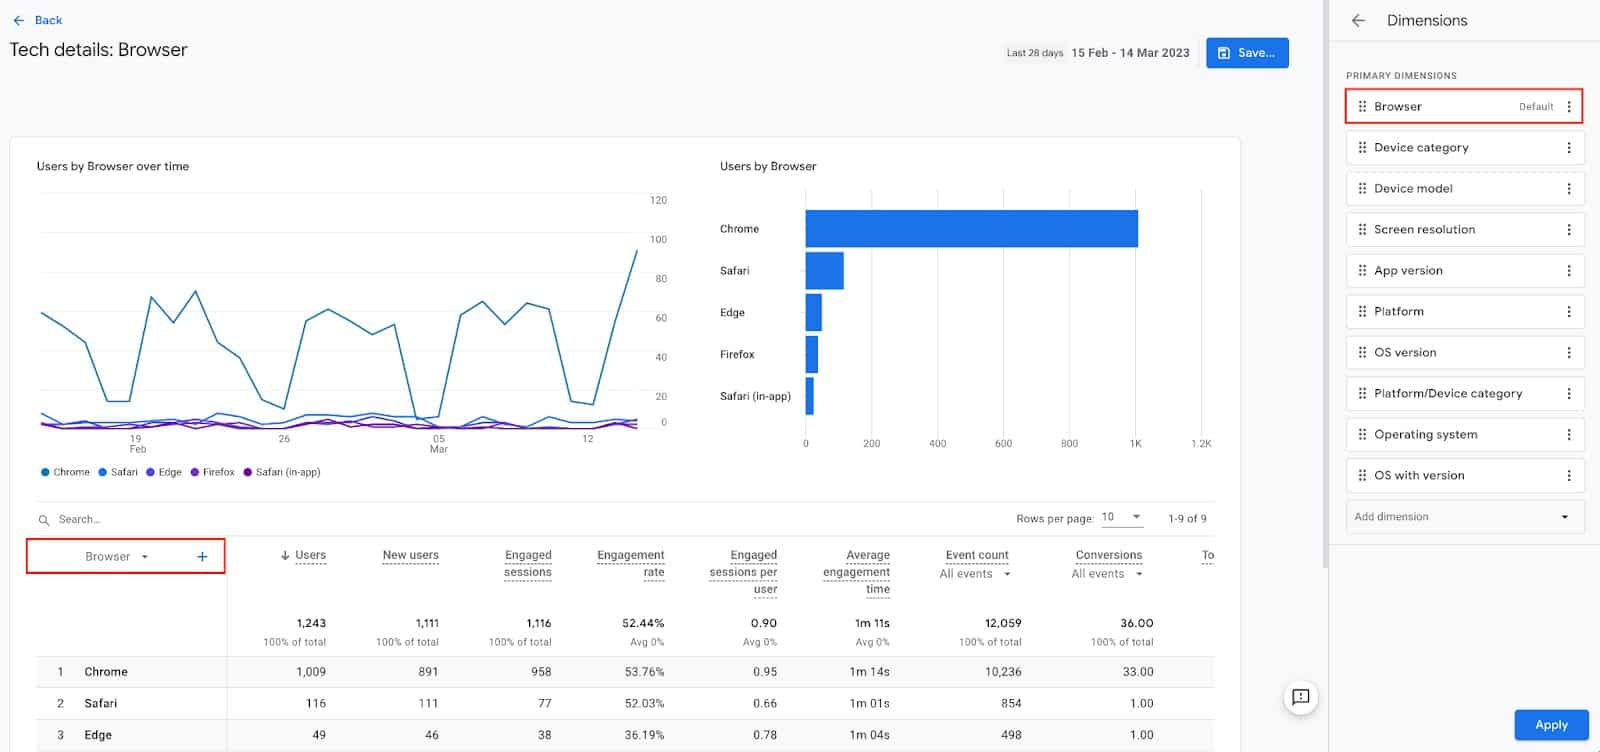
Whichever dimension is set to default in this list will also be the primary dimension in the report table.
Setting Primary Dimensions in your report
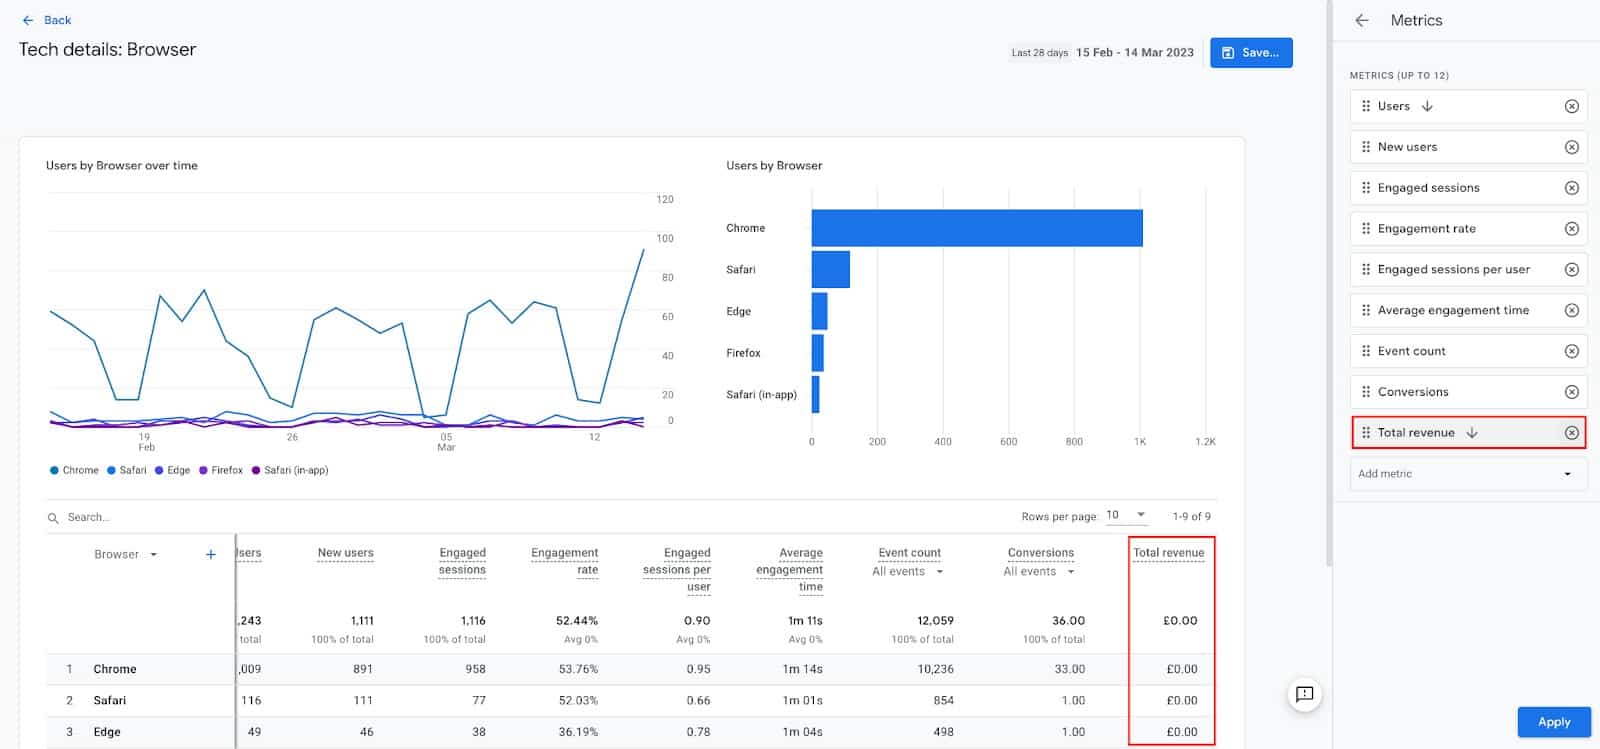
Whereas clicking into the metrics list will allow you to control which metrics are shown in this table. You can remove existing metrics, add new ones and reorder the list to suit your preference. In this example, there is no revenue being collected as this is not an E-commerce business so the “Total Revenue” metric could be removed from this report.
Removing unwanted metrics from reports
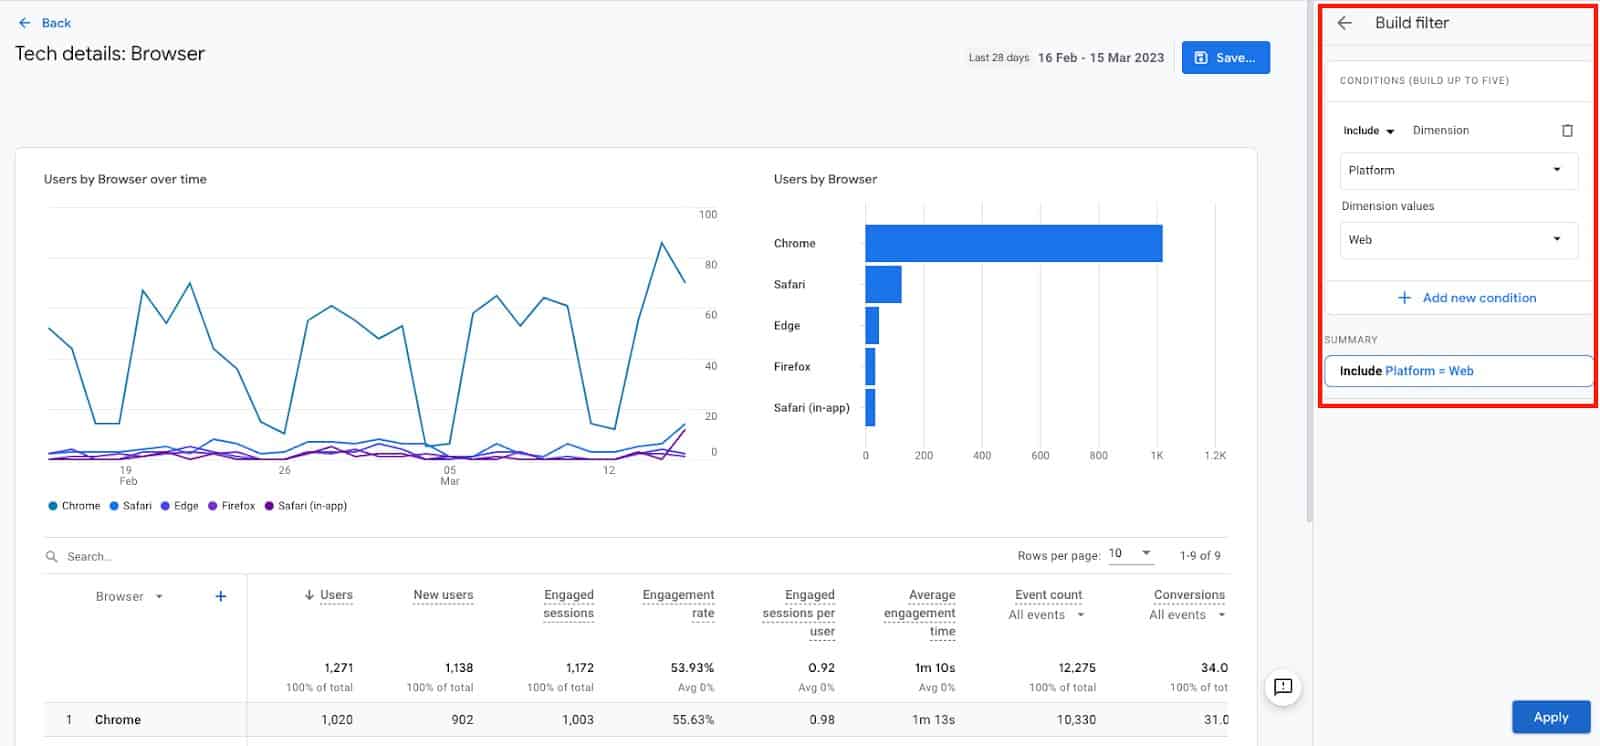
One other customization you can make to the detail reports in GA4 is to save a custom report filter to show only a subset of the overall data to users of this report. A good example would be to filter to include only web data if you are collecting both web and app data into your GA4 property (or vice versa). The screenshot below shows how you would configure this report filter only to include web data.
Reporting Filter only to include Web Data
Customize the navigation menu for the reports workspace
So far, we have shown how to edit the reports themselves, customizing the dimensions, metrics, and charts shown to users of the reports. Now we will zoom out a level and look at customizing the navigation menu for the reports workspace.
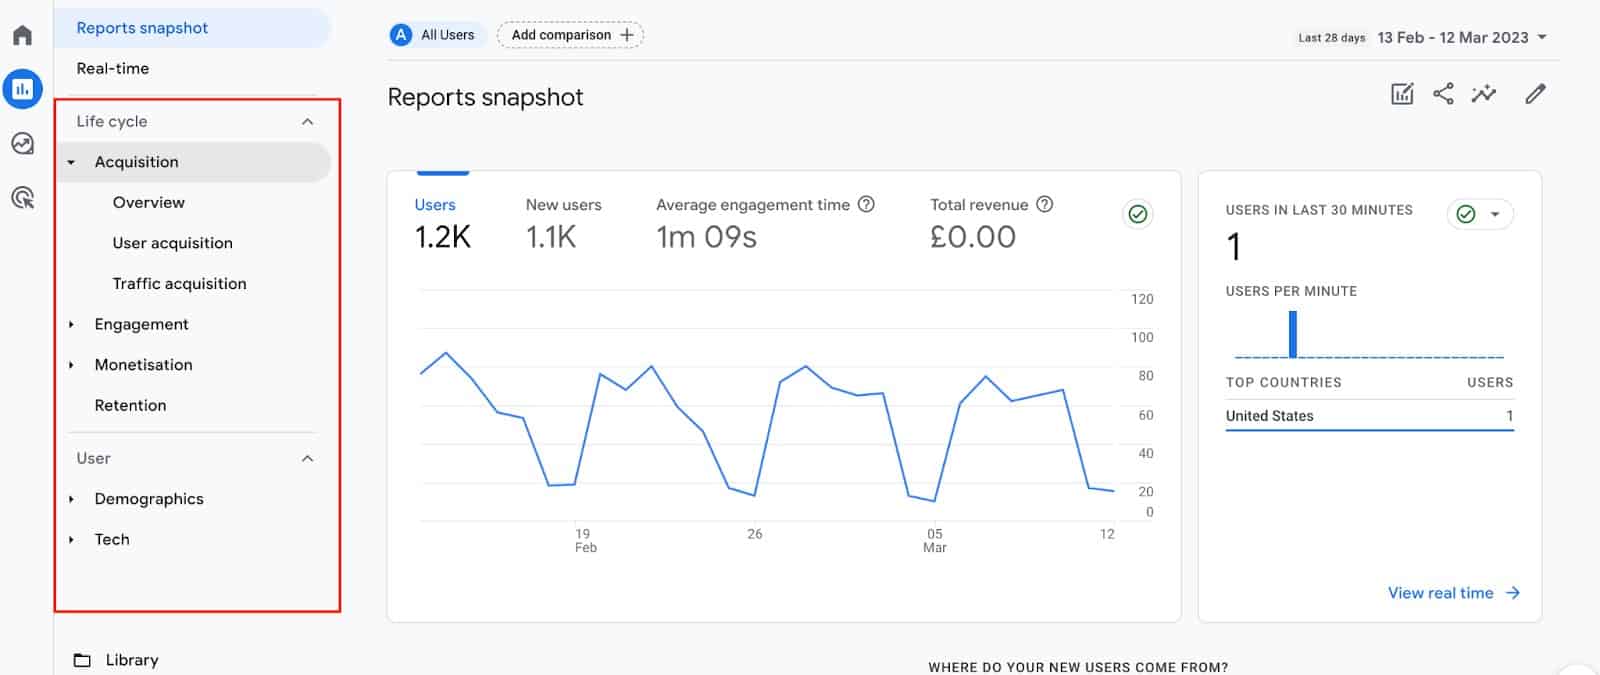
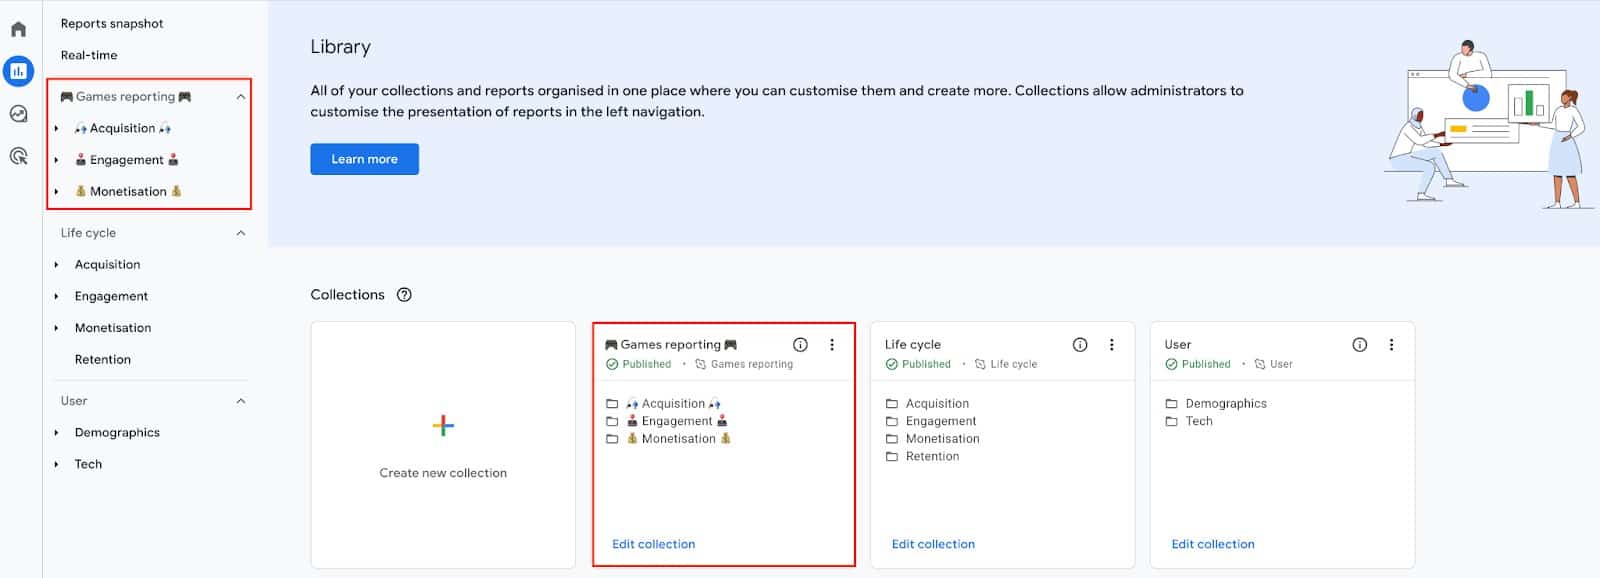
By default, we see the menu below when we click into the reports workspace.
Your reporting workspace
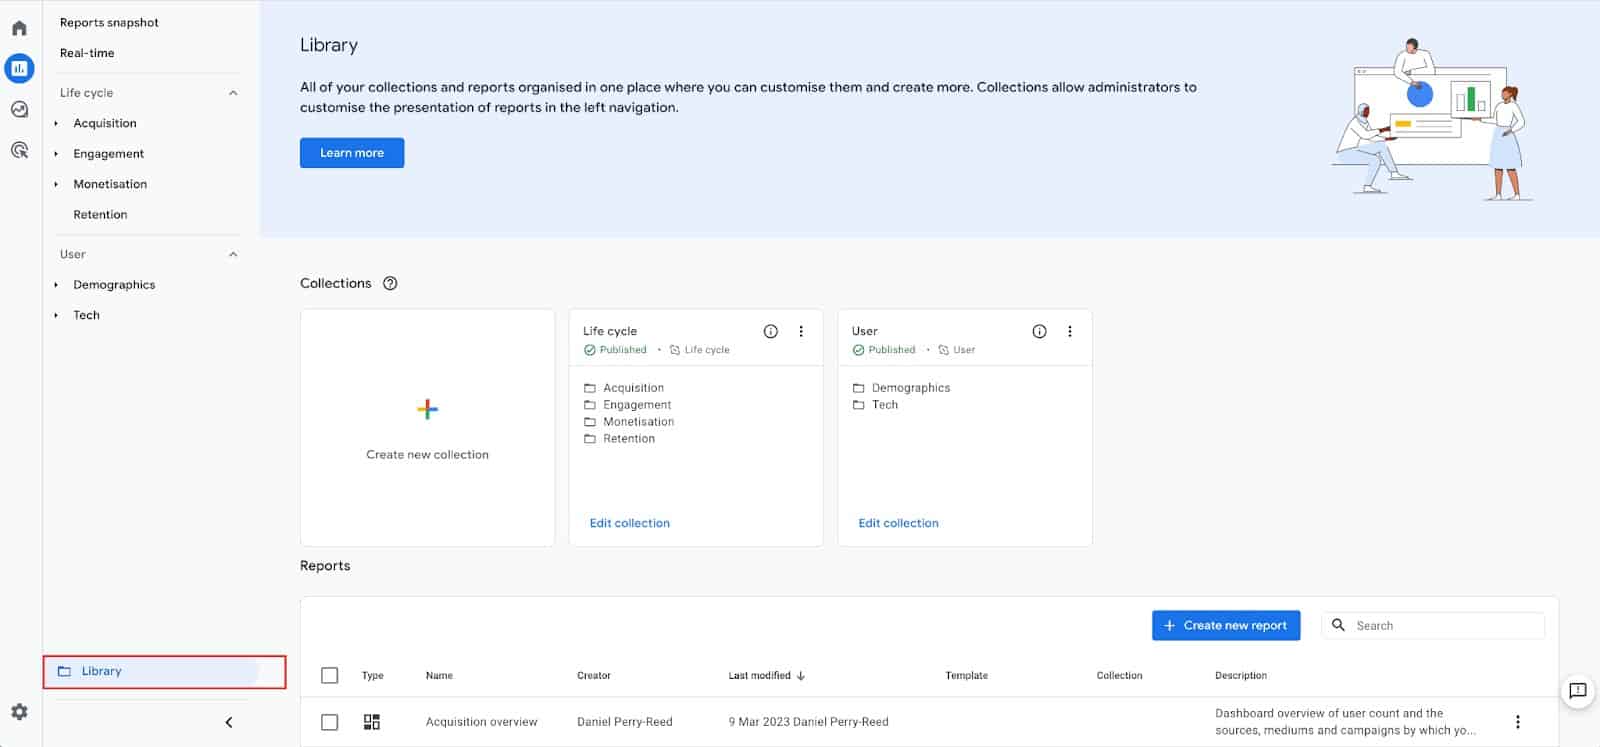
We have two default reports, “Collections”: Life cycle and User, and within each of these, we have “Topics” (e.g., Acquisition) and Reports (e.g., Traffic acquisition). We can edit the existing Collections, Topics, and Reports included by default as well as add new ones by clicking into the Library (link at the bottom of the menu).
Editing existing collections in the Library
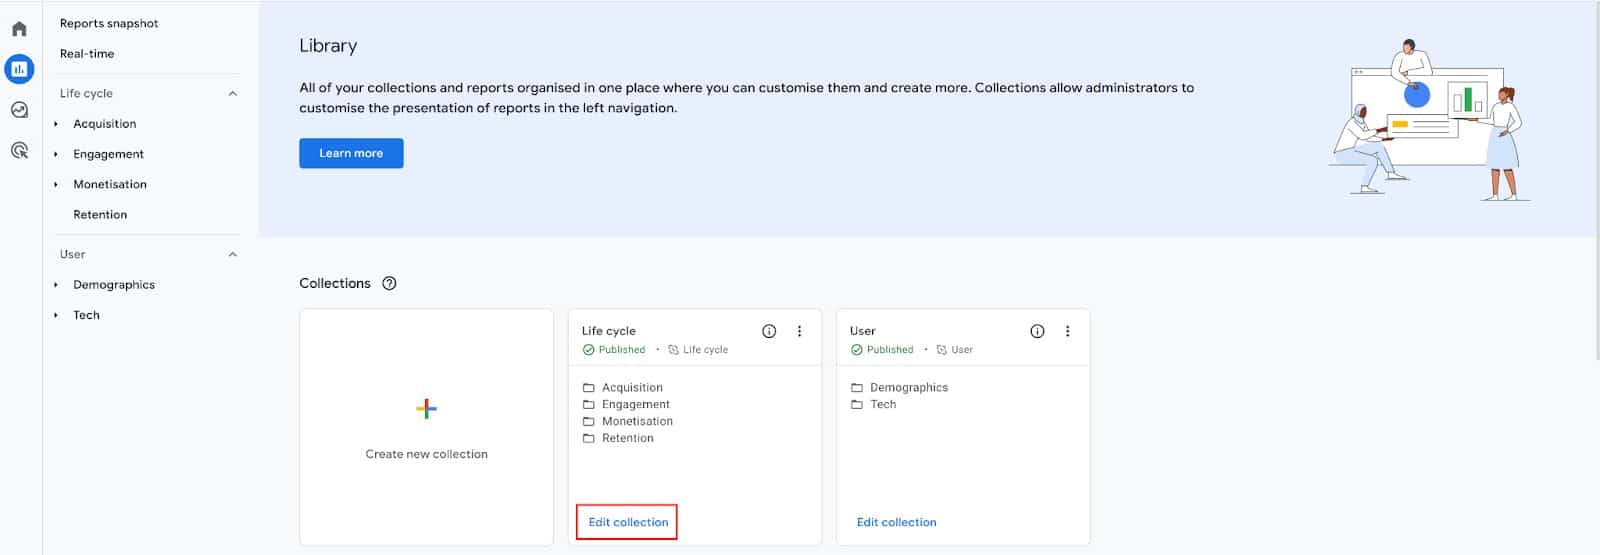
If we are not collecting any revenue data, then we might want to remove the Monetisation “Topic” from the Life cycle “Collection”. To do this, we would click on the blue “Edit Collection” link at the bottom of the Life cycle “Collection” card.
Editing existing collections in the Library
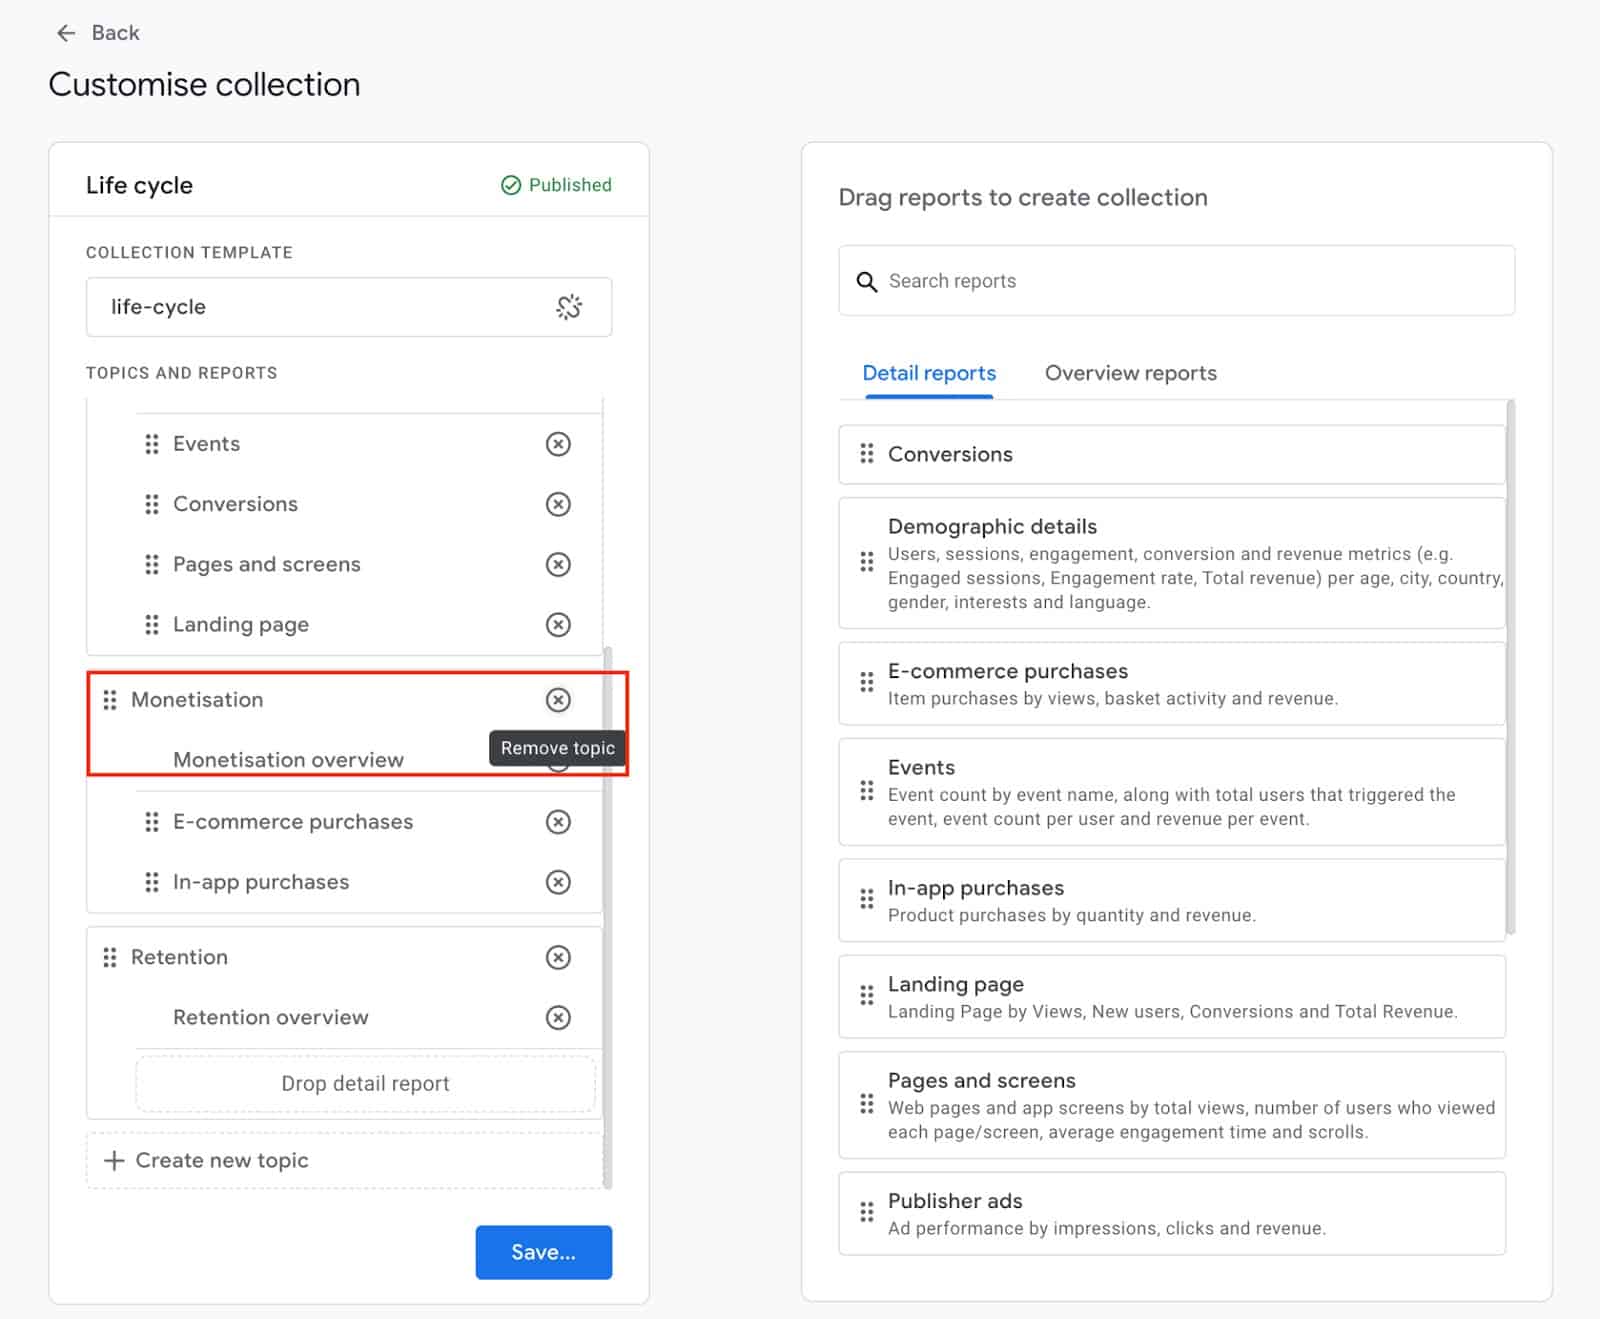
Then scroll down to find the Monetisation “Topic” and click the “x” icon to “Remove Topic”.
Customizing collections
This will then remove that Topic from the menu for all users of this GA4 property.
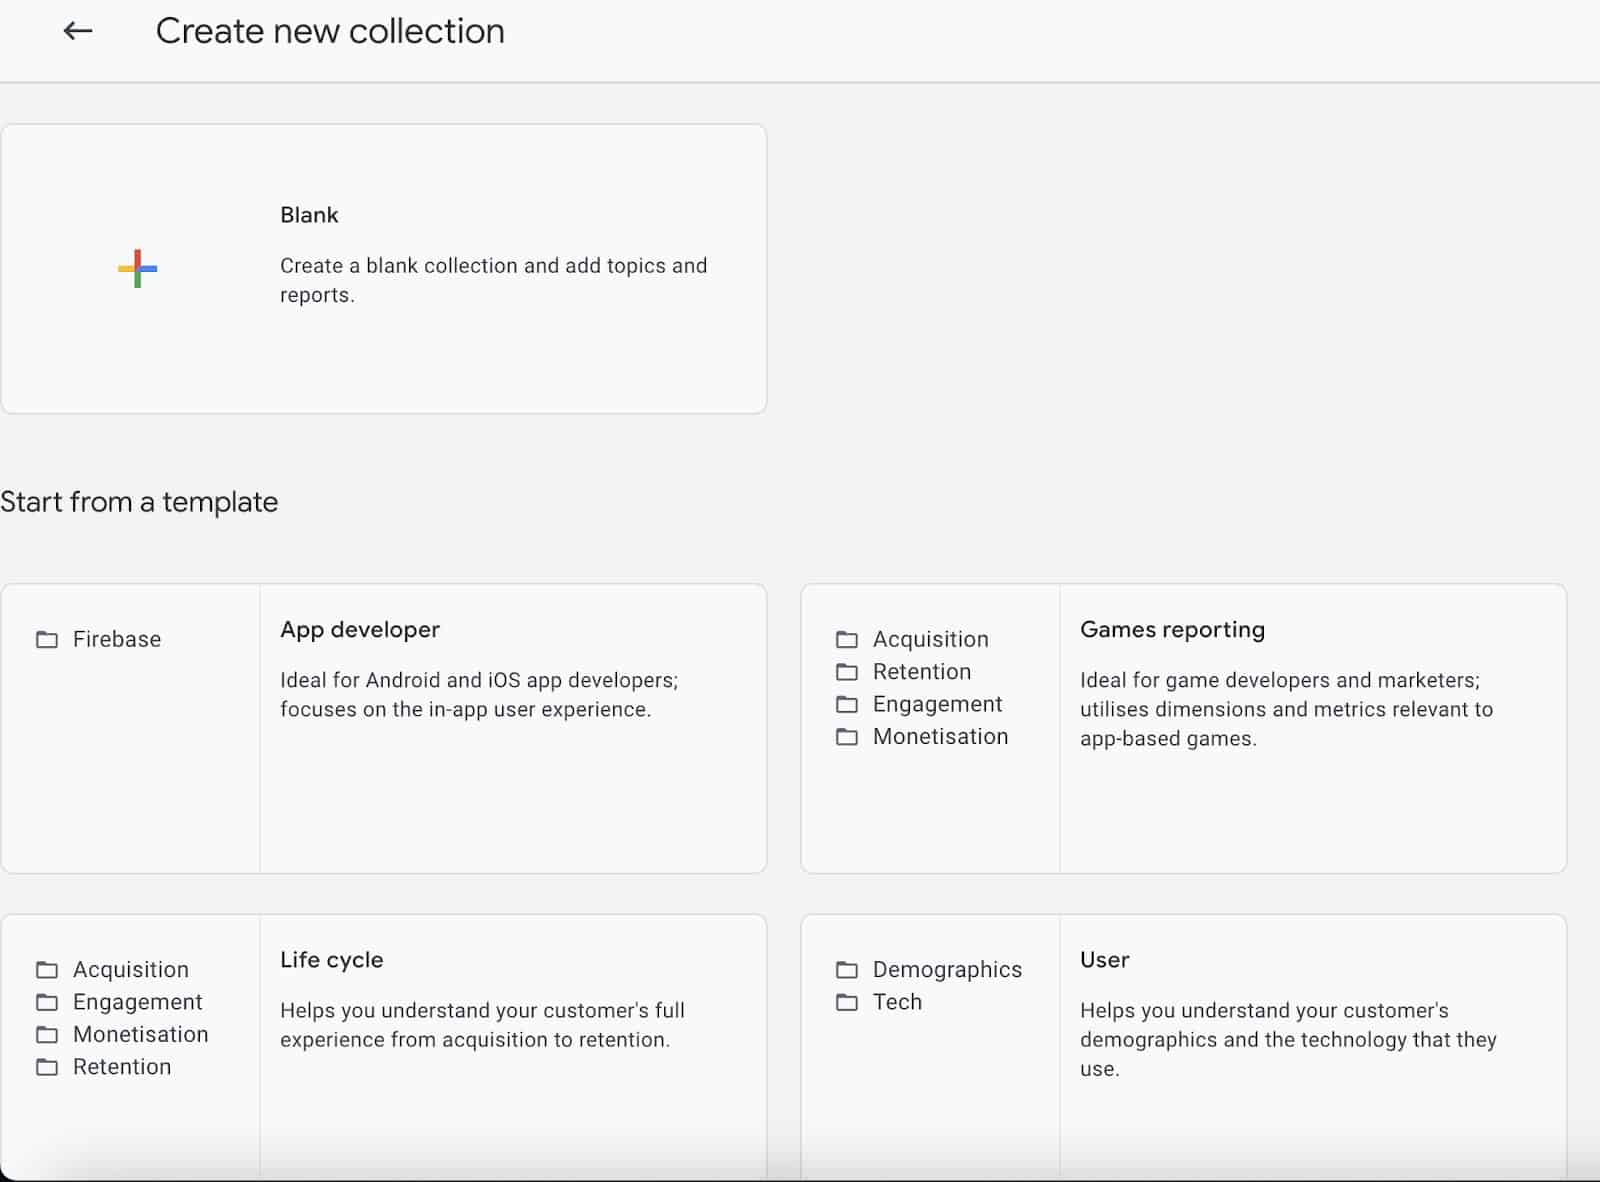
You can also build new Collections entirely from scratch if you wish, or start them from a template.
Creating reports from templates
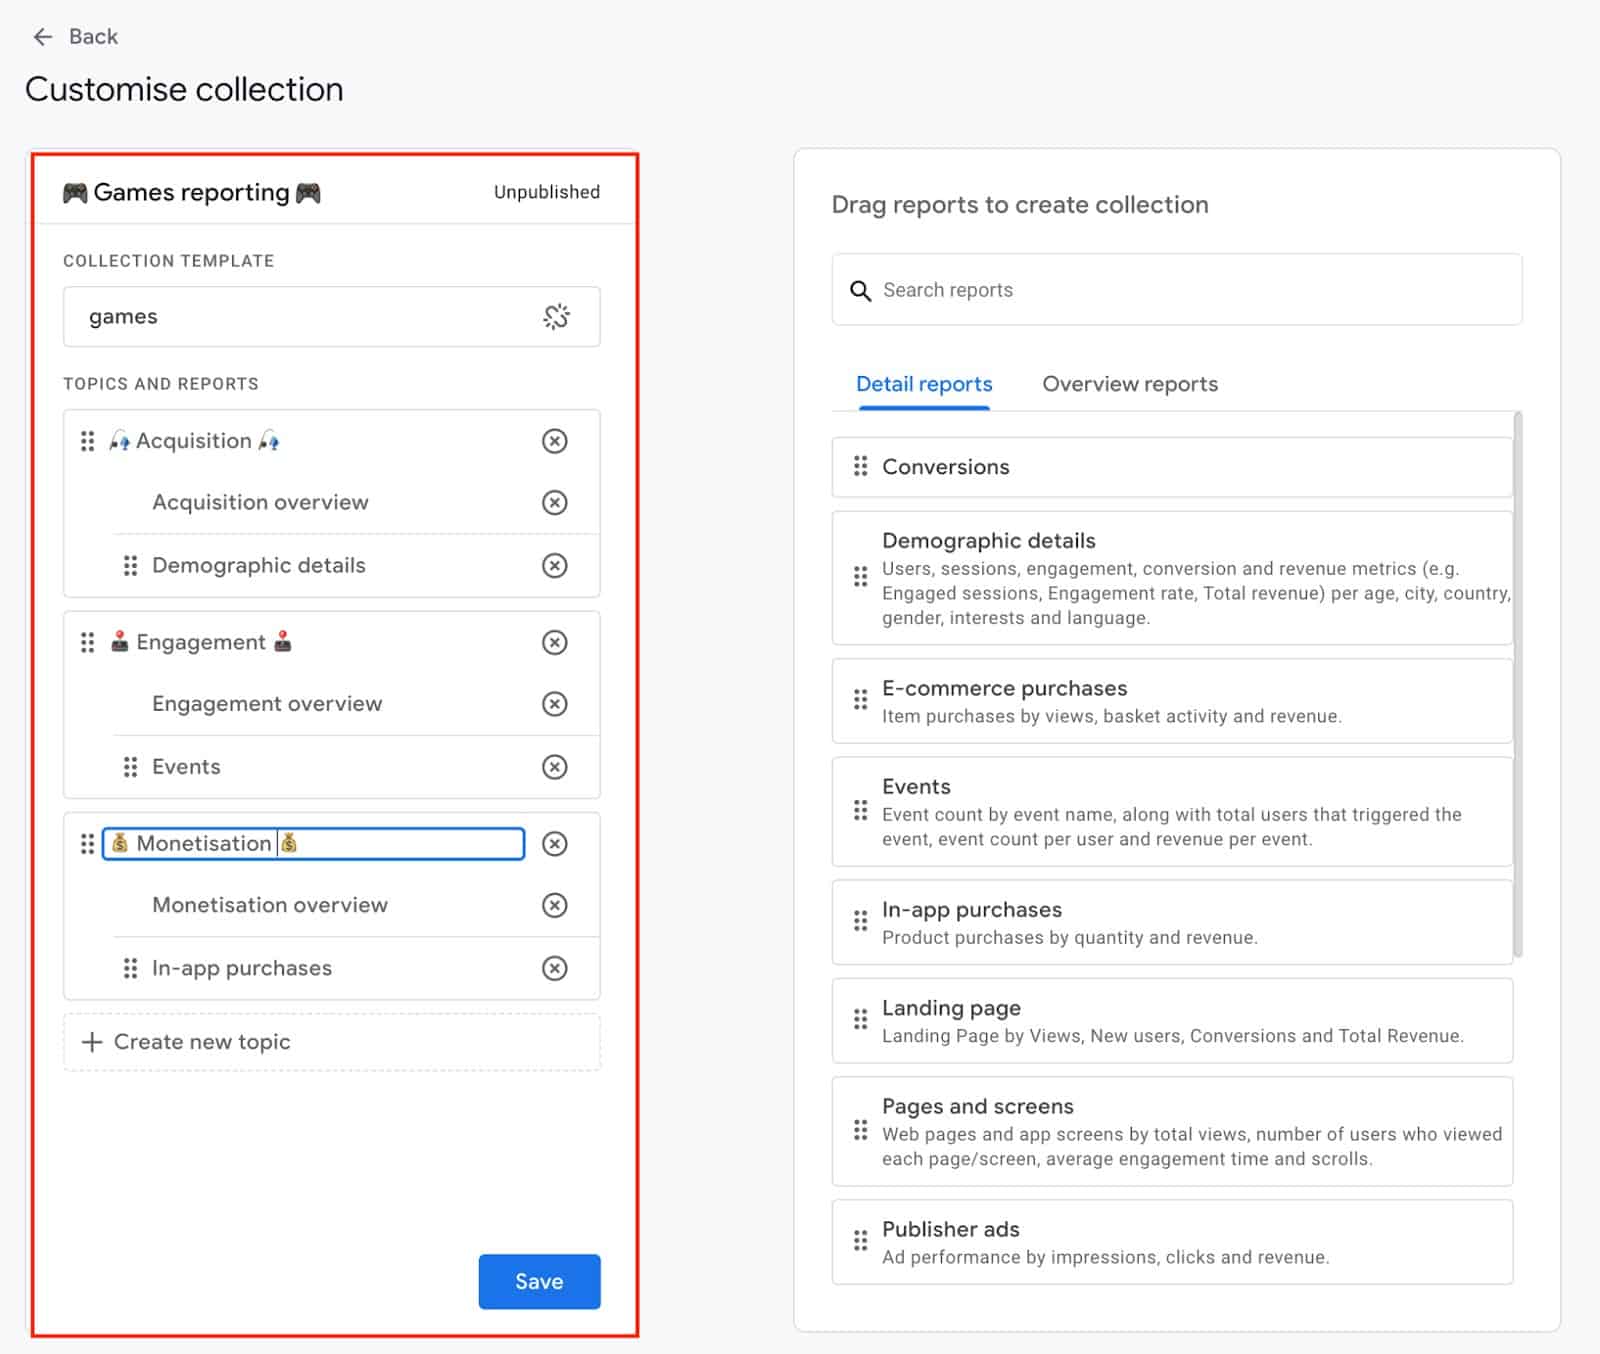
You can even use emojis in your new Collection and Topic names if you’re feeling brave! 🤯
Naming your reports
Replicating your favorite UA reports in GA4
As we’ve shown in this article, the reporting interface in GA4, which is useful even by default, can be fine-tuned through the different customization options to present the data you’re collecting in GA4 in a way that suits you and your fellow report users. We hear a lot of people say the GA4 interface is lacking compared to Universal Analytics but in reality, much of the same reporting data is there; it’s just a simplified User Interface. You can replicate many of your favorite reports by simply changing the primary dimension in any of the detail reports in GA4.
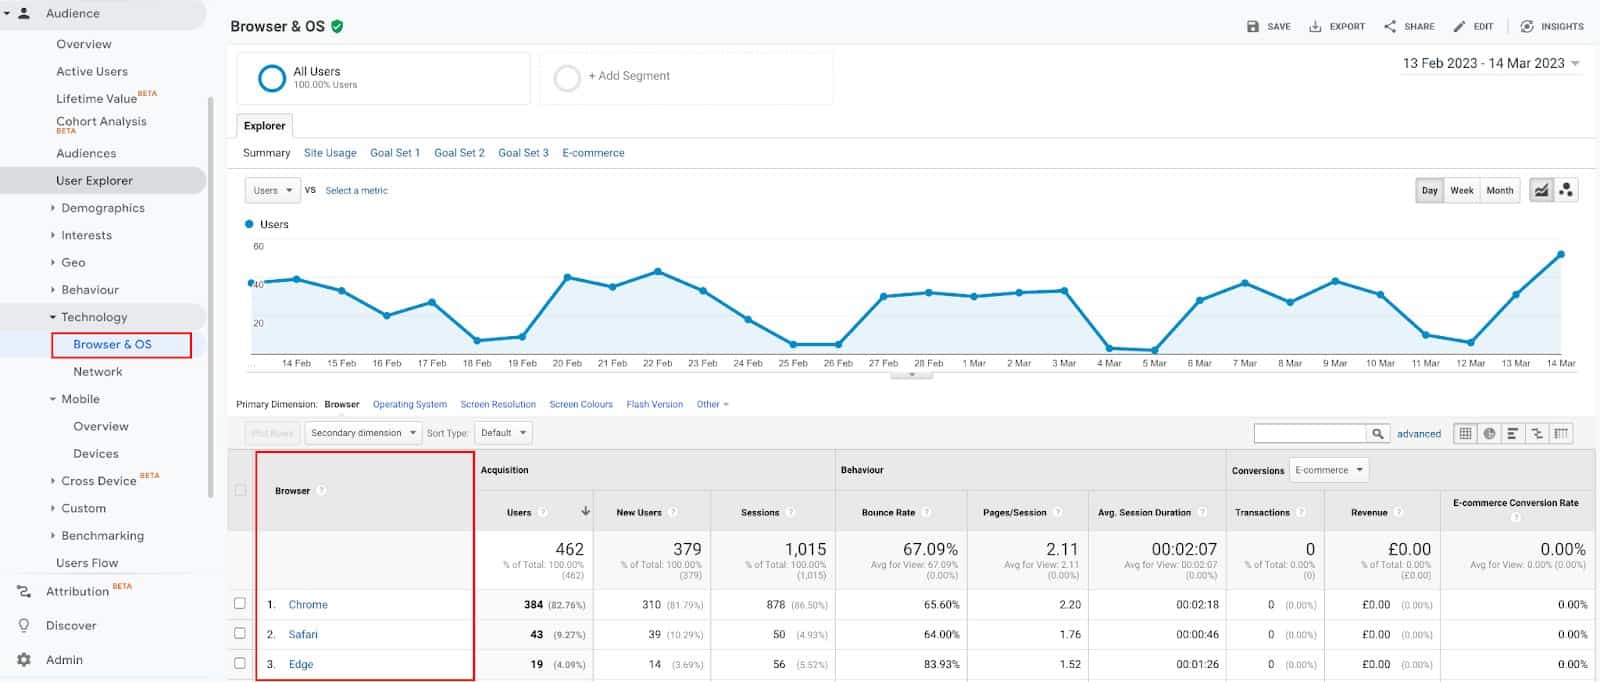
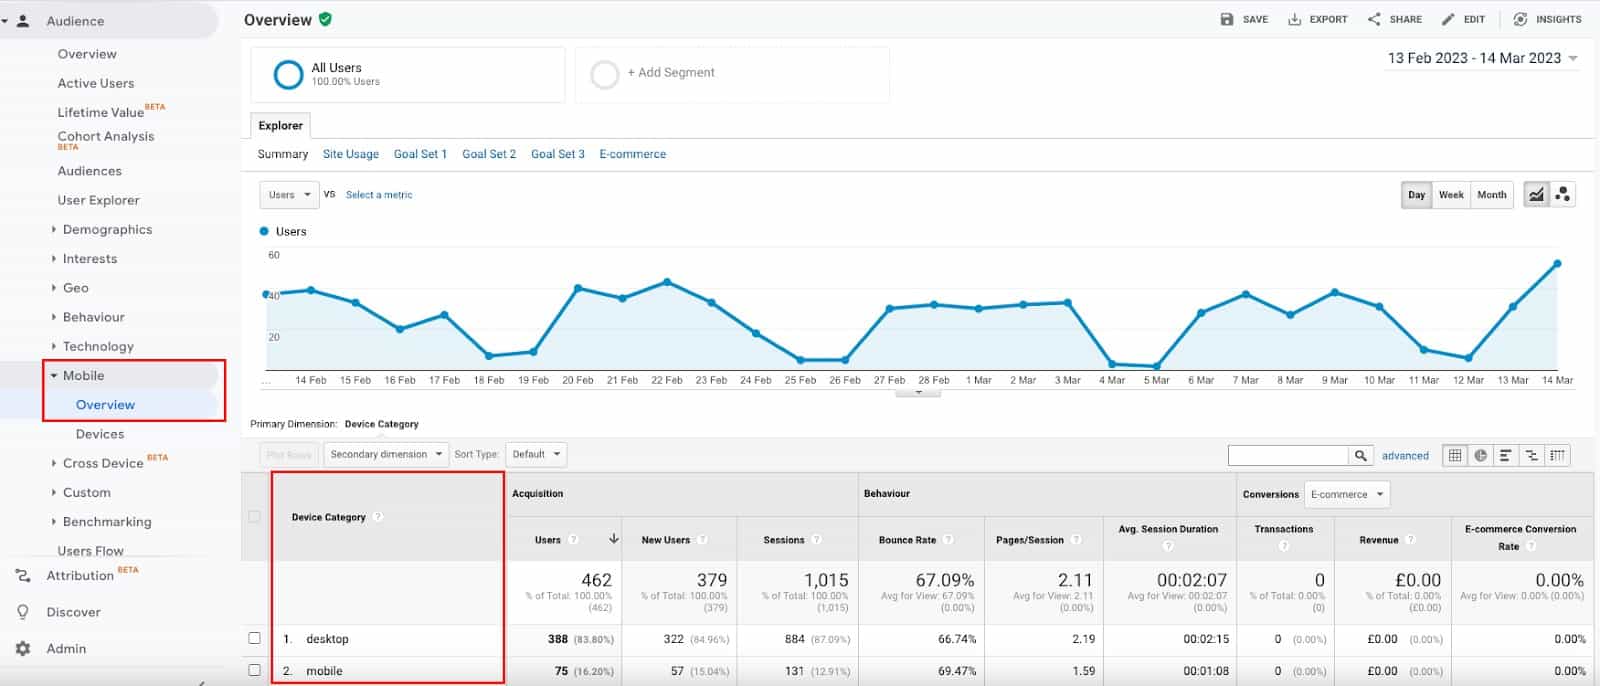
For example, in Universal Analytics, there are separate reports for Browser & OS and Device Categories, as shown below.
UA to GA4
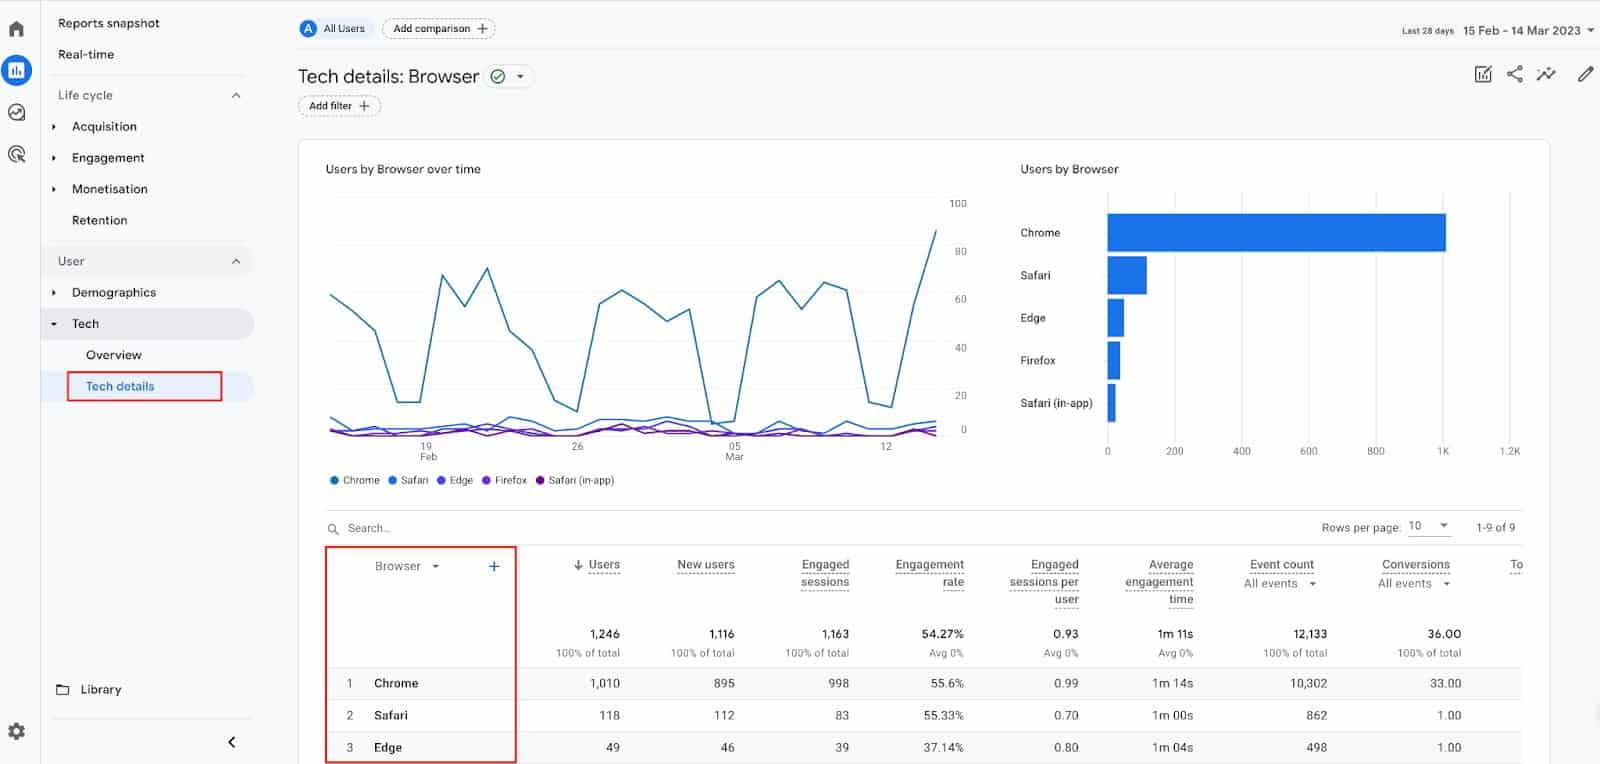
Whereas GA4 simplifies this by containing the same combined data in a single report, “Tech Details”. This defaults to the primary dimension of “Browser”:
UA to GA4
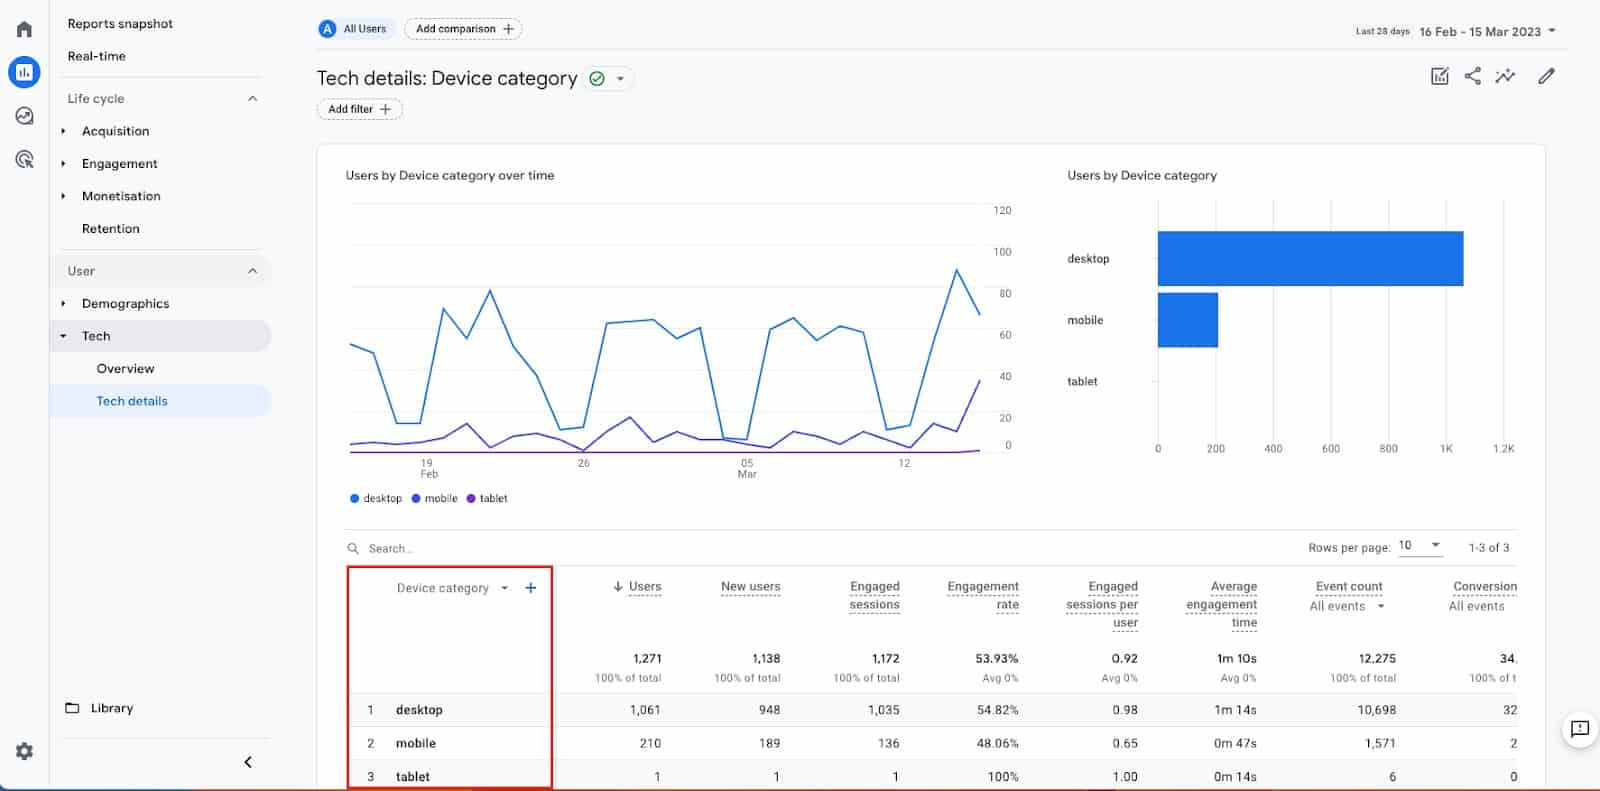
You can then change with the primary dimension drop-down to show your device categories without needing to navigate to a different report:
And of course, as we’ve shown, you can then customize these detail reports to present the dimensions and metrics that are most relevant to you.
We hope this guide helps you tailor your own GA4 reports to make them more meaningful for your business, which in turn will save you time finding the data you need to act on. In the next article, we will move on to looking at GA4 data in Swydo.
Dara is the CEO of Measurelab. He has specialized in Google Analytics for the last 15 years, consulting clients, running training courses, and speaking at industry events. His mission now is to make Measurelab the world’s favorite digital analytics consultancy and the all-time greatest place to work (for analytics types).
Love or hate it – if you’re a digital marketer, you cannot ignore it. With the Google Analytics 4 migration clock ticking fast, we have UK’s leading digital marketing agency MD and brightonSEO’s Measurefest speaker, Farhad Divecha, shedding light on the must-have GA4 reports for all SEOs. Here’s an updated slide deck to go along with your reading.
Tell us about your topic, 10 must-have GA4 reports for all SEOs, and why you chose it?
I’m very acutely aware that everybody’s being pushed to move to GA4, and I’m acutely aware that many people are unhappy about that. They find it very, very different and fairly challenging. I have also seen much information and misinformation about GA4 and its workings. I know it’s quite a powerful tool, but you’ve got to understand the system and make the most of it. At BrightonSEO, I will specifically uncover GA4 reports for SEO, show how to set them up via GA4 + GTM, explain insights to be gained from those reports, and discuss actions that SEOs can take from those insights.
How’s your experience with GA4 been?
Personally, I really like it. I think it’s way more powerful than Universal Analytics. I say this because we have been using Facebook Pixel for much longer than GA4, before it even existed. Facebook Pixel has so much flexibility in what you can measure and how you track conversions and important actions on your site —moving to a similar event-based model with much more ability to track important parameters and get flexible reporting is a step up.
One piece of SEO advice for folks learning the ropes?
The most important thing any SEO can do is look at the data and start realizing where they’re already — getting organic placement rankings and traffic — compare that to what they want to achieve and understand why that gap exists.
Look at the traffic you get from certain non-branded keywords and understand what stops you from getting that traffic on the keywords you want to rank for. Usually, that’s a very good starting point, so understanding what’s working in some ways is also understanding what is not working. It lets you figure out how to reach Point B from Point A.
What presentations are you most interested in attending/speakers you are most interested to hear and why?
I remember looking at the list and thinking there were some really interesting ones — topical conversations about equality, embracing diversity, and how people can put their genuine, authentic sleeves forward. There are a couple of AI sessions that I’m looking forward to. And, of course, the SEO topics because it’s fascinating to see how deep some people get into it and try to reverse engineer the algorithm.
What has been your core mantra in driving your agency forward?
I think there are two things. It’s incredibly good client support and a laser-sharp focus on growing internationally at scale. We set ourselves up for some high client support targets within the company that we insist everybody meets. So when a client asks us for anything, we have to respond within four hours, and if it takes a little bit more time, we have to start working on the solution within 12 hours. We aim to deliver most solutions within 48 hours. Where they want tweaks, where they want things changed, where they want an opinion, where they want advice, that sort of stuff is resolved very quickly. That’s why our clients stay with us for as much as 10 to 12 years. The agency average in the UK is a bit more than one year. Yeah, so it’s a massive difference for us. We believe in always taking a step back, looking at the bigger picture, and delivering on the impact.
What are the top 5 tools or apps you use daily and why?
Apart from the obvious platforms (Office 365, Meta Ads, Google Ads, DV360, LinkedIn Ads & TikTok Ads), I personally spend time daily using:
Google Analytics – To track traffic & online actions for us & our clients
Adobe cloud – For all things creative
Swydo – Reviewing daily activity reports for my team
SharpSpring – Our CRM and marketing automation tool
Farhad is MD of digital agency AccuraCast. He advises corporations on their analytics and data strategy, and is passionate about using technology to improve performance marketing.
UK’s leading digital marketing agency trusts Swydo with their client reporting. You can too! Start your journey here.
In the second part of our Demystifying Google Analytics 4 series, we are talking about GA4 events. With only months left now before Universal Analytics stops collecting data, getting to grips with GA4 is essential. So why not take advantage of our special offer to all Swydo customers for 50% off each ticket with code ‘SWYDO50’ on our 6-week GA4 Immersion course.
In the first article of this series, we mentioned that GA4 uses a much improved event-based data collection model and features both automatic event tracking (enhanced measurement for web) and event editing and creation (customized events).
In this article, we will dive deeper into these concepts, covering the new data model, comparing it to Universal Analytics (UA), and explaining the different event types in GA4 with examples. We will also cover conversions in GA4, again comparing to UA for reference.
What is the GA4 data model and why is it all built on events? This will be a core part of the series. We will explain the different types of events, with plenty of examples. And how conversions fit in (with comparisons against UA).
Part 4 – GA4 and Swydo: How to get the data you need in the place you need it
Part 5 – What next? What the future holds, what do you need to do, and when
We’ve also recorded a joint Measurelab and Swydo webinar exploring marketers’ most common GA4 questions.
Let’s do this together!
Data Collection Model
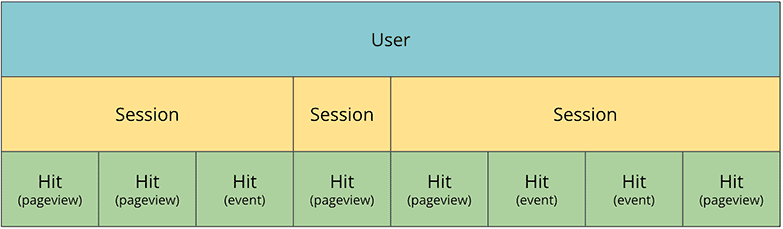
Starting with the data model, Universal Analytics data is mainly collected using pageview hits and event hits. So pageviews and events are tracked separately in UA.
UA DATA MODEL
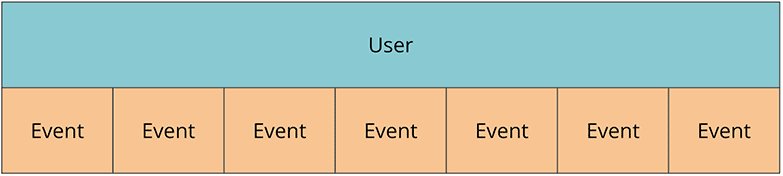
Whereas GA4 collects all data via events. Therefore, Universal Analytics property hit types translate to events in a GA4 property.
GA4 data model
Since GA4 captures all data in events, even metrics like Sessions and Pageviews are tracked using events, the session_start and page_view events to be specific. This makes life easier as it means all data is available in all reports, unlike Universal Analytics.
There are several different ways of creating events that need to be considered when implementing GA4 for your websites and apps. To be clear, these are methods of event creation and the resulting events will all be reported in the same way, regardless of the method used. For simplicity, we will refer to these different methods of event creation as event types.
The different event types in GA4 can broadly be categorised into automatically collected, manually created, and customised events.
Automatically collected events
Automatically collected events are collected without additional implementation once you have a GA4 tag on your website or the GA for Firebase SDK in your app. These events cannot be disabled. Some examples of these events are:
first_visit
session_start
user_engagement
in_app_purchase
It’s worth noting that some automatically collected events are specific to web, Android and/or iOS Data Streams.
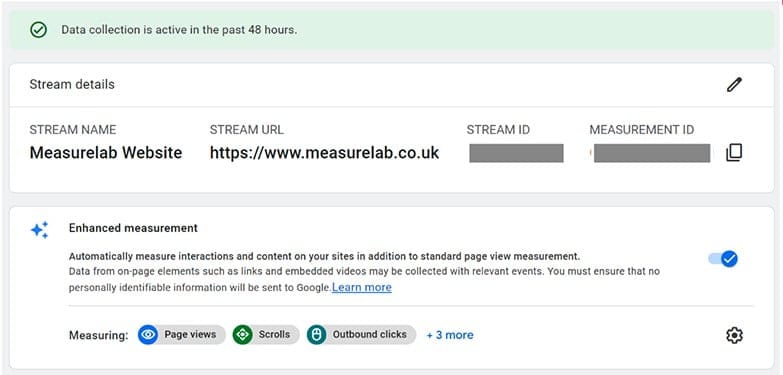
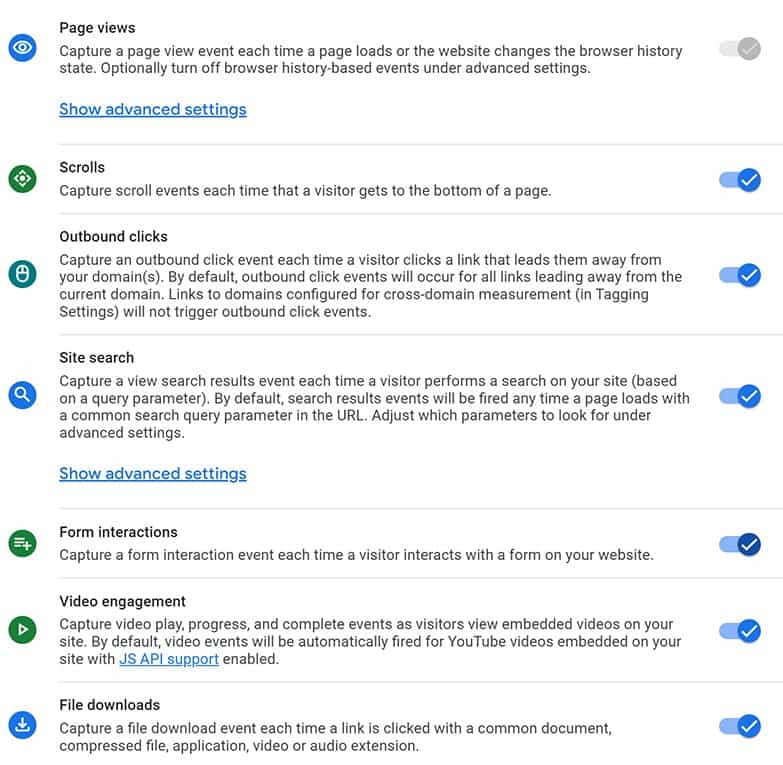
For websites, enhanced measurement events are collected from websites automatically when enhanced measurement is enabled within the interface. These events can be enabled and disabled and as mentioned above they are only available in web data streams. You can see which Enhanced Measurement events are enabled under Admin > Data Streams, then select a Web Data Stream.
You can also disable each one inside this settings panel, with the exception of the page_view event which is mandatory.
You should always test each enhanced measurement event you are using on your own website. Like any standardised implementation, it assumes the interaction being tracked works in a typical way and this is often not the case.
Manually created events
This event type will require some implementation via Google Tag Manager (GTM) or the Google tag (gtag.js) and will therefore need some coding and/or tagging expertise. There is a list of recommended events to use when implementing them, which unlock existing and future reporting capabilities.
A good example is for e-commerce event tracking as there is currently no Enhanced E-commerce in GA4. If you want to see transactions and revenue in the GA4 reports, you will have to use the exact event name and event parameter naming convention for the purchase event. Otherwise, the conversions and revenue metrics will not be populated in the data, although you will still be able to report on the count of events as you would expect.
Customised events
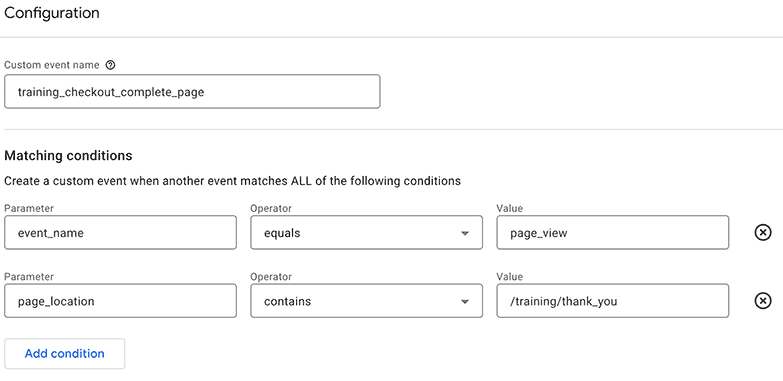
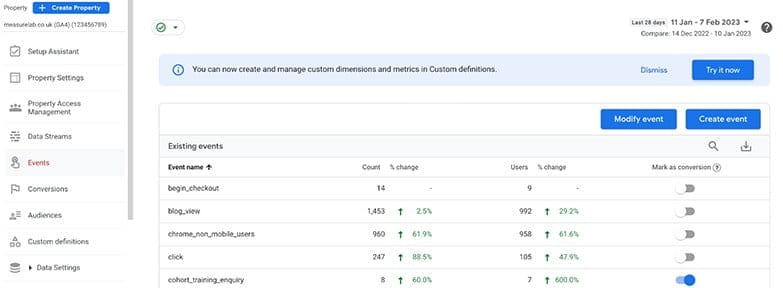
Customised events is the generic name given when events are created within the GA4 interface. You can access all of the existing (and add new) customised events by navigating to Admin and then in the Property column, click Events. Then to create a new event, click Create event.
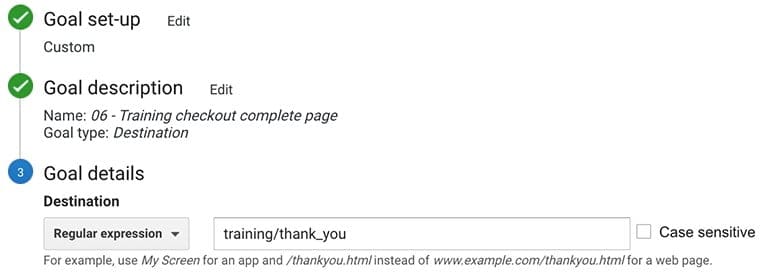
To give an example, let’s say we want to create an event that will trigger when a specific page is viewed, so in this case the page /training/thank_you. To do this we need to create a new event that triggers on the existing pageview event but only when the page location parameter for that event contains /training/thank_you. We would configure this as shown below.
A big benefit of customised events is that they can be added and removed at any time, without needing to change or update the implementation on the apps or websites. This is especially useful for apps where any tagging changes require a new app version to be published to the app/play store.
Note: You can create up to 50 customised events at any one time per data stream.
For even further detail on the different event types, you can read our GA4 event types guide or listen to us talk through these on an episode of our podcast The Measure Pod.
Conversions
In GA4, conversions are events. Unlike goals in Universal Analytics, conversions in GA4 are simply existing events that have been marked as a conversion. Any event (regardless of which method was used to create it) can be marked as a conversion in the GA4 interface.
In the previous section we created a customised event to track when the example page /training/thank_you is viewed.
In Universal Analytics we would track this using a destination URL goal as shown below.
In GA4 we just need to mark the event we created earlier (training_checkout_complete_page) as a conversion, as shown below.
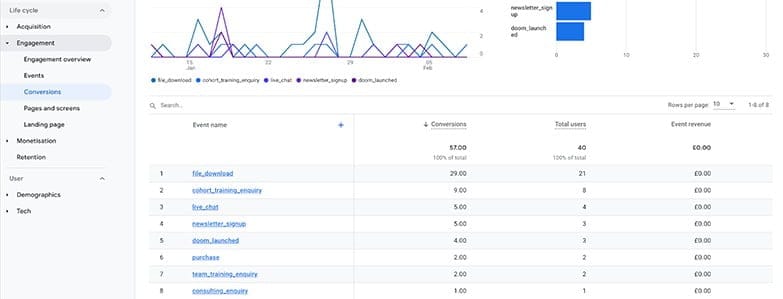
You can then view the performance of all your conversions in the dedicated Conversions report in GA4, as shown below.
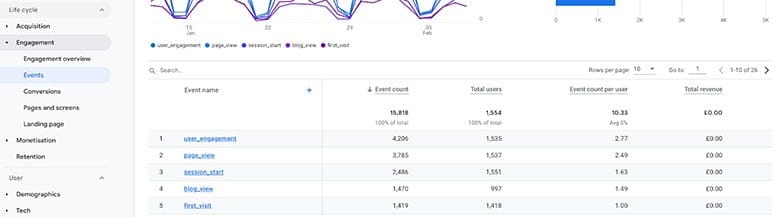
Remember that conversions are simply events though, so you will also see these events that you have marked as conversions in the main Events report, alongside events not marked as conversions.
And as mentioned earlier in this article, all events are reported in the same way in the interface regardless of the method used to collect them.
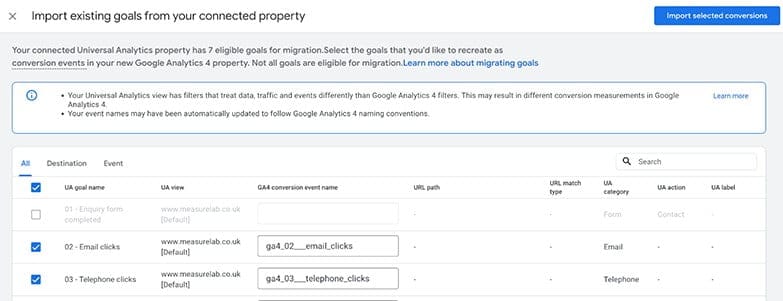
To help customers who need to migrate existing Universal Analytics goals over to GA4, recreating them as conversion events, Google provides this handy [UA→GA4] Goals migration tool. This allows you to quickly recreate eligible goals from your connected Universal Analytics property as conversion events in your GA4 property.
This can be a useful tool but our recommendation is to take this opportunity to review the data you have been collecting in Universal and consider if you need to recreate all of this in GA4. If you need help reviewing your measurement requirements and ensuring you get the most out of GA4 then Measurelab can help. And with only months left now before Universal Analytics stops collecting data, getting to grips with GA4 is essential. So why not take advantage of our special offer to all Swydo customers for 50% off each ticket with code ‘SWYDO50’ on our 6-week GA4 Immersion course.
In the next article in this series, we will take you through how to use the different reports available in GA4, and how to customize them to suit your business requirements.
Dara is the CEO of Measurelab. He has specialized in Google Analytics for the last 15 years; consulting clients, running training courses, and speaking at industry events. His mission now is to make Measurelab the world’s favorite digital analytics consultancy and the all-time greatest place to work (for analytics types).
Demystifying Google Analytics 4 (and why it’s not as scary as you might think)
In the coming months, we will be publishing a series of blog articles documenting the GA4 transition process. Continue reading for a special training deal for Swydo customers!
Time is running out for Universal Analytics (UA). Google Analytics 4 (or just GA4) is Google’s next-generation measurement solution and is replacing Universal Analytics entirely. In this blog series, we aim to show you that this is not a reason to panic. We believe GA4 is a major shift in the right direction, a sign of real progress, and therefore an opportunity for marketers to be better informed and make better decisions, based on the features offered by GA4.
We’ll start with this overview, a lay of the land if you will. And in the subsequent posts in the series, we will dive a little deeper – with practical advice and examples – to help you migrate confidently to GA4 and start using it to its full potential.
In the meantime, and without wanting to give too many spoilers, here’s the topline for what you can expect from the following posts in this 5-part series:
Part 2 – Events, events, events!
What is the Google Analytics 4 data model and why is it all built on events? This will be a core part of the series. We will explain the different types of events, with plenty of examples. And how conversions fit in (with comparisons against UA).
Part 3 – Reporting and the library: how to make the GA4 UI your own
See how to use the different reports available in GA4, and how to customize GA4 reports to your business requirements. We’ll even cover how to change the reports menu within the GA4 interface.
Part 4 – GA4 and Swydo: how to get the data you need in the place you need it
This will nicely follow the previous post, which talked about report customization within GA4, covering how to get the data out of Google Analytics 4 and into the Swydo platform.
Part 5 – What next? What the future holds, what you need to do and when
We will go deeper into what all this means, and what needs to be done to finalize a migration to GA4. This will also allow us to cover any common frequently asked questions that might have arisen from the previous 4.
With this blog series we hope to cover the most commonly required of these new features, with practical examples, but GA4 is a powerful, new tool and we appreciate there is a lot to learn. To gain complete confidence in using GA4 to its full potential, knowing both its limitations and its differences from UA, we recommend registering your interest for our 6-week Google Analytics 4 Immersion training course at a special price for Swydo customers.
Why there is no reason to panic
The fact is Google’s timeline for the sunsetting of UA has left many businesses feeling panicked. It’s worth noting that this is the first time Google has made a change to GA that results in historical data becoming unavailable. There are many GA accounts in use that will have data from urchin, classic GA and Universal, all in the same property.
GA4 timeline to keep in mind
First some straightforward facts. Data will stop being collected for standard, i.e. free, UA properties on July 1, 2023. Then you will have until July 1, 2024 to access your historical data in UA. After July 1, 2024, you’ll no longer be able to see your UA reports in the GA interface or access any UA data via the API.
Saving your historical data
For this reason, Google strongly recommends exporting your historical reports during the 6-month window from July 1, 2023 (if not before). However, we would advise you to consider how much historical data will actively be used and for which purposes. Exporting and storing all your historical data will involve some effort so this shouldn’t be done just for the sake of keeping it.
A one-off extension was recently announced for 360 UA properties. Data will continue to be collected until July 1, 2024. We talked about this extension on a recent episode of our podcast: The Measure Pod: The inevitable… Google postpones sunsetting GA360. GA 360 UA properties will also lose access to historical data effect July 1, 2024.
Time for a quick reality check. For those of us wishing to continue using GA as our primary marketing analytics tool, we have no choice but to move wholesale to GA4. In return, you get a rich feature set including machine learning-based behavioral and predictive modeling, a free export of your GA4 data to BigQuery for data warehousing and larger analysis projects, and a much improved event-based data collection model.
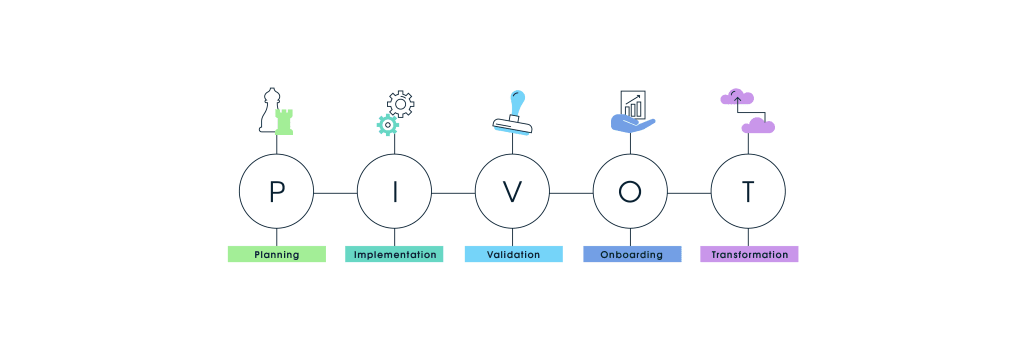
The five-step framework you can follow
At Measurelab we have developed our own five-step framework for migrating to GA4, which you can read more about on our blog here: PIVOT framework, and/or listen to us talk about it on our podcast here: The Measure Pod: The GA4 PIVOT framework). The PIVOT framework (standing for Plan, Implement, Validate, Onboard, Transform) can help you regardless of what stage you are at currently in your adoption of GA4.
GA4 and BigQuery
For all existing GA4 properties you have, we strongly recommend setting up the free connector to Google BigQuery right away as there is no backfill option if you do this further down the line (unlike with the BigQuery connector for GA360, which backfilled 13 months). If you are not already aware of the benefits, you can read our article 10 reasons to export your GA4 data to BigQuery.
Aside from the free BigQuery connector for all GA4 accounts, there is a goody bag of new features introduced with GA4 that we believe should get you as excited as we are. These include:
Automatic event tracking (enhanced measurement) and event editing and creation (customized events), all of which we will cover in the next post
Machine learning models, which you can learn more about from Measurelab’s Daniel Perry-Reed: GA4 machine learning made easy?
These models both supplement the observed data collected by GA and also predict future behavior.
You can build custom funnels with up to 10 steps, and even see the average time elapsed between steps
Free connectors to SA360, DV360, CM360 (which was previously for GA360 only)
However, you will also have to say goodbye to some of the features you may be familiar with from Universal Analytics, including
Site speed metrics (not a big loss in our view, as there are better tools for this)
Some of the basic/standard e-commerce reports and funnels
Session-level custom dimensions and also custom metrics
And of course, Views! (which is a pain but not a dealbreaker)
Let’s do this together!
Track your GA4 data with Swydo
Track your GA4 data with Swydo. Once you’ve connected your Google Analytics 4 account to Swydo, you can include essential GA4 metrics with data from 30+ other marketing channels to get a comprehensive look at your marketing efforts in one automated report or dashboard. Set up your free 14-day trial, and start building your first GA4 report today! Need help? Visit Swydo’s help center, contact them through in-app text, or email support@swydo.com. Or schedule a walkthrough.
Dara is CEO of Measurelab. He has specialized in Google Analytics for the last 15 years; consulting clients, running training courses and speaking at industry events. His mission now is to make Measurelab the world’s favorite digital analytics consultancy and the all-time greatest place to work (for analytics types).
In this article, GA4 experts unravel the difference between the reporting in Universal Analytics vs. the new Google Analytics 4 for digital marketers
In this article, we are going to discuss:
What has changed?
How Google Analytics 4 improves reporting?
Best ways to use Google Analytics 4 reports
Google Analytics 4 reporting identity and how to configure it
Migration and next steps
Ever find yourself sitting at your desk thinking, “I still have to migrate to GA4 – it’s a nightmare!”?, No? Okay, that might just be some of our friends. But yes, GA4 is here and it officially takes over from Universal Analytics on July 1, 2023, and from Universal 360, on Oct 1, 2023.
Google Analytics has changed a lot since its birth in 2005, the new GA4 promises to be better, faster, and, fairer. But this migration comes with its own challenges, and we are here to help you. Getting started with GA4 migration now will help you get accustomed to the new interface, access the unique features of the platform, and get familiar with how you can use reports in GA4 to improve the effectiveness of analysis and deliver better insights to your clients/stakeholders.
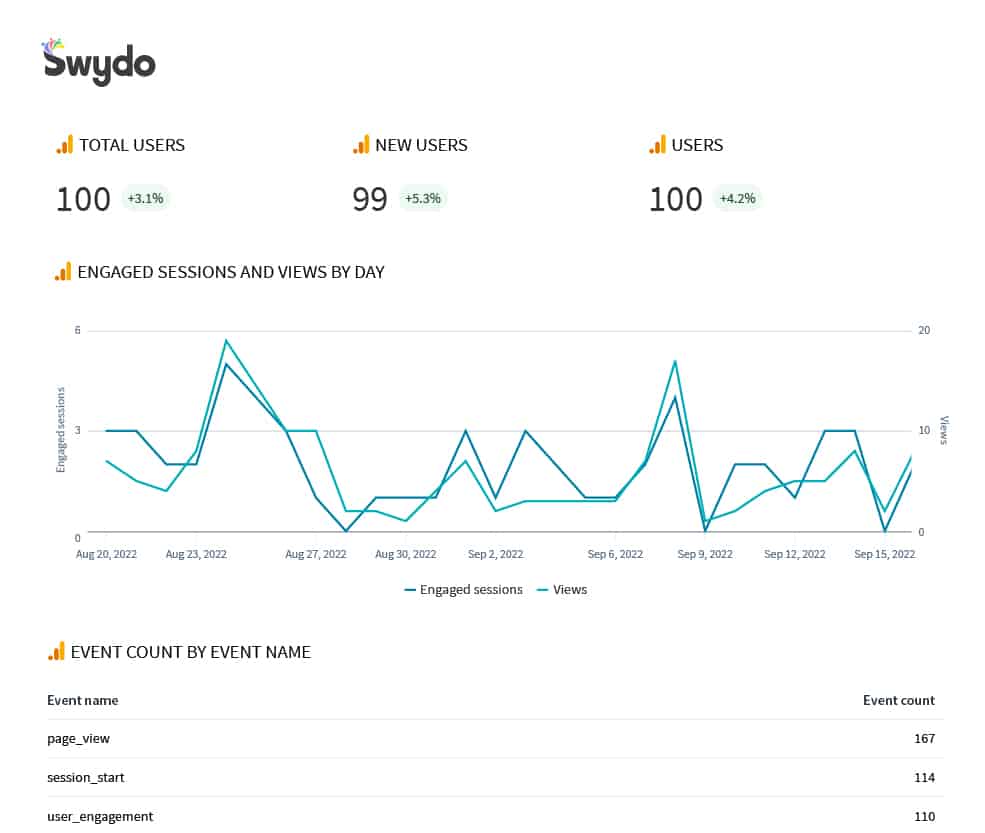
GA4 reports in Swydo
GA4: What has changed?
The most significant change in GA4 is how it collects and structures data in comparison with Universal Analytics (UA). The GA4 measurement model is more flexible and robust with better visualizations and report snapshots.
UA uses the measurement model which is based on sessions and pageviews. In GA4, every user interaction type is an event – page views, conversions, clicks, etc.
Why is that important? GA4 is designed to create custom reports that are more user journey-focused. This way you can track active users engaging on the website rather than total users.
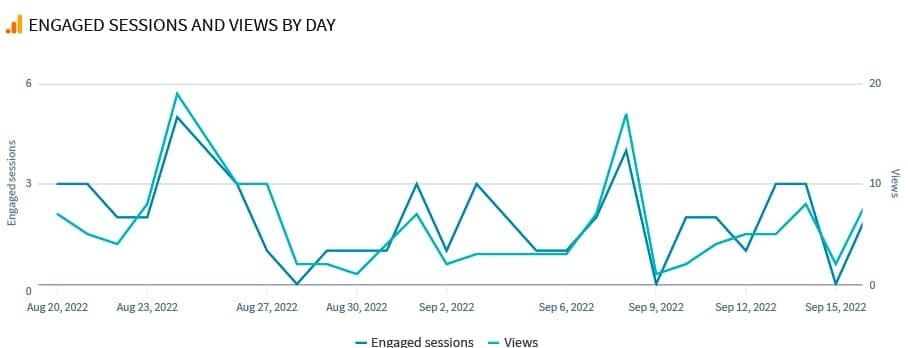
The new GA4 metrics to keep track of
UA metrics that are no longer available in GA4 include bounce rate, pages per session, or average session duration.
Essential dimensions and metrics you now have are engaged session durations, engagement rates, and engaged sessions per user.
Engagement rate and bounce rate are supplementary metrics and those who are keen to use bounce rate can calculate it by the below formula:
Bounce rate = 100% – Engagement rate **the numbers will differ a bit from what you see in UA because the engagement metric not only counts sessions with 2 or more pageviews but also counts sessions that have spent more than 10 seconds or have triggered a conversion event.
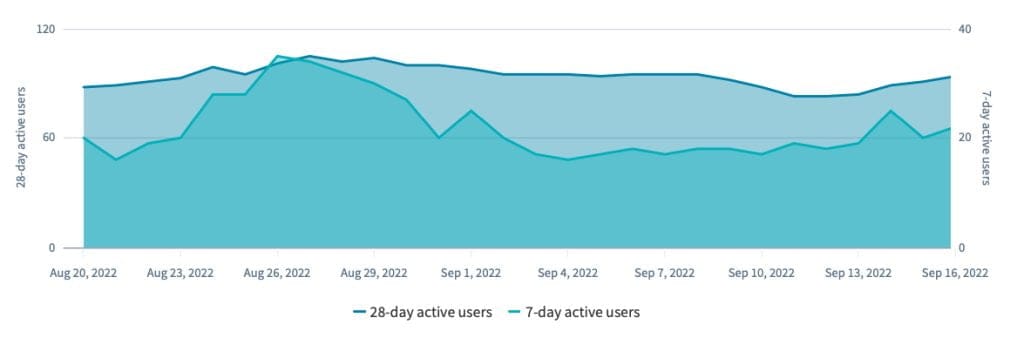
Another big change among metrics is the introduction of active users. An active user is someone who has an engaged session or has triggered the below events:
first_visit event or engagement_time_msec parameter (website)
first_open event or engagement_time_msec parameter (Android app)
first_open or user_engagement event (iOS app)
In all Universal Analytics reports ‘total users’ were shown as users while GA4 shows ‘active users’ as users in all reports.
What are GA4 events?
In the case of GA4, everything is an event, and there are four categories of events you need to know:
Automatically collected events – Are collected by default if you have GA4 installed on your website or app, such as page_view.
Enhanced measurement events – Are collected when enhanced measurement is enabled for a web data stream. No code-level changes are needed for this.
Recommended events – Have predefined names and parameters and are only collected when you implement, such as a purchase or generate_lead event. Recommended events are shown in your standard reports making them even more insightful.
Custom events – Are events that need to be defined and don’t show up in most standard reports. To perform meaningful analysis, you’ll need to set up custom reports or explorations.
Things to keep in mind while setting up your GA4 events
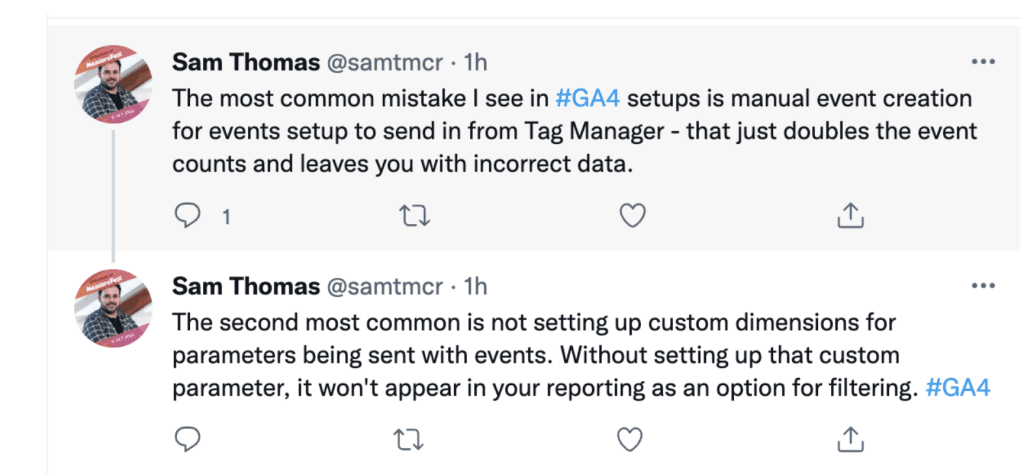
**Highlighting the importance of events, it is recommended that you track event data in Google Tag Manager by setting up tags and triggers via GTM. For example, if you want to track things like page timers, clicks on a page, link clicks, external link clicks, or video views, there’s a corresponding tag and trigger in Google Tag Manager that can be used to push the data to GA4.
Sam Thomas on Twitter explains GA4 tagging and triggers
How GA4 improves reporting
It is crucial to understand that the change in the GA4 data model is focused on increasing the effectiveness of data analytics and minimizing irrelevant information. Here are some essentials in Google Analytics 4.
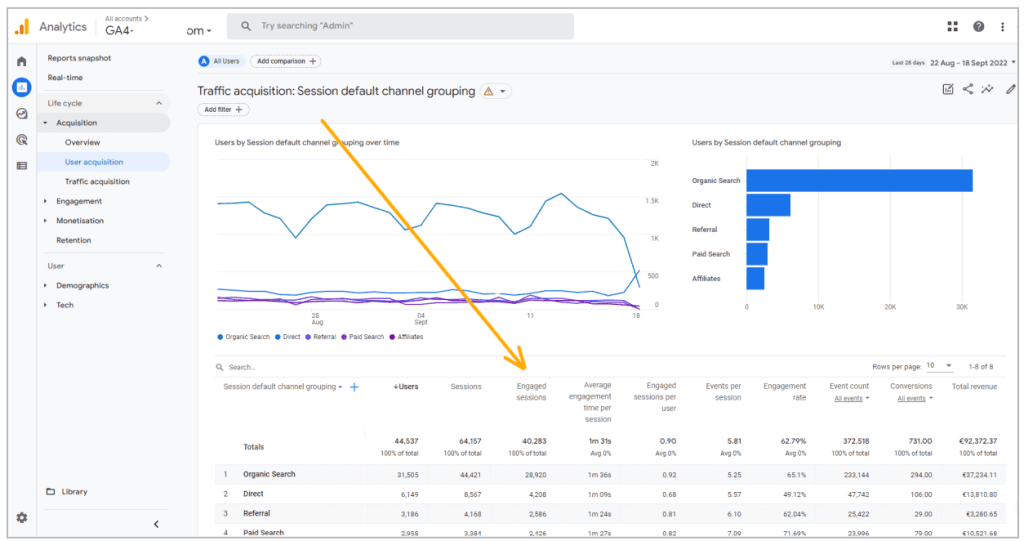
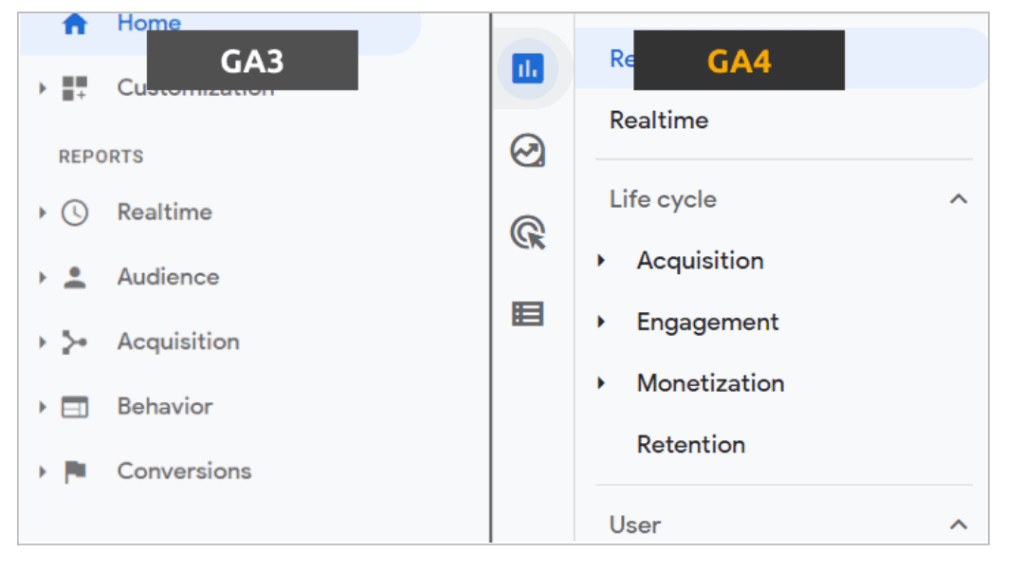
The difference in reporting UA vs. GA4
A better idea of the user journey – The UA sections like ‘audience’, ‘behavior’, and ‘conversion’ are replaced by ‘engagement’, ‘monetization’, and ‘retention’. This enables marketers to break down the user activity through each stage in the customer user journey funnel from acquisition to retention.
An eagle eye view on engagement – In GA4 you can view Engaged Sessions and Engagement Rate compared to UA which uses ‘bounce rate’ as one of the metrics to measure site engagement. Arguably engagement rate is more useful than bounce rate as it also accounts for time spent on the page and conversions.
Tracking specifics – The reports in GA4 can be generated when you track events using a measurement ID tag. GA4 allows you to track the specific things you care about. For example, you can track when a user clicks a specific button on a specific webpage, making segment comparisons easy.
Determine what conversion means to you – In GA4, there is no need to set up goals based on a restricted set of conversion criteria. For example – let’s say you are tracking an event finished_reading on your blog article pages that gets fired when a user scrolls through 90% of the article page. To make this more accurate you can add a condition of time spent = 4 minutes.
Wider view in one glance – GA4’s enhanced AI allows for better data visualization capabilities. The real-time data visualization is enhanced to avail a wider view of all the real-time data in just one glance.
Cross-device reporting – GA4 provides significantly better and more accurate cross-device tracking than UA. This helps you get a better picture of your marketing campaigns across devices and fixes cross-device attribution issues.
Important to note: Because of the changes in the new GA analytics, the user count and the session count can drop from UA to GA4. Why? Because you’re looking at users interacting with your site rather than viewers with zero interactions, so don’t get alarmed if the data on GA4 doesn’t match UA.
Best ways to use GA4 reports
On a broader level, we have two types of reports – Standard reports and Custom reports (aka the Explorations section)
Standard reports in GA4 are prebuilt reports. They provide data in visually appealing summary cards that can be used to quickly identify user trends and anomalies.
The Explorations section gives you advanced techniques to go beyond the standard reports. You can answer complex questions, explore your data in depth and create audiences that can be used in Google Ads.
Let’s go through various reports available in GA4 one by one.
Life Cycle
The Life Cycle collection in GA4 comprises four reports and are categorized as follows:
It showcases the story of the journey that users take with your website by mirroring the funnel of acquiring, engaging, monetizing and retaining users.
Compared to Universal Analytics, GA4 lifecycle reports are more focused on the customer user journey as it helps marketers get a better picture of how customers coming from different sources/mediums move through the funnel.
Acquisition
In UA, there is a huge collection of 30 standard reports that can be created within the Acquisition reports. In GA4, there are only three standard reports.
The Acquisition reports highlight where new and returning users come from. It’s one of the most valuable datasets GA4 offers. It can even be customized for comparing the data you care about the most within a few clicks.
Engagement
In past versions of GA, there was no direct way to measure engagement. One was forced to use metrics like bounce rate to create calculations for engagement. With the Engagement report, you can measure how users engage with the website based on the conversion events the user triggers when they visit web pages and app screens.
GA4 engagement metrics in Swydo
Monetization
Monetization in GA4 shows data for websites to track revenue-based events like in-app purchases and eCommerce. Note that you will not see any data in the report until the specific events are set up.
The Monetization report in GA4 provides an easy way to view in-depth details about the money generated and the revenue sources, identify user trends and determine the efficiency of your campaigns. Additionally, the Monetization report offers many customizable elements that enable you to monitor any revenue you wish.
Retention
Retention reports in GA4 show the overall percentage of visitors who return each day in the first 42 days after visiting your website. This set of reports will help you understand how frequently and for how long users engage with your website or mobile app after their first visit. For example, you can check user retention by cohort to see new vs. returning users. This section of GA4 reports is an excellent place to go if you’re looking to explore how you have retained users from a specific campaign or promotion.
GA4 retention metrics in Swydo
User Reports
GA4 includes a User collection comprising two reports, the Demographics report and the Tech report.
The data within the collection helps you gain insights into the type of users visiting the website.
Demographics
It’s one thing to know what visitors are doing on the website, but to fully understand your target users, you must know who those visitors are.
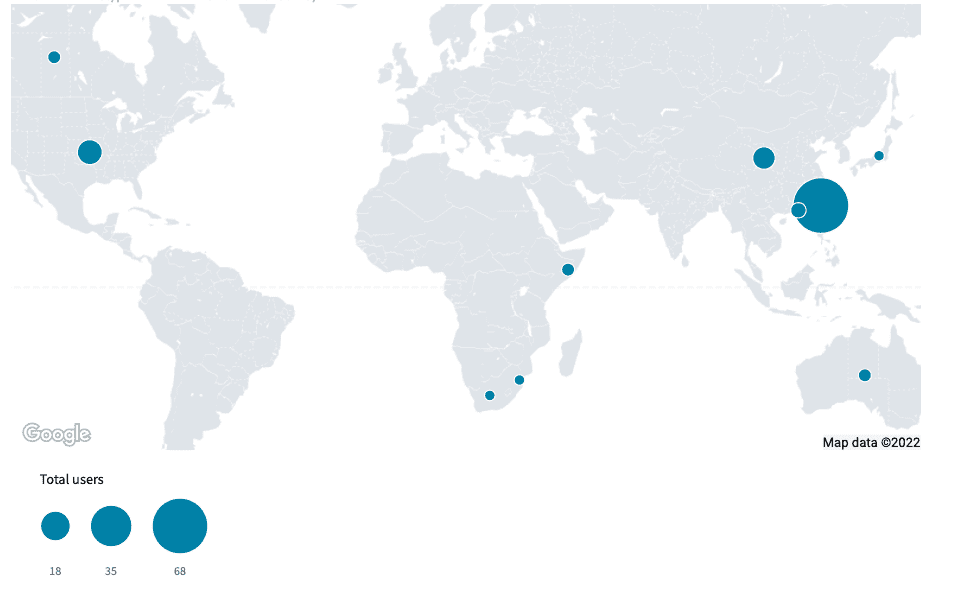
The Demographics report in GA4 highlights information about users who visit your client’s websites, their average age, country, language, city, interests and gender.
This information can help you hone in on your target audience and better tailor your marketing efforts toward them.
Tech
The Tech report displays information about users’ smart devices. Device categories are split between desktops, mobile devices and tablets. The Tech reports also show users’ methods of accessing the website content. For example, visitors could view the website from an iOS app, web browser or Android app.
You can utilize the data collected in reports to understand how users view the website’s content and then improve that content or plan future execution to fit user preferences better.
GA4 User Reports in Swydo
The game changer for analysis – Explorer Reports
Universal Analytics, this feature was only available to paid GA 360 users, but in GA4 Explore Reports are available to everyone.
The Exploration section goes beyond standard reporting to build your own custom reports and uncover much deeper insights that were not possible with Universal Analytics.
To give you an example – using Funnel exploration, you can map the complete journey that your visitors take on your website and easily identify where the majority of them are dropping off and signing up, evidently informing you what is working and what you need to improve next.
GA4 currently provides the following Exploration analysis techniques:
Free-form exploration – used when you want to visualize data in tabular or graph form.
Funnel exploration – used when you want to visualize the user’s journey throughout your site by looking at the steps needed to complete a goal.
Path exploration – you’ll use this to explore your user journeys in a tree graph.
Segment overlap – lets you compare up to 3 segments to analyze how they correlate and overlap with each other.
Cohort exploration – gathers data based on common attributes of a group of users, such as acquisition date range.
User explorer – used to gather data about a specific user at the session level.
User lifetime report – data about how individual users behaved as customers and their lifetime value.
The default reports in GA4 help you monitor the key business metrics. But Explorations give you access to data and analytical techniques unavailable in the pre-built reports. You can use Explorations to analyze the data in-depth and answer different complex questions about it, such as:
How many users are passing through each step of the website funnel? And at which steps are drop-offs happening?
What is the click-through rate of various CTAs (or forms) on my lead generation website?
Which products have the highest view-to-add-to-cart ratio and which ones have the lowest?
Special note for PPC marketers using GA4
All users of the GA4 property can access the Advertising workspace segment. Reports within the workspace look and function differently than other GA4 reports. There are currently three reports in the Advertising workspace:
Advertising snapshot: Get an overview of business metrics and then get deeper access into the areas you want to explore.
Model comparison: Compare different attribution models that impact the valuation of your marketing platforms.
Conversion paths: See your client’s customer paths to conversion, and learn how attribution models distribute credit on those paths.
You can use advertising reports to answer questions like:
What roles did searches, referrals, and ads play in conversions?
How much time passed between a user’s initial interest and purchase?
What are the common paths customers initiate that lead up to conversions?
Real-time Reporting
Like UA, the real-time report in GA4 enables you to monitor app and website activity as it happens. It also provides the data in an easy-to-read format with visuals that include information about:
The number of users that visited your site in the last 30 minutes.
The source of the visitors.
The description of users.
The content type details with higher engagement.
The type of events the audience triggers and the conversions they complete.
Both UA and GA4 provide powerful real-time reporting. However, Google Analytics 4 properties come with AI-powered improvements, one of which is a major facelift.
With GA4, you can access more interactive visuals, which can help you dive deeper into certain widgets like event triggers.
GA4 provides an immediate snapshot of the data using cards. You can utilize the cards to navigate data from one main viewpoint easily.
How to set up a default reporting identity?
Reporting identity is the method that GA4 employs to unify the journey of a single user as they move across devices.
GA4 uses the following four different methods for identity:
User ID
Google Signals
Device ID
Modeling
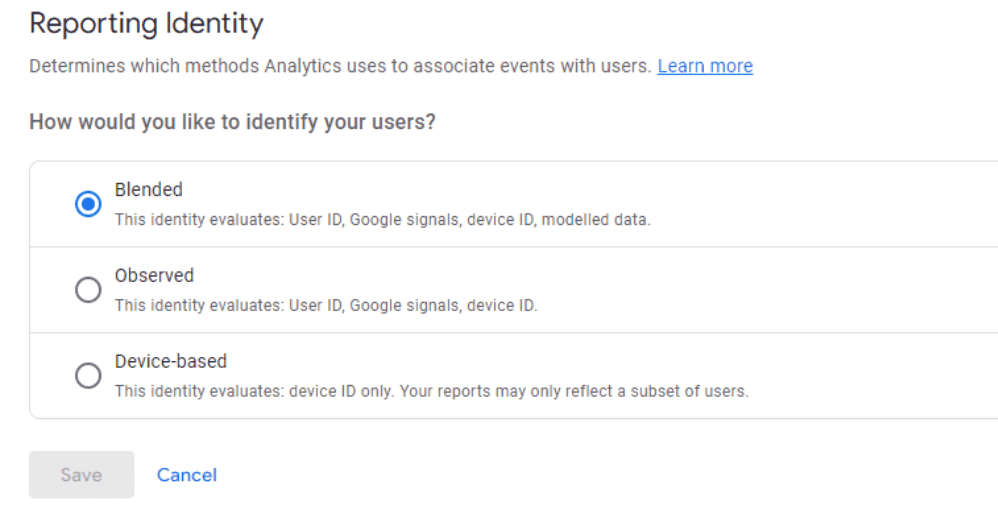
You have three options to select from – Blended, Observed, or Device-based.
GA4 reporting identity
In blended, it first relies on the User Id if you have implemented this.
In case of no User Id, the analytics will fall back to the second option – Google Signals (if enabled).
If neither the User Id nor Google Signal is enabled, it will fall back to the Device Id and if that is also not available, GA4 will use modeling.
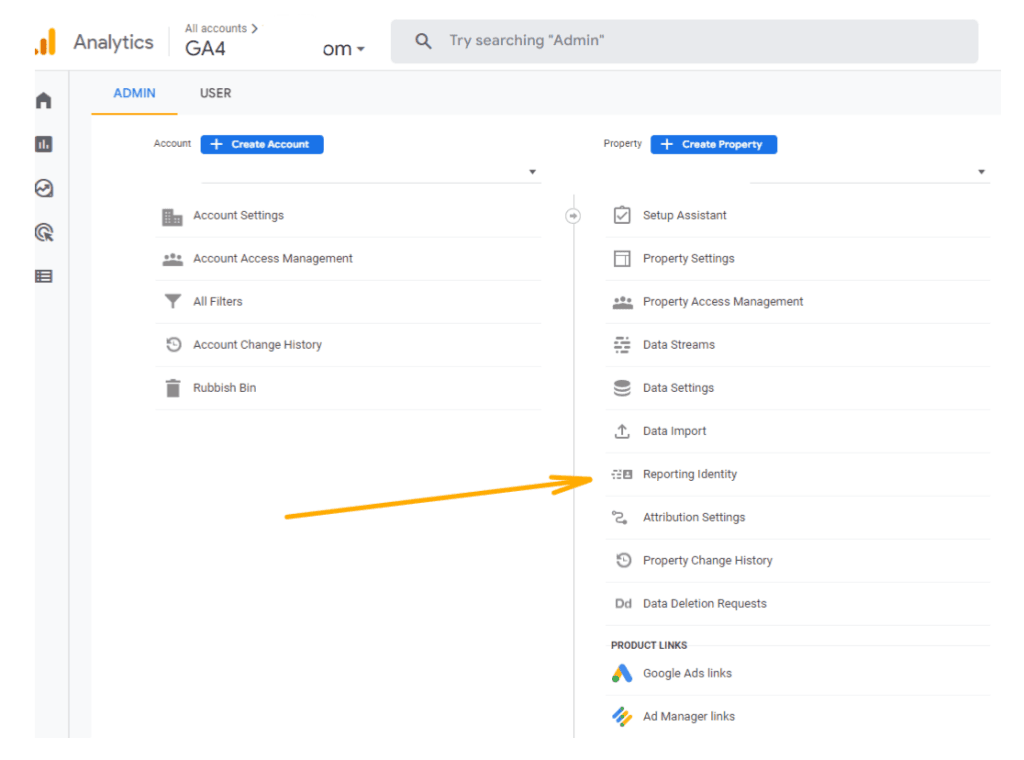
You can follow these steps to set up your default reporting identity
Log into the GA4 property and click “Admin” on the bottom left of the dashboard
Under “Property,” click “Default reporting identity”
Select your preferred option among – Blended, Observed and Device-based
Once you select your preferred reporting identity, you click save to implement the changes
Default reporting identity is the setting you’ll need to update to define how your GA4 property categorizes and identifies users throughout your reports
Switching to GA4 and the next steps?
If you want year-over-year data for next year, you should set up GA4 now. The more you wait, the longer you’ll have to wait for the year-over-year comparison data.
You can use GA4 alongside UA until it is officially retired. For this, you can dual-tag GA4 in parallel to your existing UA so that your reporting system remains interrupted while you make this transition.
Follow the migration process with precision. Here are the easy steps can start with:
Step 1: Create your GA4 property and launch it
Step 2: Make a list of the key elements that you’ll be migrating to GA4 – events, goals, etc.
Step 3: Begin migrating all elements to GA4
Step 4: Link all other tools (Google Ads, Search console, etc) to your GA4
Step 5: Finish the migration. Test and validate your data.
Step 6: Define the date when you’ll be using GA4 as your primary source.
All your Google Analytics 4 marketing insights in one holistic report with Swydo
We understand that migration from UA to GA4 is challenging for most of us. Swydo is offering both integrations and appropriate templates to facilitate reporting on both UA and GA4. This means our clients can include both their UA and GA4 properties together in one Swydo report via separate pre-built widgets and customize their marketing campaign reporting the way they want. Once you’ve connected your analytics account to Swydo, you can include and customize essential GA4 metrics with data from 30+ other marketing channels to get a comprehensive look at your marketing efforts in one automated report or dashboard.
Swydo supports GA4 reporting for SEO, PPC, and all things digital marketing! Image courtesy: GA4 experts