
The TikTok metrics you’re tracking probably aren’t relevant to what your clients value. Your dashboard shows 47 different data points, but your client only cares about one thing – did their ad spend make them money?
Most agencies make the same mistake. They report everything TikTok gives them instead of focusing on metrics that actually influence business decisions. Your client doesn’t need to know about 25% video completion rates. They need to understand if TikTok is driving profitable customers.
When you cook a meal, you don’t measure every ingredient to the gram unless it affects the final taste. TikTok metrics work the same way – only track what changes how you optimize campaigns or what your client uses to make budget decisions.
Why Your Current TikTok Ads Reporting Is Probably Wrong
Let me ask you something. Does your client understand what “Video Watched 6S” means for their bottom line? Can they explain why “Complete Payment ROAS” matters more than regular ROAS? If not, you’re reporting vanity metrics instead of business metrics.
Think about your own client conversations. How often do they ask about video completion rates versus how often they ask about return on investment? Traditional TikTok reporting focuses on platform-specific metrics that don’t translate to business value.
TikTok now generates $33.1 billion in global ad revenue with 24.5% year-over-year growth because businesses figured out how to connect platform metrics to actual revenue. But most agencies still report like TikTok is a brand awareness channel instead of a performance channel.
Your challenge is different from in-house marketers. You need to prove value to clients who might not understand digital marketing nuances. They want simple answers to simple questions. Did my investment work? Should I spend more money next month?
The Real Difference Between Agency Reporting and Internal Reporting
Your clients don’t behave like marketing managers at Fortune 500 companies. They don’t have time to analyze 47 different metrics or understand attribution windows. They need dashboards that tell stories about business performance, not platform performance.
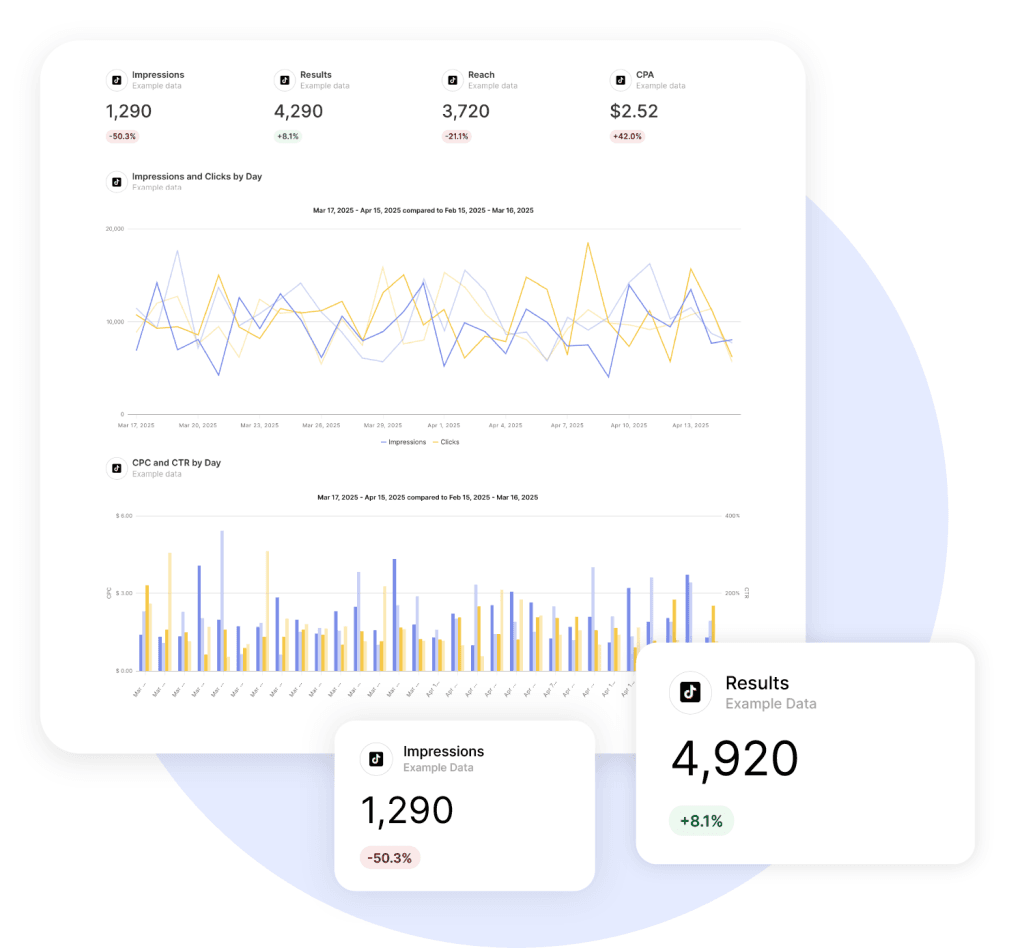
When your client logs into their Swydo dashboard, they should immediately understand three things. How much did we spend? What did we get back? Should we do more of this? Everything else is supporting detail for optimization conversations.
Internal marketers can get excited about engagement rates and video completion metrics. Your clients care about customer acquisition costs and lifetime value. This changes how you should structure every single report and dashboard.
Most agencies copy their internal reporting templates for client dashboards. This creates confusion because clients interpret metrics differently than marketers do. Your reporting needs to match your client’s business vocabulary, not TikTok’s platform vocabulary.
12 Most Important TikTok Ads Metrics to Track
Why It’s Important: Shows actual money returned for every dollar spent – 79% more accurate than last-click attribution models.
What Does It Measure: Real revenue impact, not just conversion counts.
How to Calculate: Complete Payment ROAS = Total Purchase Value / TikTok Spend.
Benchmark: Food & beverage: 3.5x, E-commerce: 2.5x, Financial services: 1.2x.
Best For: Primary business metric that answers “Did this work?”
Related Metrics: Total Purchase Value, Cost Per Conversion.
Common Pitfalls: Using generic ROAS instead of Complete Payment ROAS misses TikTok’s true attribution value.
Why It’s Important: Shows how much revenue TikTok generated, not just conversion volume.
What Does It Measure: Actual business revenue driven by TikTok campaigns.
How to Calculate: Sum of all purchase values attributed to TikTok ads.
Benchmark: Varies by business type – focus on growth trends rather than absolute numbers.
Best For: Understanding TikTok’s direct revenue contribution to business growth.
Related Metrics: Complete Payment ROAS, Average Order Value.
Common Pitfalls: Clients care more about one $10,000 purchase than ten $50 purchases – focus on value, not volume.
Why It’s Important: Gives clients context for efficiency relative to customer lifetime value.
What Does It Measure: How much it costs to acquire each paying customer through TikTok.
How to Calculate: Cost Per Conversion = TikTok Spend / Number of Conversions.
Benchmark: Food & beverage: ~$15, E-commerce: varies widely, Financial services: ~$75.
Best For: Determining campaign profitability and budget allocation decisions.
Related Metrics: Complete Payment ROAS, TikTok Conversion Rate.
Common Pitfalls: Not comparing to customer lifetime value makes this metric meaningless for business decisions.
Why It’s Important: TikTok’s premium engagement metric that correlates with purchase intent better than impressions.
What Does It Measure: Quality engagement indicating genuine interest in your content.
How to Calculate: Count of users who watched your video for at least 6 seconds.
Benchmark: Video Quality Score = (Video Watched 6S ÷ Impressions) × 100 – aim for 20%+.
Best For: Predicting conversion performance and creative effectiveness.
Related Metrics: Video Completion Rate, Engagement Rate.
Common Pitfalls: High 6-second views with low conversions may indicate targeting misalignment.
Why It’s Important: Shows how well audience targeting performs compared to traffic volume.
What Does It Measure: Percentage of TikTok users who complete desired actions.
How to Calculate: Conversion Rate = (Conversions / Total Clicks) × 100.
Benchmark: Food & beverage: 0.8%, E-commerce: 0.46%, Financial services: 0.3%.
Best For: Deciding between broader reach strategies or more targeted approaches.
Related Metrics: Cost Per Conversion, CTR.
Common Pitfalls: Low conversion rates might indicate entertainment-focused content that doesn’t drive action.
Why It’s Important: Indicates message-market fit and creative resonance with TikTok audiences.
What Does It Measure: How compelling your ad content is to TikTok users.
How to Calculate: CTR = (Clicks / Impressions) × 100.
Benchmark: Higher CTR usually leads to better conversion rates and lower costs – varies by industry.
Best For: Evaluating creative effectiveness and audience targeting accuracy.
Related Metrics: Cost Per Click, Conversion Rate.
Common Pitfalls: High CTR with low conversions suggests entertainment value without purchase intent.
Why It’s Important: TikTok achieves 4x higher engagement than Instagram’s 0.50% average, indicating platform advantages.
What Does It Measure: Audience quality and creative performance through likes, comments, shares.
How to Calculate: Engagement Rate = (Likes + Comments + Shares) / Impressions × 100.
Benchmark: Food & beverage: 16%, E-commerce: varies, Financial services: 8%.
Best For: Understanding content resonance and brand building potential.
Related Metrics: Video Watched 6S, Profile Visits.
Common Pitfalls: High engagement without conversions may indicate misaligned campaign objectives.
Why It’s Important: Provides context for traffic quality and competitive positioning on TikTok.
What Does It Measure: Efficiency of driving traffic from TikTok to your website or landing page.
How to Calculate: CPC = TikTok Spend / Total Clicks.
Benchmark: Average $0.80 for e-commerce; higher CPMs justified by actively engaged users.
Best For: Comparing TikTok traffic costs to other platforms and optimizing bid strategies.
Related Metrics: CTR, Cost Per Conversion.
Common Pitfalls: TikTok’s premium CPC is justified by higher engagement – don’t compare directly to passive platforms.
Why It’s Important: Represents serious brand interest beyond passive ad exposure – users actively research your company.
What Does It Measure: Quality of brand interest and potential for deeper engagement.
How to Calculate: Count of users who visited your TikTok profile after seeing ads.
Benchmark: Brand Interest Rate = (Profile Visits + Follows) ÷ Reach – higher percentages indicate strong brand appeal.
Best For: Measuring long-term brand building value and audience quality.
Related Metrics: Follows, Engagement Rate.
Common Pitfalls: Profile visits without follows may indicate curiosity without genuine interest.
Why It’s Important: Shows immediate business impact that clients can act on quickly, unlike delayed reporting from other platforms.
What Does It Measure: Campaign momentum and immediate conversion performance.
How to Calculate: Real-time tracking of conversions as they happen during campaign delivery.
Benchmark: Use for trend analysis rather than absolute benchmarks – focus on acceleration or deceleration patterns.
Best For: Quick campaign optimization decisions and budget reallocation.
Related Metrics: Complete Payment ROAS, Cost Per Conversion.
Common Pitfalls: Real-time data may not include all attribution windows – use for optimization, not final reporting.
Why It’s Important: Clients need to see spend trending alongside performance metrics to understand campaign efficiency changes.
What Does It Measure: Total budget allocation and spending velocity on TikTok campaigns.
How to Calculate: Sum of all campaign costs over specified time period.
Benchmark: Should trend proportionally with revenue metrics for sustainable growth.
Best For: Budget planning and efficiency analysis when compared to revenue metrics.
Related Metrics: Complete Payment ROAS, Total Purchase Value.
Common Pitfalls: Reporting spend without revenue context makes it difficult for clients to assess value.
Why It’s Important: Tells clients how many unique people saw their message – crucial for brand building and market penetration goals.
What Does It Measure: Unique audience size and market coverage potential.
How to Calculate: Count of unique users who saw your TikTok ads.
Benchmark: Compare to target market size to understand penetration percentage.
Best For: Justifying campaign budgets for new product launches or market expansion.
Related Metrics: Profile Visits, Engagement Rate.
Common Pitfalls: High reach with low engagement may indicate poor targeting or weak creative content.
Client-Focused TikTok Metrics That Actually Drive Decisions
Understanding which metrics matter to clients versus which metrics help you optimize requires thinking like a business owner instead of a marketer. These categories organize metrics by client value rather than platform features.
Revenue Impact Metrics Your Clients Actually Read
Complete Payment ROAS should be your primary metric, not generic ROAS calculations. This metric shows actual money returned for every dollar spent, which directly answers your client’s most important question. TikTok’s Attribution Analytics research shows this metric provides 79% more accuracy than last-click attribution models.
Total Purchase Value tells clients how much revenue TikTok generated, not just how many conversions happened. Your client cares more about a $10,000 purchase than ten $50 purchases, even though conversion counts look similar.
TikTok Cost Per Conversion gives clients context for efficiency. When they see $25 cost per conversion, they can immediately compare this to their average customer lifetime value and decide if campaigns are profitable.
Real Time Conversion helps clients understand campaign momentum. Unlike other platforms where conversions might take days to report, this metric shows immediate business impact that clients can act on quickly.
But most agencies bury these metrics under engagement data and impression counts. Are you leading your client reports with revenue metrics or vanity metrics?
Efficiency Metrics That Justify Budget Increases
TikTok Spend might seem obvious, but many agencies don’t present this clearly relative to results. Your clients need to see spend trending alongside performance metrics to understand campaign efficiency changes.
CTR matters to clients because it indicates message-market fit. When CTR increases, it suggests your creative resonates with the target audience, which usually leads to better conversion rates and lower costs.
Cost Per Click provides context for traffic quality and competitive positioning. Industry benchmarks show average CPC of $0.80 for e-commerce, which helps clients understand if their performance is competitive.
Video Watched 6S represents TikTok’s premium engagement metric that correlates with purchase intent. When clients understand that 6-second views predict conversions better than impressions, they start caring about this metric.
Which efficiency metrics does your client check first when reviewing monthly reports? These should be prominently displayed in your dashboards, not buried in secondary tabs.
Audience Quality Metrics for Strategic Decisions
Reach tells clients how many unique people saw their message, which matters for brand building and market penetration goals. This metric helps justify campaign budgets for new product launches or market expansion.
TikTok Conversion Rate shows how well your audience targeting performs compared to traffic volume. Clients can use this metric to decide between broader reach strategies or more targeted approaches.
Engagement Rate indicates audience quality and creative performance. Research shows TikTok achieves 4x higher engagement than Instagram’s 0.50% average, which helps clients understand platform advantages.
Profile Visits represent serious brand interest beyond passive ad exposure. Clients appreciate this metric because it shows users actively researching their company after seeing ads.
Are you explaining why these audience metrics matter for business growth, or just reporting numbers without context?
Industry Benchmarks That Matter to Your Client’s Business
Performance expectations should align with industry realities, not theoretical possibilities. Your clients need realistic benchmarks to set appropriate goals and budget allocations. These benchmarks come from analyzing millions of dollars in actual client spend across different business types.
Revenue Performance by Business Type
Different business models achieve dramatically different results on TikTok, and your clients need industry-specific expectations. Based on comprehensive performance analysis, clear patterns emerge across verticals.
E-commerce businesses typically see 2.5x ROAS with 0.46% conversion rates and $0.80 average cost per click. These numbers help e-commerce clients understand that TikTok excels at driving traffic and engagement but often requires other channels for final conversion.
Food and beverage brands dominate with 16% engagement rates and 3.5x ROAS because food content naturally fits TikTok’s entertainment environment. Recipe videos, restaurant reviews, and cooking trends fill users’ feeds daily.
Financial services struggle significantly with only 8% engagement and 1.2x ROAS. The platform’s entertainment focus creates challenges for traditionally serious financial messaging, which affects client expectations.
| Business Type | Average ROAS | Conversion Rate | Why Performance Differs |
|---|---|---|---|
| Food & Beverage | 3.5x | 0.8% | Entertainment value matches platform culture |
| E-commerce | 2.5x | 0.46% | Strong awareness, weaker direct conversion |
| Financial Services | 1.2x | 0.3% | Serious messaging conflicts with entertainment focus |
Which category describes your client’s business? If they’re in financial services, are you setting realistic expectations about TikTok’s role in their marketing mix?
Cost Efficiency Expectations
Average CPM on TikTok runs higher compared to Facebook’s.. Your clients pay this premium because they’re reaching actively engaged users, not passive scrollers.
Cost per conversion varies dramatically by industry and campaign objective. Food and beverage brands might achieve $15 cost per conversion while financial services might see $75. Your client’s industry context matters more than cross-platform comparisons.
Engagement costs on TikTok typically run lower than other platforms despite higher CPMs because engagement rates are significantly higher. This helps justify TikTok investment for awareness and consideration campaigns.
Are you presenting these benchmarks to help clients understand their performance relative to realistic expectations rather than theoretical possibilities?
TikTok Ads Reporting Mistakes That Hurt Client Relationships
Most client reporting problems stem from measurement confusion, not campaign performance issues. These mistakes are so common that even experienced agencies make them regularly, which damages client trust and makes budget conversations difficult.
The Metrics Overload Problem
Agencies often report every available metric instead of focusing on business-relevant data. Your client doesn’t need to see 47 different metrics when only 8 influence their decision-making process.
- Symptom: Your client stops reading reports because they’re overwhelming
- Solution: Limit primary metrics to 5 that directly tie to business goals
- Test: Ask your client which 3 metrics they check first – those should dominate your reports
Too many agencies think more data equals better reporting. But clients want clarity, not complexity. Would you rather explain 12 metrics superficially or 5 metrics thoroughly?
Attribution Window Inconsistencies
Different platforms use different attribution windows, which creates comparison confusion when clients evaluate channel performance. TikTok’s default 7-day click, 1-day view differs from other platforms’ implementations.
- Problem: Client compares TikTok ROAS to Facebook ROAS without understanding attribution differences
- Impact: TikTok appears to underperform when attribution windows don’t match
- Fix: Standardize attribution windows across all platforms in client reports
Are you comparing apples to apples when showing multi-platform performance, or are attribution differences making TikTok look worse than it actually performs?
The View-Through Attribution Blind Spot
Research shows that click attribution undervalues TikTok conversions by 73%. Agencies that only report click-based conversions miss three-quarters of TikTok’s actual business impact.
- Client Impact: TikTok budgets get cut because reported performance looks poor
- Reality: TikTok drives significant conversions through view-through attribution
- Solution: Always include view-through attribution in client reports with clear explanations
Think about your client’s behavior. They probably see TikTok ads, remember brands, but convert through other channels later. If you’re not tracking view-through attribution, you’re missing this influence entirely.
Build TikTok Ads Client Dashboards That Actually Get Used
Creating effective client dashboards requires understanding how busy business owners consume information. They don’t analyze data like marketers do – they scan for key insights and look for trends that influence decisions.
The 3-Metric Priority System
Not every metric deserves equal space in client dashboards. Organize information using what I call the 3-metric priority system based on client decision-making patterns.
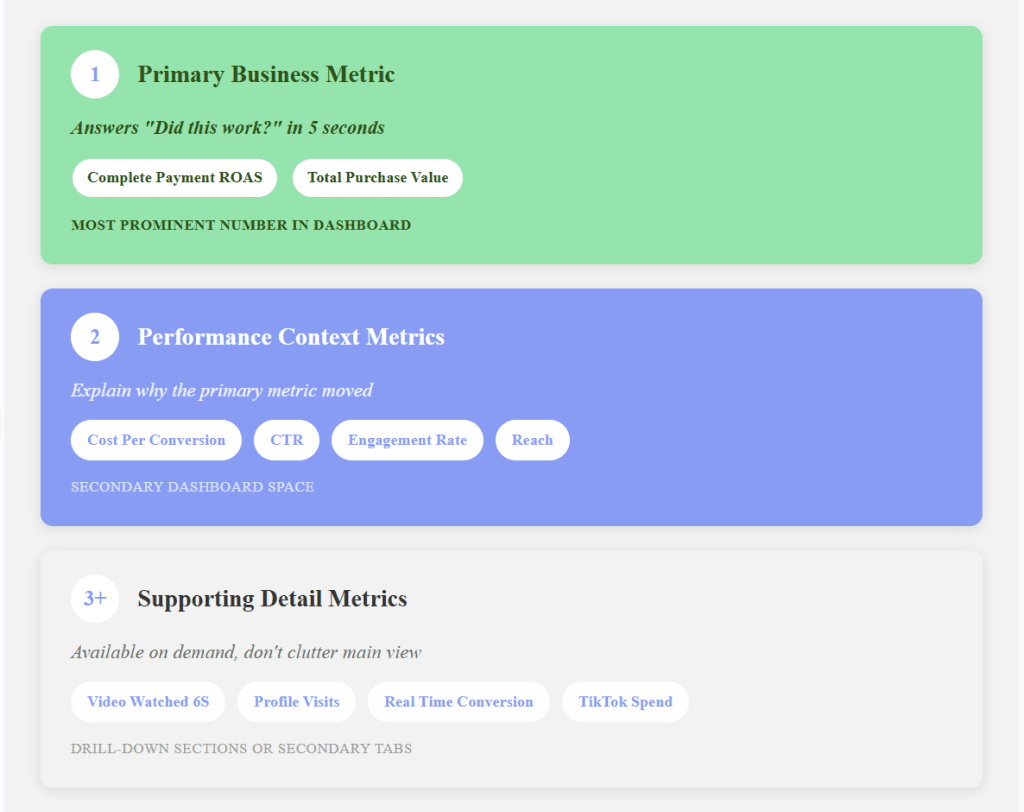
- Primary Business Metric that answers “Did this work?” Usually Complete Payment ROAS or Total Purchase Value. Your client should be able to answer their most important question within 5 seconds of opening the dashboard.
- Performance Context Metrics that explain why the primary metric moved. These might be Cost Per Conversion and Reach, or CTR and Engagement Rate depending on campaign objectives.
- Supporting Detail Metrics available on demand but not cluttering the main view. Video completion rates, frequency data, and platform-specific engagement metrics belong in secondary tabs or drill-down sections.
What’s the first metric your client checks when reviewing campaign performance? That should be the largest, most prominent number in your dashboard.
Custom Metrics That Tell Better Stories
Swydo’s custom metric capabilities let you create calculations that match client thinking patterns better than standard platform metrics. These custom metrics often communicate value more clearly than individual data points.
Engagement Cost Efficiency = (Likes + Comments + Shares) ÷ TikTok Spend shows how much engagement costs relative to spend. Clients understand this better than separate engagement and cost metrics.
Video Quality Score = (Video Watched 6S ÷ Impressions) × 100 indicates content effectiveness. This percentage tells clients if their creative resonates with TikTok audiences.
Revenue Per Impression = Total Purchase Value ÷ Impressions shows actual business value generated per ad exposure. This metric helps clients understand TikTok’s efficiency compared to other channels.
Brand Interest Rate = (Profile Visits + Follows) ÷ Reach measures how many people want to learn more about the business after seeing ads. This indicates long-term brand building value.
Which of these custom metrics would help your clients understand TikTok’s value more clearly than standard platform reports?
Your Next Steps
TikTok advertising success depends more on measurement sophistication than creative brilliance or targeting precision. Clients who understand their TikTok performance make better budget decisions and achieve better long-term results.
Focus on metrics that influence client decision-making rather than platform optimization. Your clients need dashboards that answer business questions, not marketing questions. They want to understand return on investment, not engagement rates.
Audit your current client reporting against this framework. Identify metrics that don’t influence client decisions and replace them with business-relevant calculations. Implement custom metrics that tell clearer stories about TikTok’s contribution to business growth.
What’s the one reporting change you’re going to implement first? Which client would benefit most from better TikTok performance visibility? Your client relationships improve when reporting creates clarity instead of confusion.
The agencies winning with TikTok advertising are those that translate platform complexity into business clarity. They understand that successful client reporting isn’t about showing everything TikTok measures – it’s about showing everything clients need to make smart investment decisions.
TikTok Ads Metrics FAQ
Direct answers to the most searched TikTok advertising questions
Complete Payment ROAS is the most important metric because it shows actual money returned for every dollar spent. Unlike regular ROAS, it provides 79% more accuracy by tracking real revenue impact rather than just conversion counts. This directly answers whether your TikTok investment is profitable.
Video Watched 6S counts users who watched your video for at least 6 seconds. It matters because it correlates with purchase intent better than impressions and predicts conversion performance. Aim for 20%+ when you divide Video Watched 6S by impressions – this indicates quality content that resonates with your audience.
TikTok conversion rate = (Total conversions ÷ Total clicks) × 100. Industry averages are 0.8% for food & beverage, 0.46% for e-commerce, and 0.3% for financial services. Low conversion rates often indicate entertainment-focused content that doesn’t drive action.
Reach counts unique users who saw your ad, while impressions count total ad views (including multiple views by the same person). Reach tells you market penetration, impressions show ad frequency. For brand awareness campaigns, focus on reach. For conversion campaigns, impressions matter more.
Yes, profile visits indicate serious brand interest beyond passive ad exposure. Users actively research your company after seeing ads. Calculate Brand Interest Rate: (Profile Visits + Follows) ÷ Reach. Higher percentages indicate strong brand appeal and potential for long-term customer relationships.
Limit primary metrics to 5 that directly impact business decisions. Use the 3-metric priority system: 1 primary business metric (Complete Payment ROAS), 2 performance context metrics (Cost Per Conversion, CTR), and supporting details available on demand. Clients stop reading reports with too many metrics.
Clients care about revenue metrics: Complete Payment ROAS, Total Purchase Value, and Cost Per Conversion. They want simple answers to “Did this work?” and “Should I spend more?” Avoid platform-specific metrics like video completion rates unless they directly impact budget decisions.
TikTok users often see ads, remember brands, but convert later through other channels. TikTok’s 7-day click, 1-day view attribution captures this behavior. Always include view-through attribution in reports because click-only attribution undervalues TikTok conversions by 73%.
You’re likely comparing different attribution windows or missing view-through conversions. TikTok excels at driving awareness that leads to conversions elsewhere. Standardize attribution windows across platforms and include view-through attribution to show TikTok’s true impact.
Create business-relevant calculations: Engagement Cost Efficiency (total engagement ÷ spend), Revenue Per Impression (purchase value ÷ impressions), and Video Quality Score (Video Watched 6S ÷ impressions × 100). These tell clearer stories than individual platform metrics.
Report primary metrics weekly, detailed analysis monthly. Use real-time conversion tracking for quick optimization decisions, but avoid over-reporting daily fluctuations. Clients need consistent performance trends, not minute-by-minute updates that create unnecessary anxiety.
Average CPC is $0.80 for e-commerce. CPM runs higher than Facebook but delivers actively engaged users. Cost per conversion varies by industry: $15 for food & beverage, $25-75 for e-commerce, $75+ for financial services. Budget $20-50 per day minimum for meaningful data.
Food & beverage: 3.5x ROAS (content fits platform culture), E-commerce: 2.5x ROAS (strong awareness, weaker direct conversion), Financial services: 1.2x ROAS (serious messaging conflicts with entertainment focus). Set expectations based on your industry, not cross-platform comparisons.
| Industry | Average ROAS | Conversion Rate | Cost Per Conversion |
|---|---|---|---|
| Food & Beverage | 3.5x | 0.8% | $15 |
| E-commerce | 2.5x | 0.46% | $25-75 |
| Financial Services | 1.2x | 0.3% | $75+ |
TikTok achieves 4x higher engagement than Instagram’s 0.50% average. Food & beverage brands see 16% engagement, financial services see 8%. High engagement without conversions may indicate entertainment value without purchase intent – optimize for business goals, not just engagement.
TikTok has higher CPM and CPC but delivers more engaged users. TikTok excels at awareness and consideration, Facebook at direct response. TikTok users discover brands then convert elsewhere, Facebook users often convert immediately. Use both platforms for different funnel stages.
Industry averages: Food & beverage 0.8%, E-commerce 0.46%, Financial services 0.3%. Conversion rates depend more on audience targeting and landing page experience than creative content. Focus on improving the entire conversion funnel, not just TikTok ads.
Minimum $20-50 per day for meaningful optimization data. Start with $100 daily for established businesses. Scale based on ROAS performance: if achieving 3x+ ROAS, increase budget by 20-50% weekly. Never increase budget more than 50% at once to maintain algorithm stability.
CTR varies widely by industry and campaign type. Focus on trends rather than absolute numbers. Increasing CTR usually indicates better audience targeting and creative resonance. High CTR with low conversions suggests entertainment value without business impact.
Install TikTok Pixel on your website, set up Events API for server-side tracking, and enable Conversions API for iOS 14.5+ compatibility. Test conversion tracking with TikTok’s Event Test Tool before launching campaigns. Proper tracking is essential for accurate ROAS measurement.
Use “Complete Payment” objective for e-commerce sales, “Lead Generation” for B2B businesses, “Traffic” for awareness campaigns. Match campaign objectives to business goals – TikTok’s algorithm optimizes differently based on your chosen objective.
Wait 3-7 days or 50+ conversions before making major changes. TikTok’s algorithm needs time to learn and optimize. Daily micro-adjustments harm performance. Review performance weekly, optimize monthly for best results.
Native-looking content that doesn’t appear overly promotional performs best. Use vertical video format, hook viewers in first 3 seconds, include captions for sound-off viewing, and match platform trends. Entertainment value drives engagement, clear CTAs drive conversions.
Test different audiences, refresh creative content weekly, optimize landing pages for mobile, use spark ads to boost organic content, and align ad creative with platform culture. Poor performance often stems from mismatched audience targeting or overly promotional content.
Start with TikTok’s automatic targeting, then layer in interests and behaviors based on performance data. Lookalike audiences work well for established businesses. Avoid over-targeting – TikTok’s algorithm performs better with broader audiences than hyper-specific segments.
Common causes: audience too narrow, bid too low, creative rejected, or campaign objectives misaligned. Broaden targeting, increase bid by 20-30%, refresh creative content, or switch to automatic bidding. Low spend often indicates targeting constraints.
Your content entertains but doesn’t drive action. Add stronger call-to-actions, test different landing pages, align creative messaging with conversion goals, or adjust audience targeting. Entertainment value doesn’t automatically translate to business results.
Increase budget, broaden audience targeting, refresh creative assets, or adjust bidding strategy. TikTok prioritizes ads with higher engagement potential. Poor delivery often indicates audience saturation or creative fatigue.
Attribution window differences, iOS tracking limitations, and cross-device behavior cause discrepancies. Use TikTok’s attribution data for optimization decisions, Google Analytics for overall business tracking. Focus on trends rather than exact number matches.
Stop guessing with TikTok metrics. Create client dashboards that actually drive decisions with the metrics that matter most.
Build Better TikTok Reports