Pingdom Report

How it works

select template white

1. Select

Choose one of our predefined templates or create your own

connect white

2. Connect

Connect your data sources

customize white

3. Customize

Customize your data to meet your client’s needs

share white

4. Share

Schedule and share a dashboard or PDF report with your team or clients

Choose Swydo's Pingdom Template

Save time, impress clients, and grow your agency with Swydo's automated reporting solutions.

Swydo item

Save Hours
Streamline reporting and reclaim your day.

Swydo item

Actionable Insights
Present key Pingdom report metrics in a way that clients instantly understand.

Swydo item

All-in-One Reporting
Visualize, share, and manage all your Pingdom data from one spot.

Swydo item

Custom Branded Reports
Present clients with tailored, on-brand Pingdom reports.

Swydo item

Agency Mark-up
Set your agency markup once. Flat or percentage & auto-apply.

Swydo item

Win More Business
Impress in pitches with Pingdom reports that showcase your expertise.

Why Your Agency Needs a Pingdom Report Template

As a technical consultant or agency, you want to deliver reliability insights, not format spreadsheets. Save hours tracking website uptime and performance with automated, branded reports that showcase your monitoring expertise.

Every minute spent wrestling with Pingdom data is a minute stolen from optimization. A good Pingdom template turns scattered monitoring metrics into reports clients actually understand.

No more late nights before SLA reviews, no more explaining complex downtime incidents from scratch, just clear insights that showcase your reliability expertise and justify your monitoring fees. This Pingdom report template turns chaotic uptime data into clear, compelling client presentations in minutes, not hours.


What Makes Swydo’s Pingdom Report Template Different?

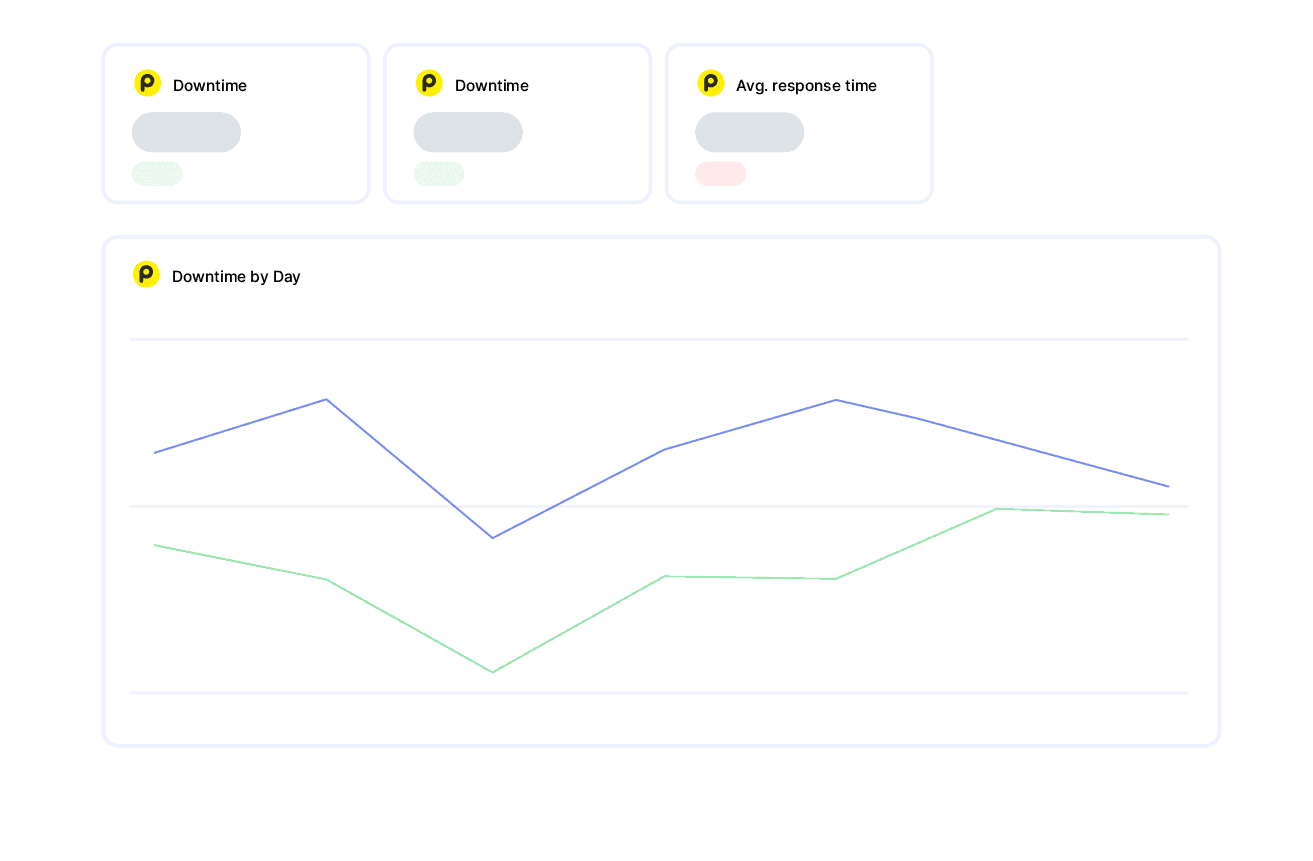
Uptime-Focused Metrics
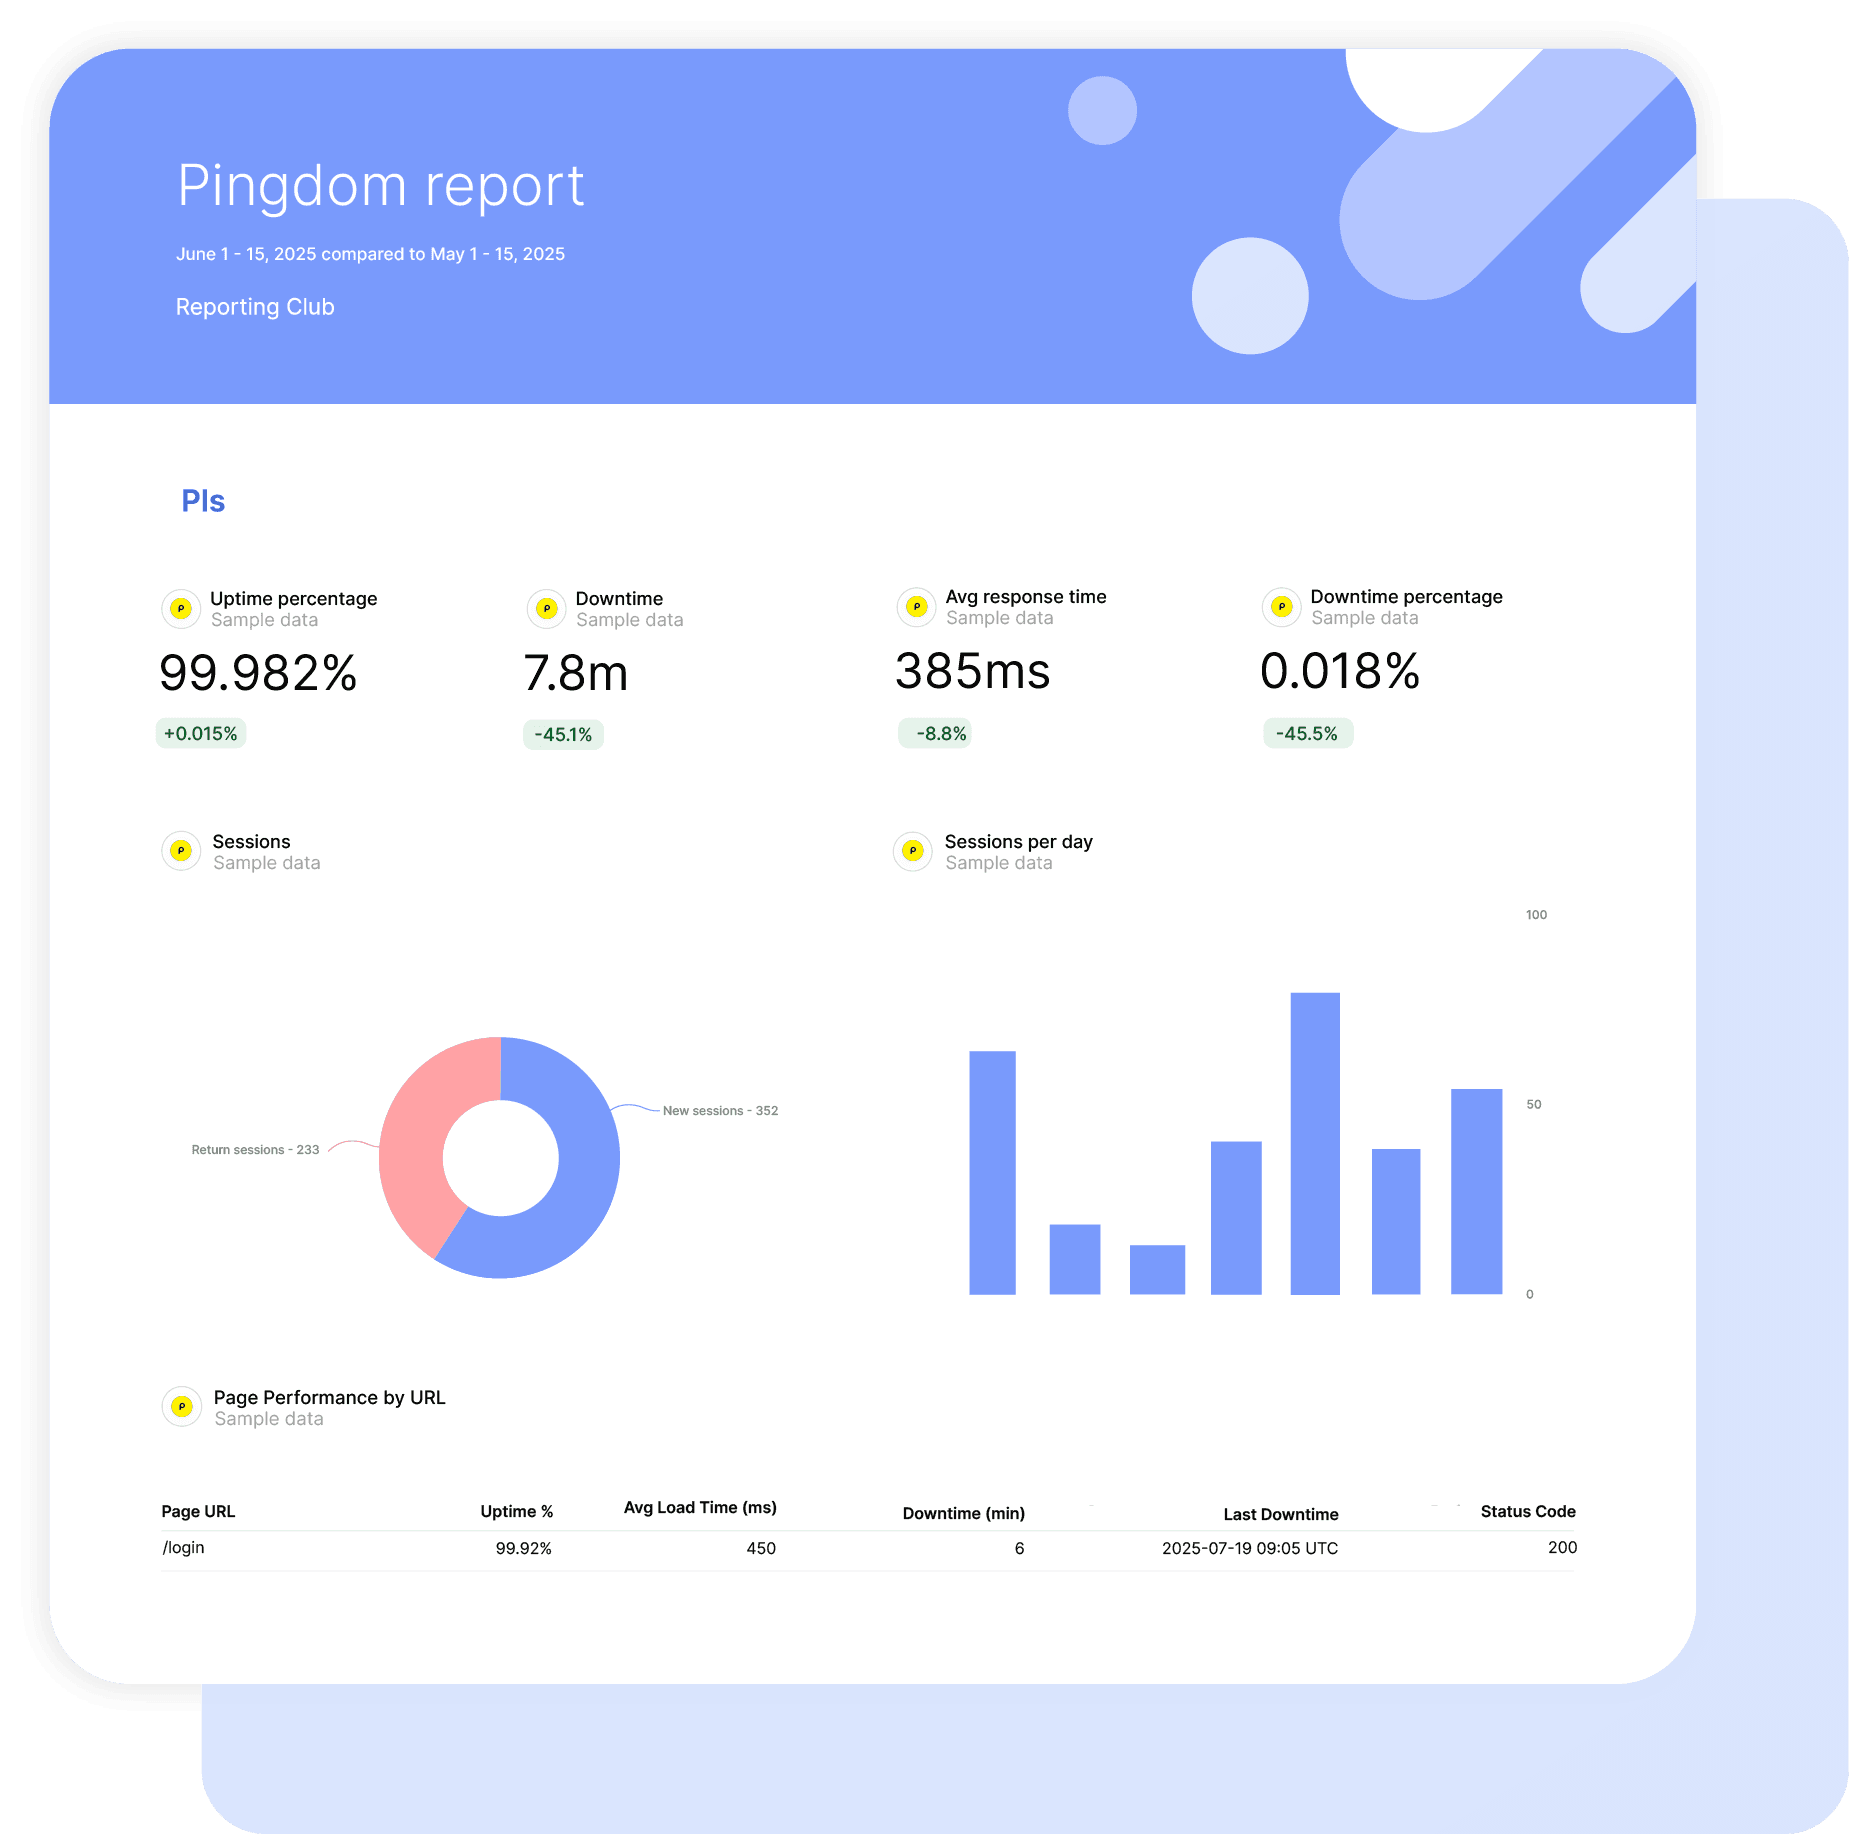
Track the metrics that matter for reliability: uptime percentage, downtime duration, average response time, and outage tracking. No unnecessary complexity—just Pingdom data that demonstrates infrastructure health.

Performance Reliability Focus
Website monitoring isn’t just about up or down. Our template highlights response time patterns, downtime impact, and availability trends that justify your proactive monitoring approach and premium services.

Custom Metric Calculations
Create powerful custom calculations like SLA compliance percentage, cost per minute of downtime, performance consistency scores, and availability improvement rates. Combine Pingdom metrics to tell your unique reliability story.

What To Include In A Pingdom Report Template

Create professional, white-label Pingdom report templates that track critical uptime metrics, deliver actionable reliability insights, and prove infrastructure ROI with precise availability data.

Executive Summary With Availability Performance

What to include in your Pingdom report summary:

  • Uptime % – Overall availability showing SLA compliance at a glance
  • Downtime – Total time offline demonstrating actual business impact
  • Avg. Response Time – Speed consistency showing performance quality beyond availability
  • Outage Status – Period when website or service is completely inaccessible

Perfect for stakeholder presentations and quarterly infrastructure performance reviews.

Core Pingdom Performance Metrics

Foundation metrics every Pingdom report template should track:

  • Uptime % – The percentage of time a website or service is operational
  • Downtime – The time when a website or service is unavailable to users
  • Avg. Response Time – The average time it takes for a server to respond to user requests
  • Outage – A period when a website or service is completely inaccessible

Essential metrics that demonstrate infrastructure health and monitoring effectiveness.

Uptime Percentage Tracking

What to include for availability insights:

  • Current Period Uptime % – This month’s availability percentage against target SLAs
  • Historical Uptime Trends – Week-over-week and month-over-month uptime comparisons
  • SLA Compliance Status – Are you meeting contracted 99.9%, 99.95%, or 99.99% targets?
  • Uptime Goal Progress – Visual progress toward monthly and quarterly availability objectives

Show exactly how your infrastructure performs against contracted reliability standards.

Downtime Tracking & Analysis

Downtime metrics for Pingdom report templates:

  • Downtime by Day – Daily breakdown showing when unavailability occurred for pattern identification
  • Total Downtime – Cumulative offline time showing actual unavailability impact
  • Downtime Trend Analysis – Is downtime increasing, decreasing, or remaining stable?
  • Acceptable Downtime Remaining – How many minutes left before SLA breach?

Demonstrate where reliability issues occur and track improvement over time.

Response Time Performance

Performance speed metrics to include:

  • Avg. Response Time by Day – Daily speed trends showing performance consistency over time
  • Avg. Response Time by Hour – Hourly breakdown identifying peak load periods and vulnerability windows
  • Response Time vs. Baseline – Compare current speed to historical averages
  • Performance Consistency – Stable response times indicate healthy infrastructure

Show infrastructure performance quality beyond simple up/down status.

Outage Tracking

Complete unavailability monitoring:

  • Outage Status – Track periods when website or service is completely inaccessible
  • Outage Frequency – How often complete outages occur vs. partial degradation
  • Outage Duration – Length of time service is completely down
  • Outage Impact – Business cost of complete service unavailability

Essential for understanding severity of incidents beyond simple downtime metrics.

Custom Pingdom Metrics & Calculations

Powerful custom metrics you can create:

  • SLA Compliance Rate – (Uptime % ÷ Target SLA) × 100 for contract performance
  • Cost Per Minute Down – (Downtime × Revenue Per Minute) for business impact reporting
  • Performance Consistency Score – Response time variance showing infrastructure stability
  • Availability Improvement – Month-over-month uptime gains demonstrating infrastructure ROI

Combine Pingdom metrics to create powerful insights unique to your client’s reliability requirements.

Strategic Recommendations & Next Steps

What every Pingdom report template needs for action:

  • Uptime Optimization – Reduce downtime and outages with infrastructure improvements
  • Response Time Enhancement – Improve average response time through performance tuning
  • SLA Management – Stay ahead of contract requirements with proactive monitoring
  • Reliability Investment – Justify infrastructure spending with downtime cost analysis

Position your agency as an infrastructure reliability expert with data-driven optimization strategies.

CUSTOMIZATION

Customize Your Pingdom Report

FiltersLeverage a variety of filters to show more specific data points to quickly identify issues and take swift action.

SchedulingAutomate and share your dashboards and reports on a schedule that best meets your needs.

White labelReflect your brand by incorporating your logo and brand colors into your reports. You can also use your domain to share and send your reports.

GoalsSet and track goals to gain insight into performance, trends and progress toward your goals.

Custom MetricCombine two metrics from the same data source to calculate an entirely new custom metric.

Multi-language reportsCreate reports for your clients in 14 available languages through our automatic and editable translation feature.

Report DesignResizable widgets allow you to adjust the presentation of KPIs, charts, tables, text, and images to focus clients on key data and insights.

Text and ImagesProvide context to clients or stakeholders through descriptive text widgets. Incorporate images, such as ad assets, to improve client communication and understanding.

Flexible Date RangesEasily compare data across different time periods. Fully control the date range of your overall reports or specific KPIs, charts, and tables to highlight trends.

See all features
SEO Report Templates

Choose a template, connect your ad accounts, and deliver professional SEO reports in minutes.

Connect With Your Favorite Data Sources

Easily Connect & Integrate Data in a Single Report

FAQ

Frequently Asked Questions

  • Can I move my existing Pingdom reports to Swydo?

    Yes. If you’re switching from another reporting tool you don’t have to rebuild everything by hand. Swydo’s migration service recreates your existing client reports and dashboards inside Swydo, so your team keeps its layouts and clients see no disruption. Connect your Pingdom data, hand over your current reports, and pick up where you left off. See the migration service →

  • Can I white-label Pingdom reports with my agency's branding?

    Yes. Add your logo, brand colors and fonts, then host live dashboards on your own domain (reports.youragency.com) and verify your sending domain so scheduled reports arrive from your brand with no “via Swydo” tag. Dashboards can be password-protected, the Send Log shows which clients opened and clicked each report, and you can embed Crisp chat in a client dashboard so questions get answered in context. See white-label features →

  • Is my Pingdom data secure, and is Swydo GDPR-compliant?

    Yes. Swydo connects through OAuth wherever the platform supports it, and scoped API keys for Klaviyo, CallRail, CallTrackingMetrics and ActiveCampaign, so you only share the access you authorize and can revoke it at any time. Swydo is GDPR-compliant, your data stays yours and is never used to train AI models, and you can switch on two-factor authentication for every sign-in. Deleted reports stay recoverable for 90 days and archived clients for 365 days. Read our data privacy and security details →

  • What does Swydo cost after the free trial, and can I pause or cancel?

    The 14-day trial needs no credit card. Plans start at $69/month and include 10 data sources, Additional data sources cost $2–$4.50 each, and the per-source rate drops as you scale — no per-client fees, no per-user fees, and unlimited seats. Reporting frequency never changes the price. If you hit a quiet stretch you can pause your subscription for $10/month and reactivate when you need it, and you can cancel any time with no auto-renewal trap. See full pricing → or book a 15-minute pricing walkthrough →

  • What should a Pingdom report include?

    A Pingdom report should prove the site stays up and responsive. Include uptime percentage, downtime incidents and duration, and average response time, broken down by check or location. For clients who care about reliability, uptime and response time are the headline numbers.

  • What Pingdom metrics can I track in Swydo?

    Swydo reports Pingdom uptime percentage, outage and downtime metrics, and response time across your checks. Custom metrics let you track an uptime-SLA KPI. See all integrations →

  • How often should I send Pingdom reports?

    Monthly fits most reliability reporting, with a live dashboard for ops-sensitive clients who want to see uptime in real time. See scheduling →

  • How do I set up and automate a Pingdom report?

    About 10 minutes — connect Pingdom with your API key, choose the checks, and load the template. It refreshes on schedule, then sends itself. Free for 14 days, no credit card required. Start your free trial →

  • Can I combine Pingdom with PageSpeed and traffic data?

    Yes. Pair Pingdom uptime with PageSpeed and GA4 in a site-health report so clients see availability, speed and traffic together. Pingdom sits in its own section rather than the Combined Data Sources widget. See all integrations →

Client testimonials

Discover Why Over 2,500 Agencies Trust Swydo


View all customer stories

Create your free online marketing report in minutes

Free for 14 days, no credit card required, cancel at any time

Request a demo ▶ Get started