Web Analytics Report

Web Analytics Report Template

Swydo’s pre-built Web Analytics report template turns site behaviour and conversion data into a clear, executive-ready dashboard.

Track audience growth, engagement quality, and conversion performance from all traffic sources in one automated view that actually gets attention.

Ideal for agencies and marketers who want to: show real website impact, link campaigns to measurable business results, and cut the time wasted building manual analytics reports.

Data sources Google Analytics 4
Preview ▶ Get started

Free for 14 days

No credit card required

Cancel anytime

Web Analytics Report

How it works

select template white

1. Select

Choose one of our predefined templates or create your own

connect white

2. Connect

Connect your data sources

customize white

3. Customize

Customize your data to meet your client’s needs

share white

4. Share

Schedule and share a dashboard or PDF report with your team or clients

Choose Swydo's Web Analytics Template

Save time, impress clients, and grow your agency with Swydo's automated reporting solutions.

Swydo item

Save Hours
Streamline reporting and reclaim your day.

Swydo item

Actionable Insights
Present key web analytics metrics in a way that clients instantly understand.

Swydo item

All-in-One Reporting
Visualize, share, and manage all your web analytics data from one spot.

Swydo item

Custom Branded Reports
Present clients with tailored, on-brand web analytics reports.

Swydo item

Agency Mark-up
Set your agency markup once. Flat or percentage & auto-apply.

Swydo item

Win More Business
Impress in pitches with web analytics reports that showcase your expertise.

Why Your Agency Needs a Web Analytics Report Template

As a marketer, you want to drive results, not format spreadsheets. Save hours tracking website performance with automated, branded reports that prove ROI to clients.

Every minute spent wrestling with Google Analytics data is a minute stolen from optimization. A good web analytics template turns scattered website metrics into client-ready insights they actually care about.

No more late nights before client calls, no more explaining why traffic dropped last month, just clear data that proves your value and keeps retainers flowing. This web analytics report template gets you from raw GA4 data to polished client presentation in minutes, not hours.


What Makes Swydo’s Web Analytics Report Template Different?

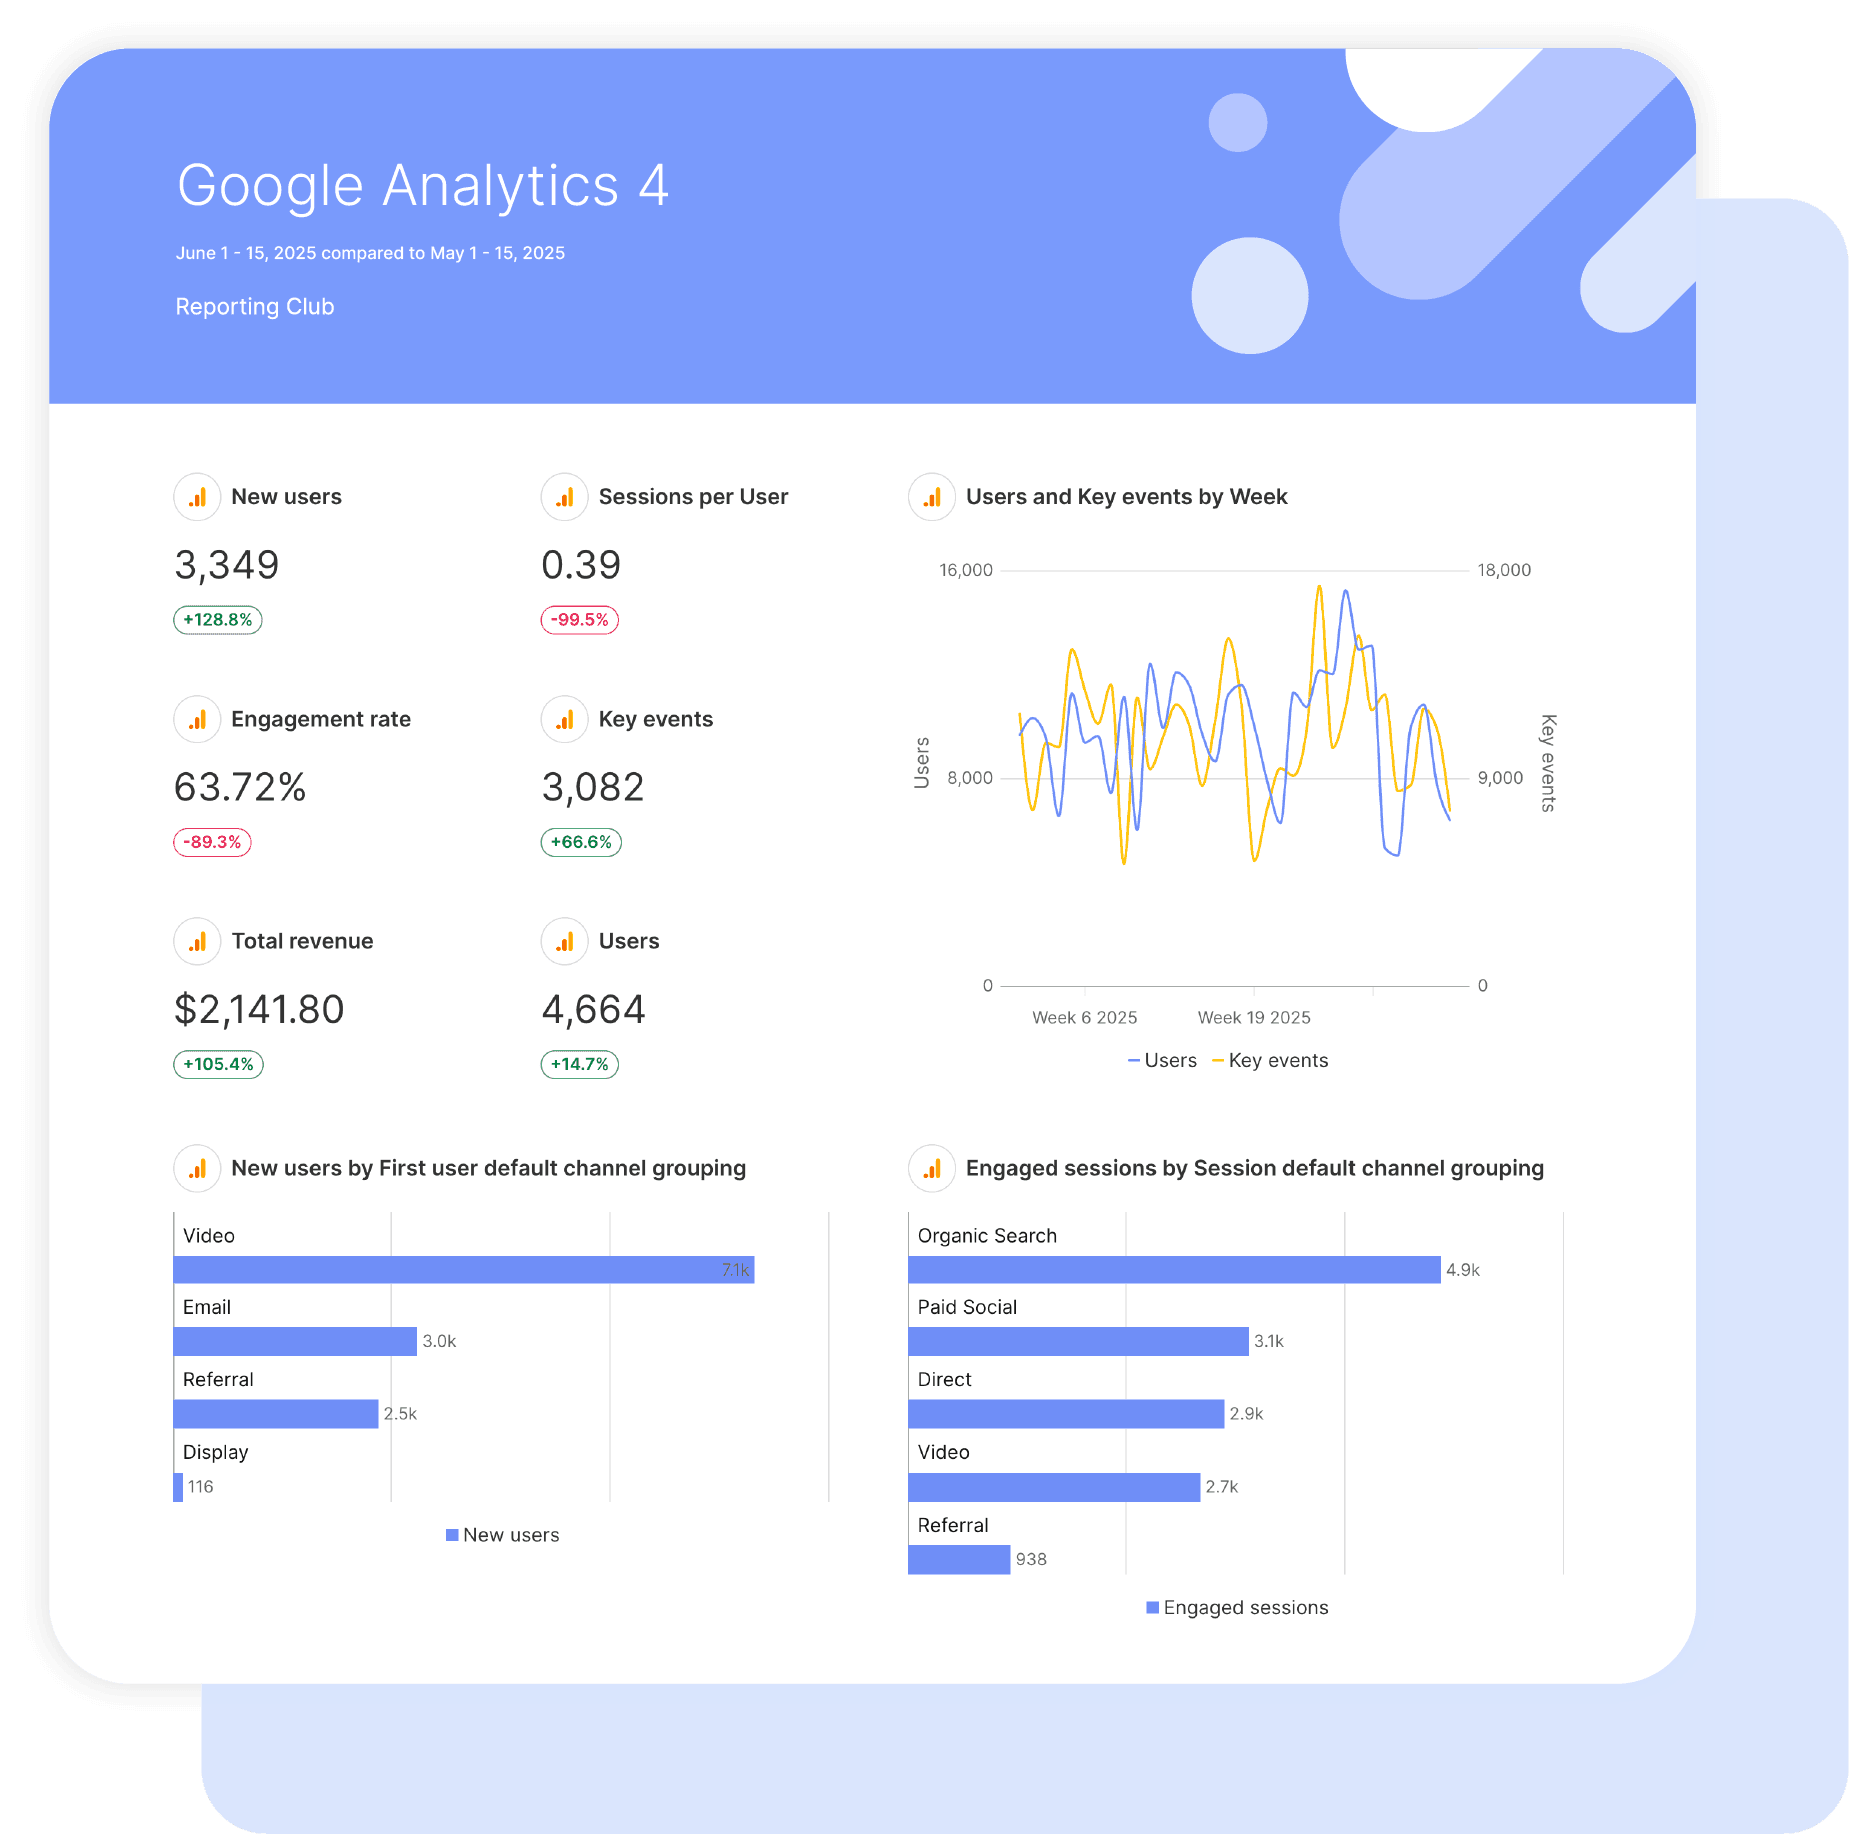
GA4-Ready Out of the Box
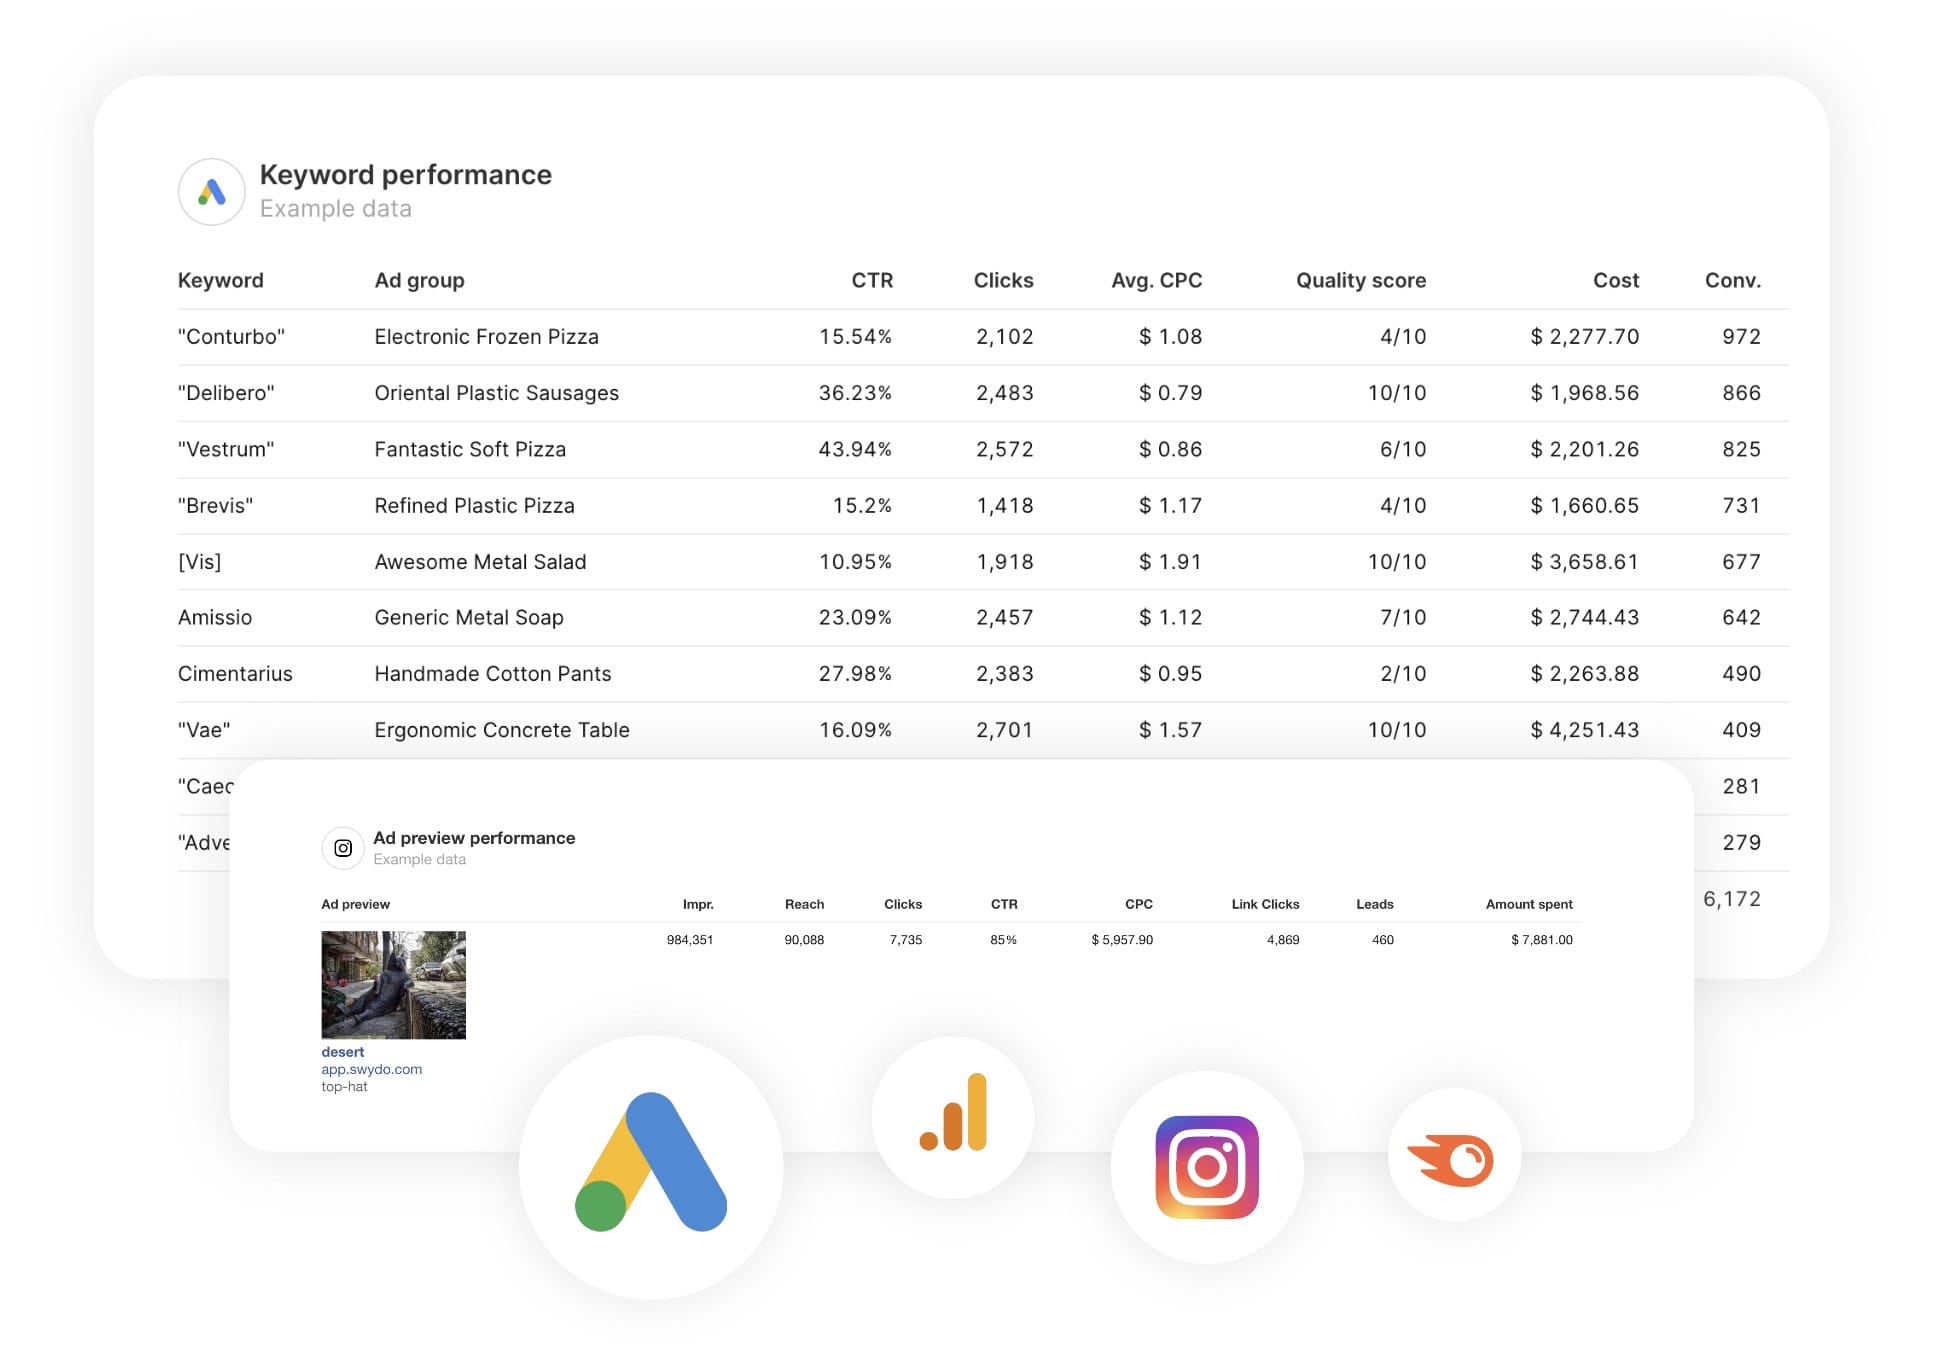
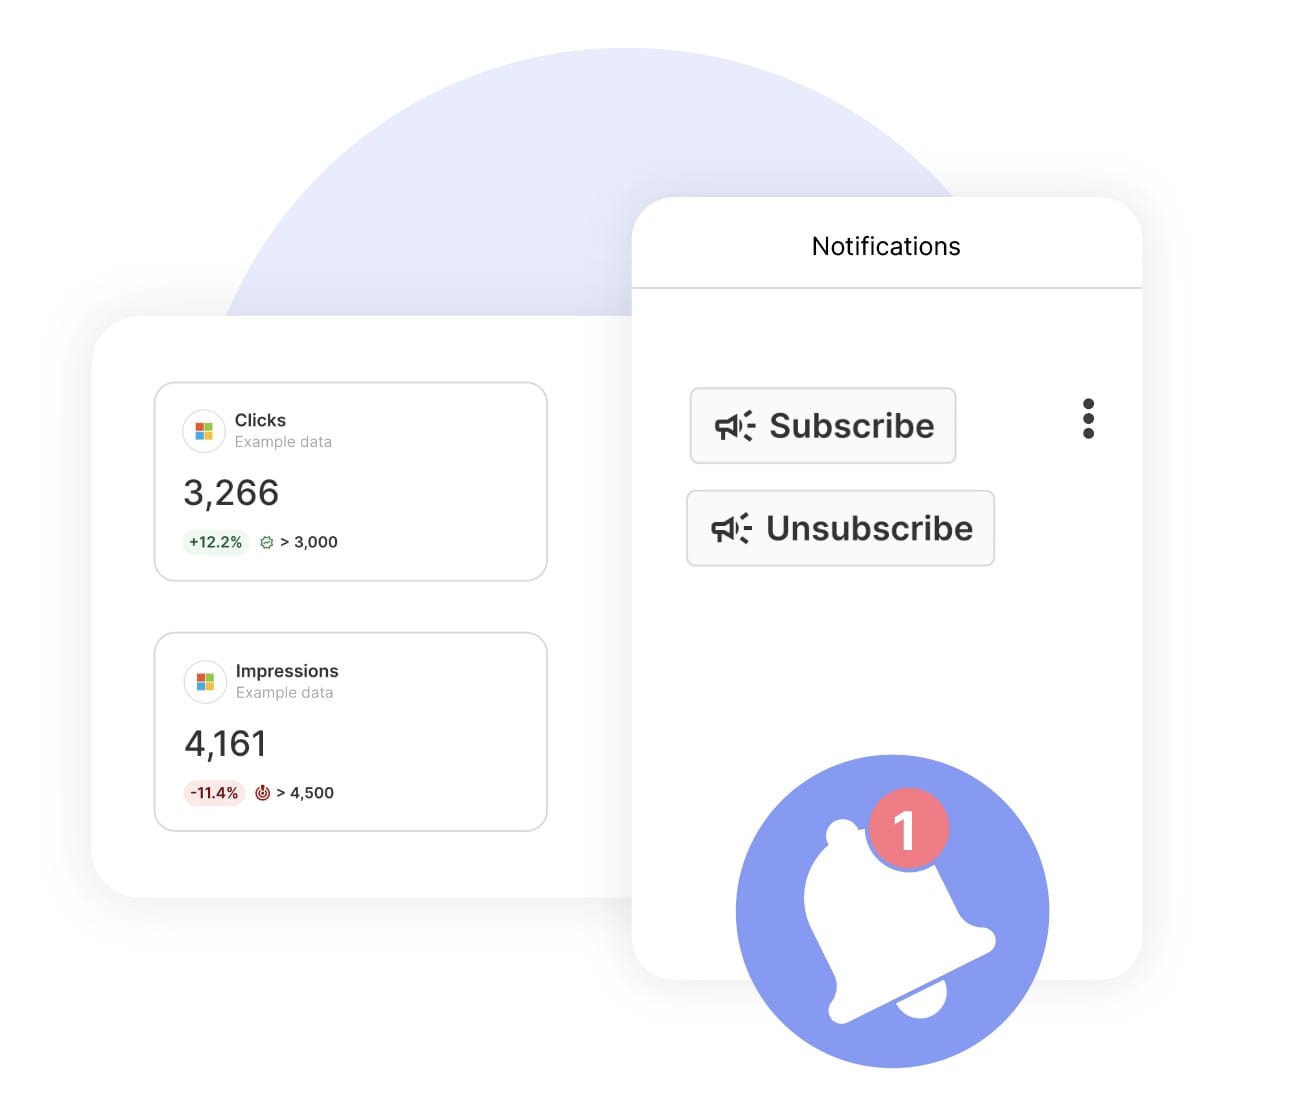
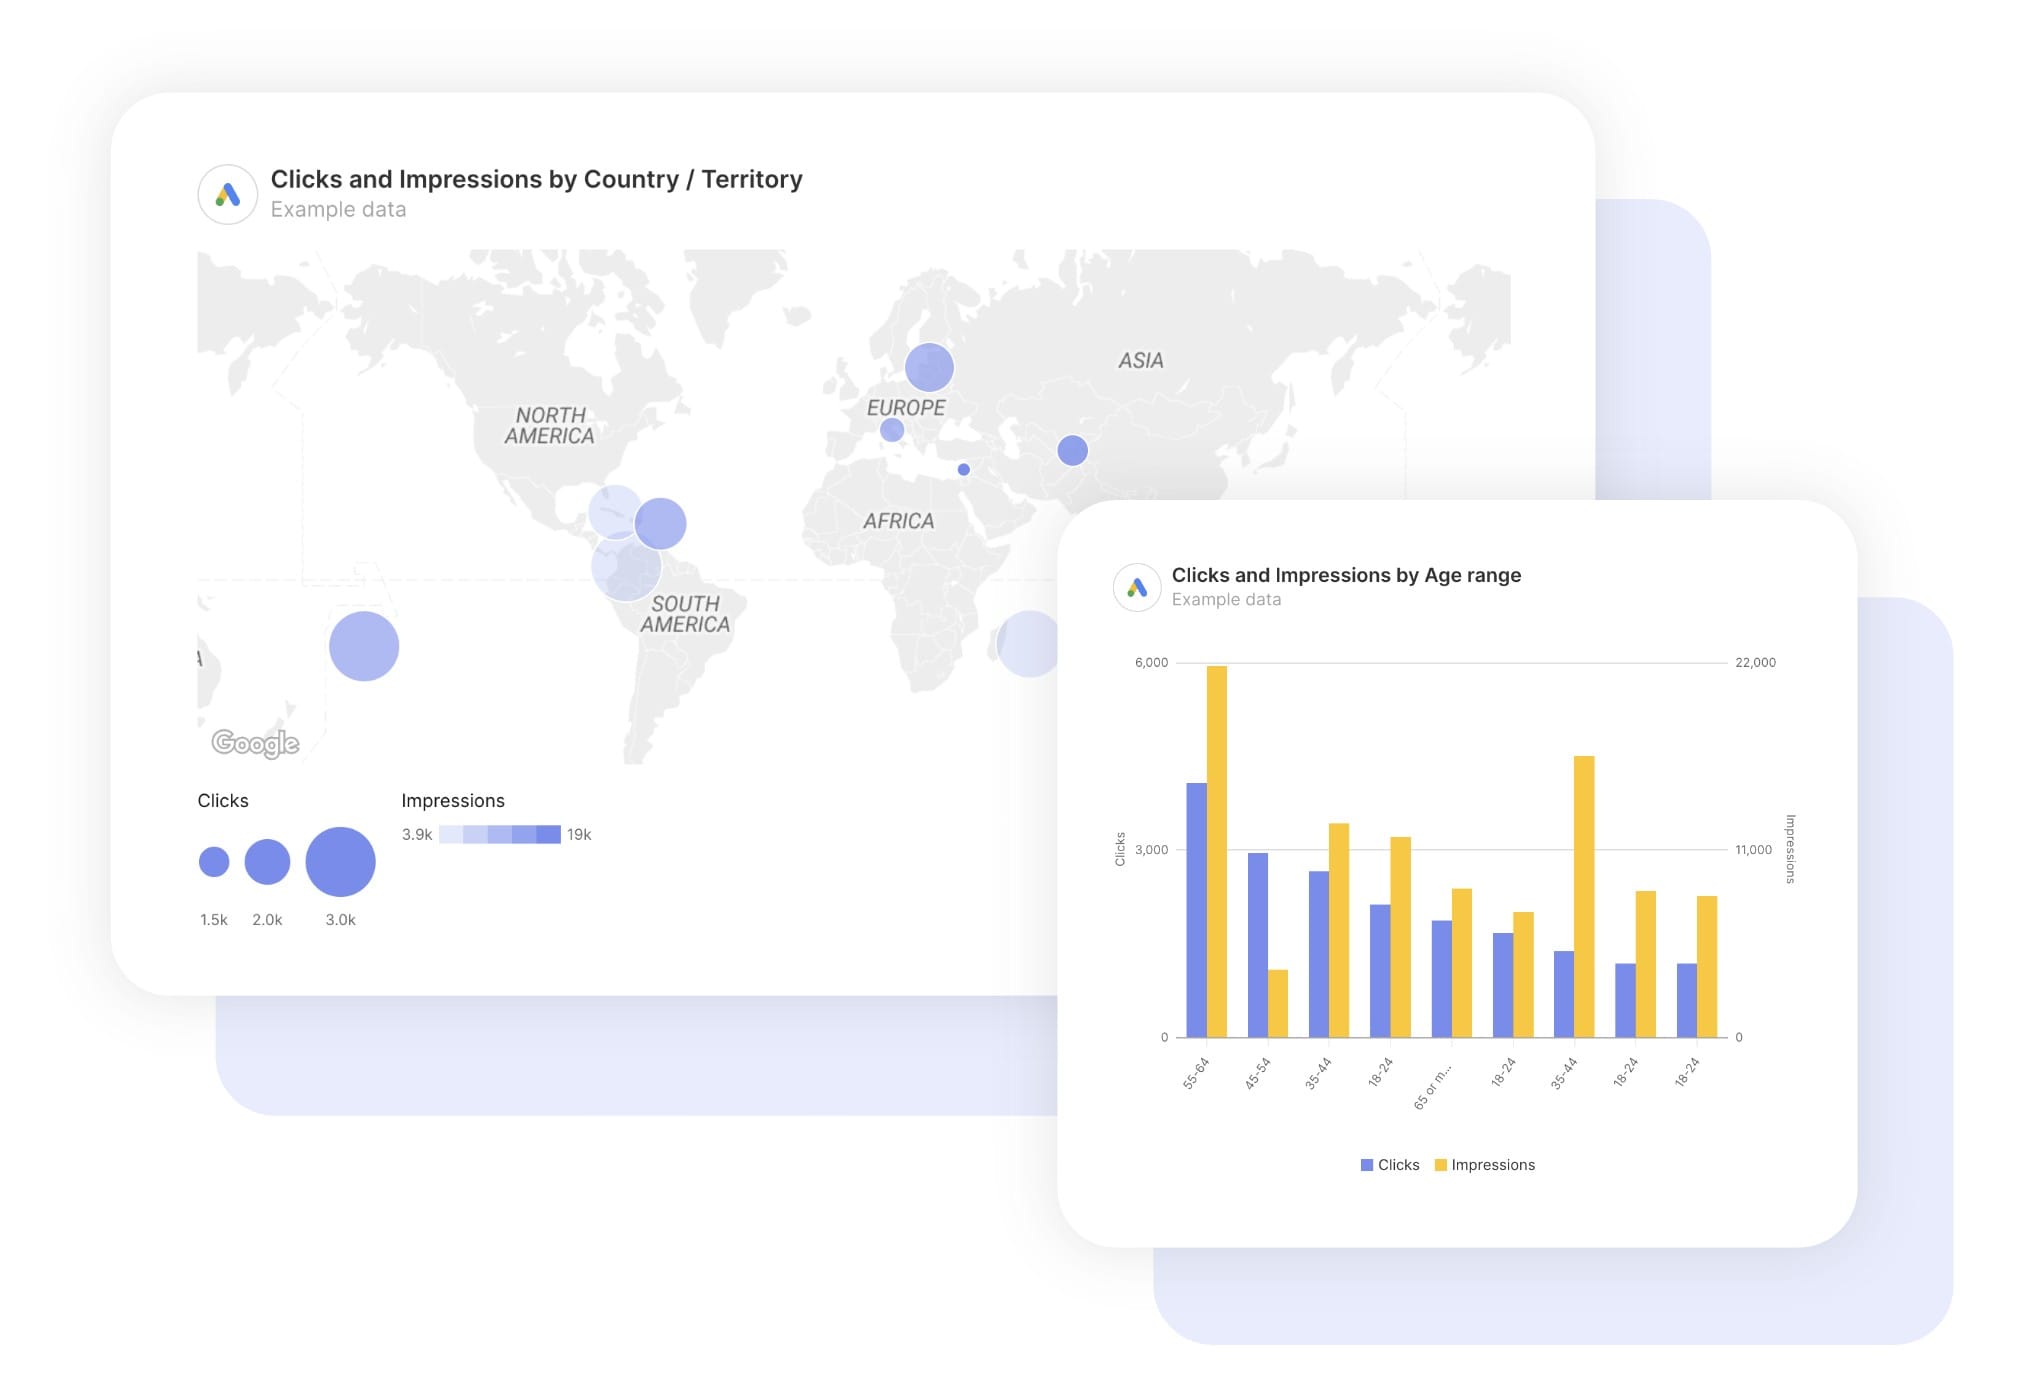
Track what actually moves the needle: user engagement, traffic sources, conversion rates, and visitor behavior. No fluff metrics, just what clients pay you to improve.

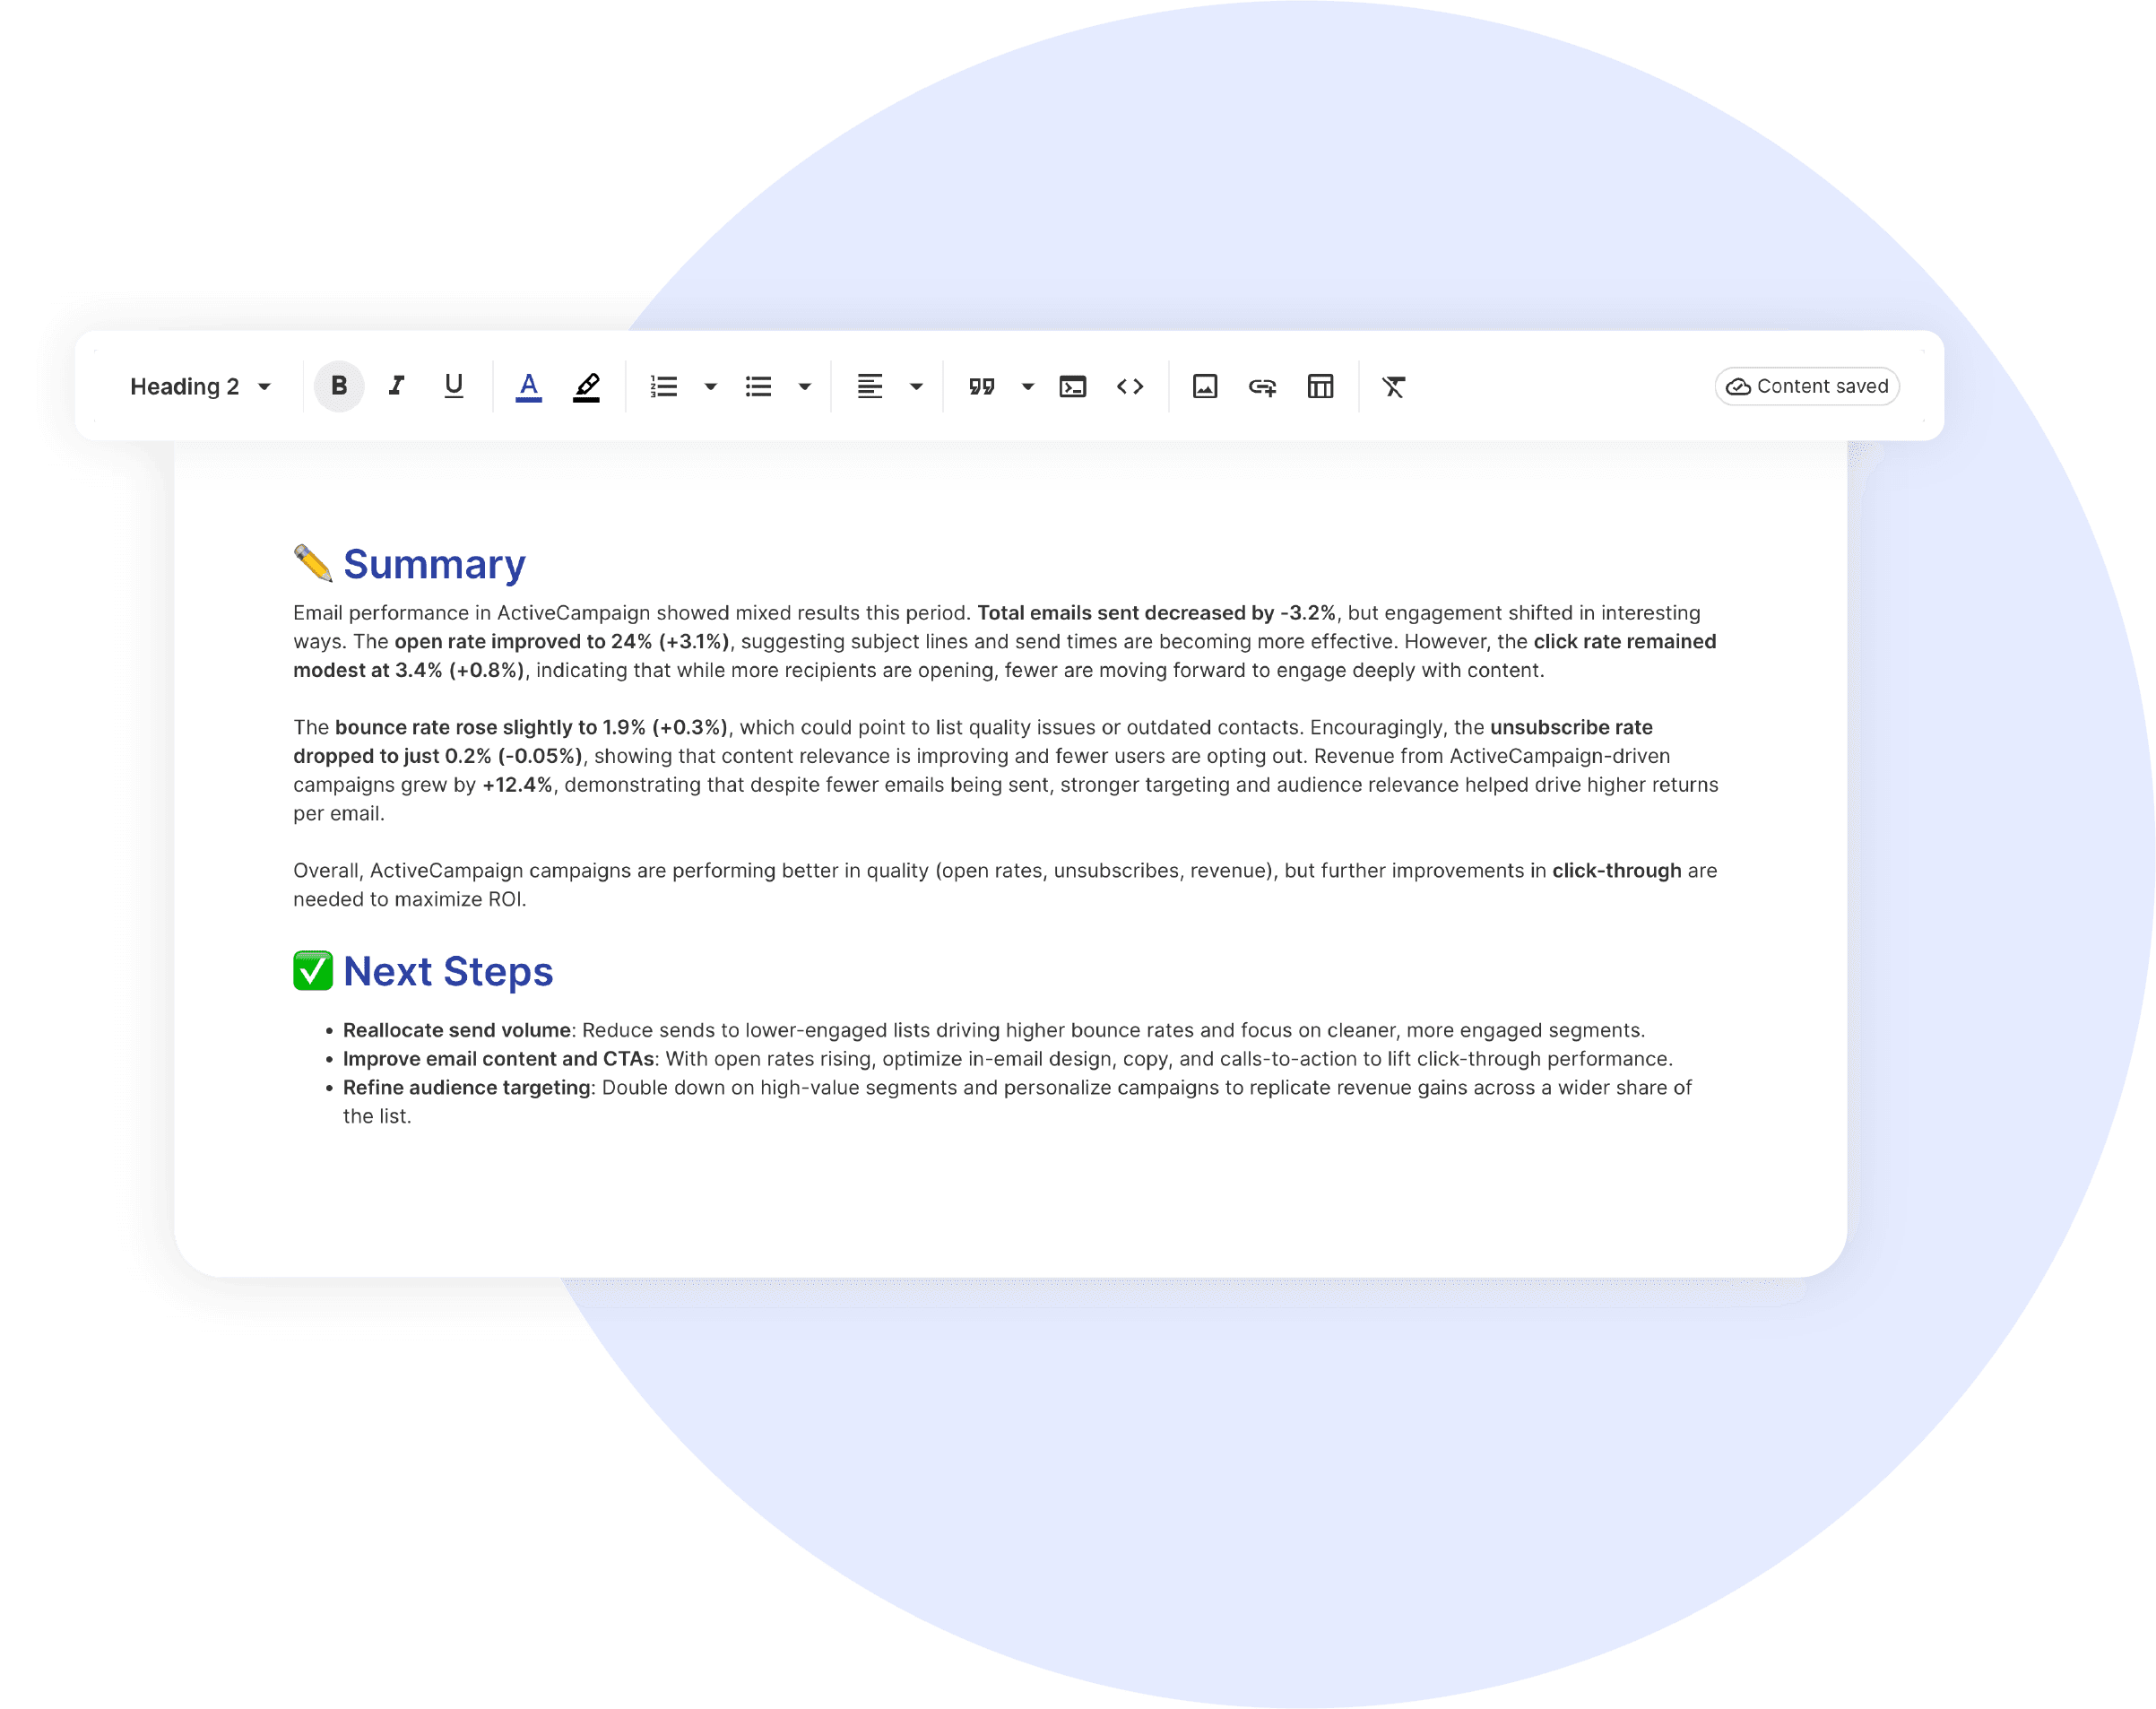
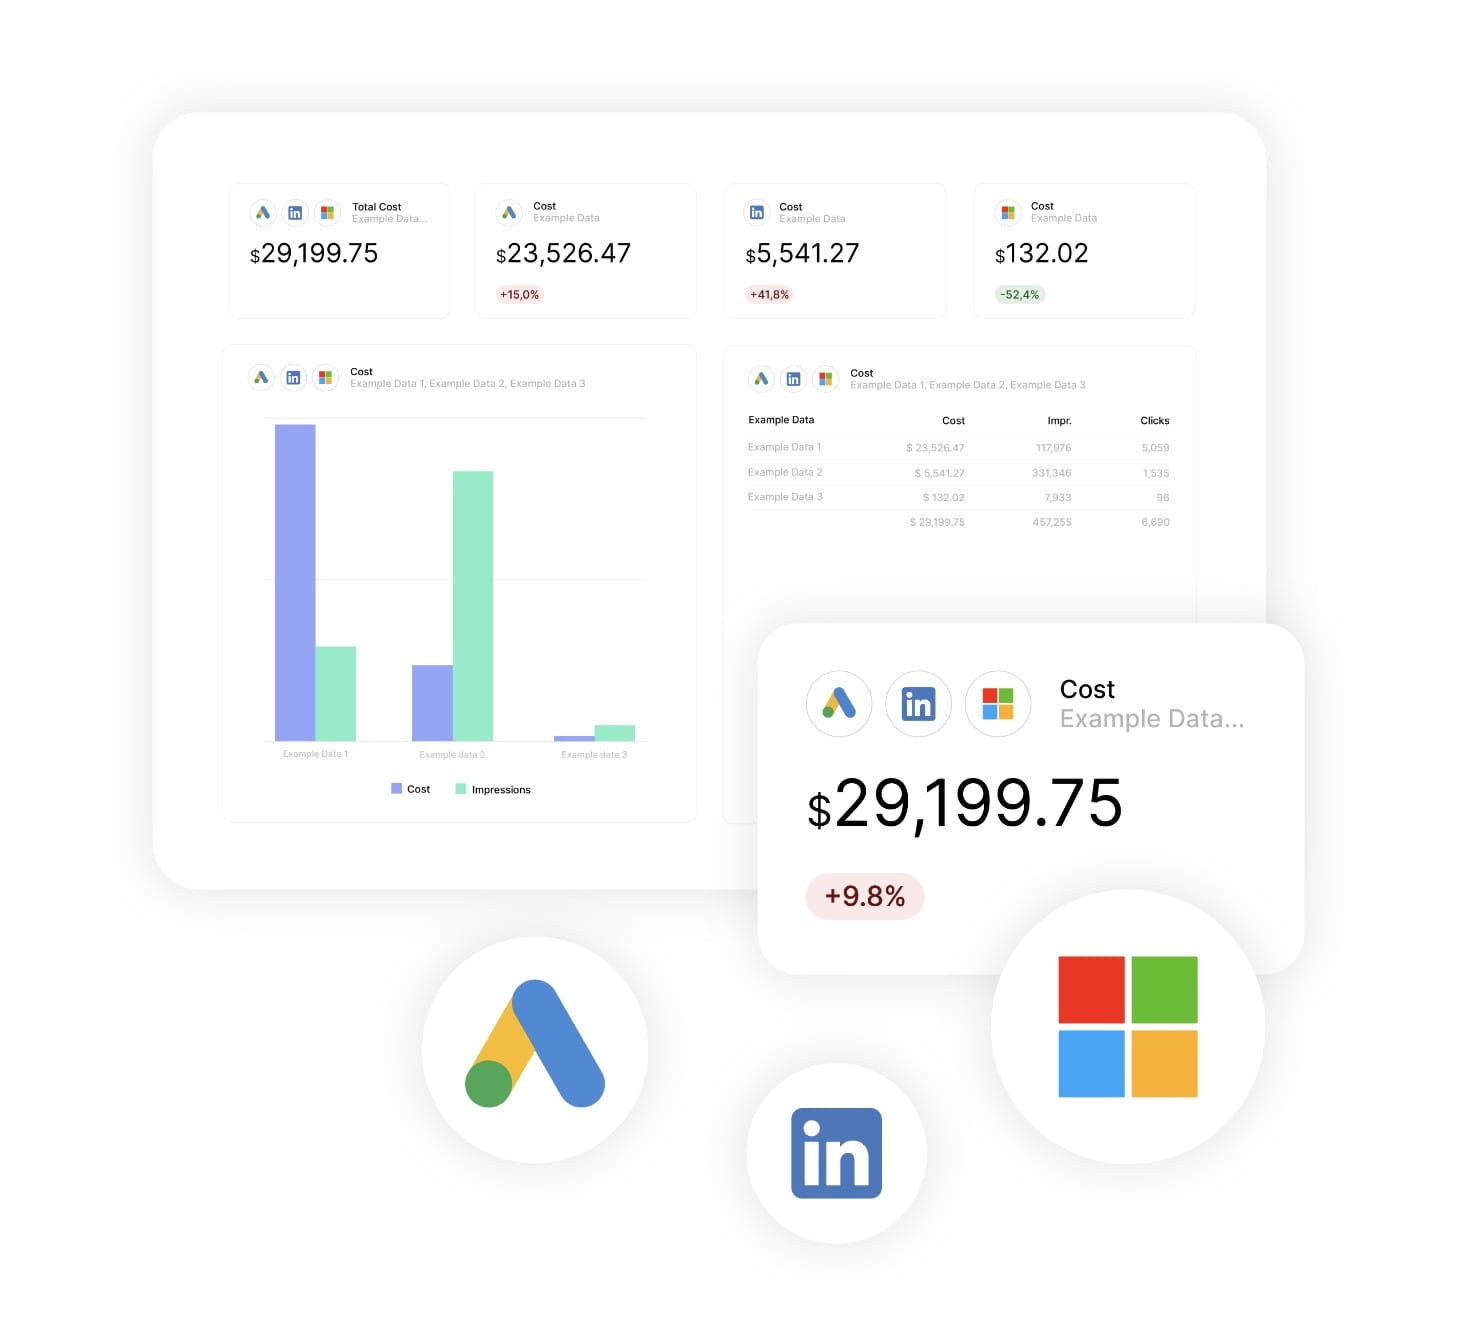
Revenue-First Reporting
Pageviews don’t pay bills. Our template surfaces the numbers that justify your monthly retainer and prove campaign impact.

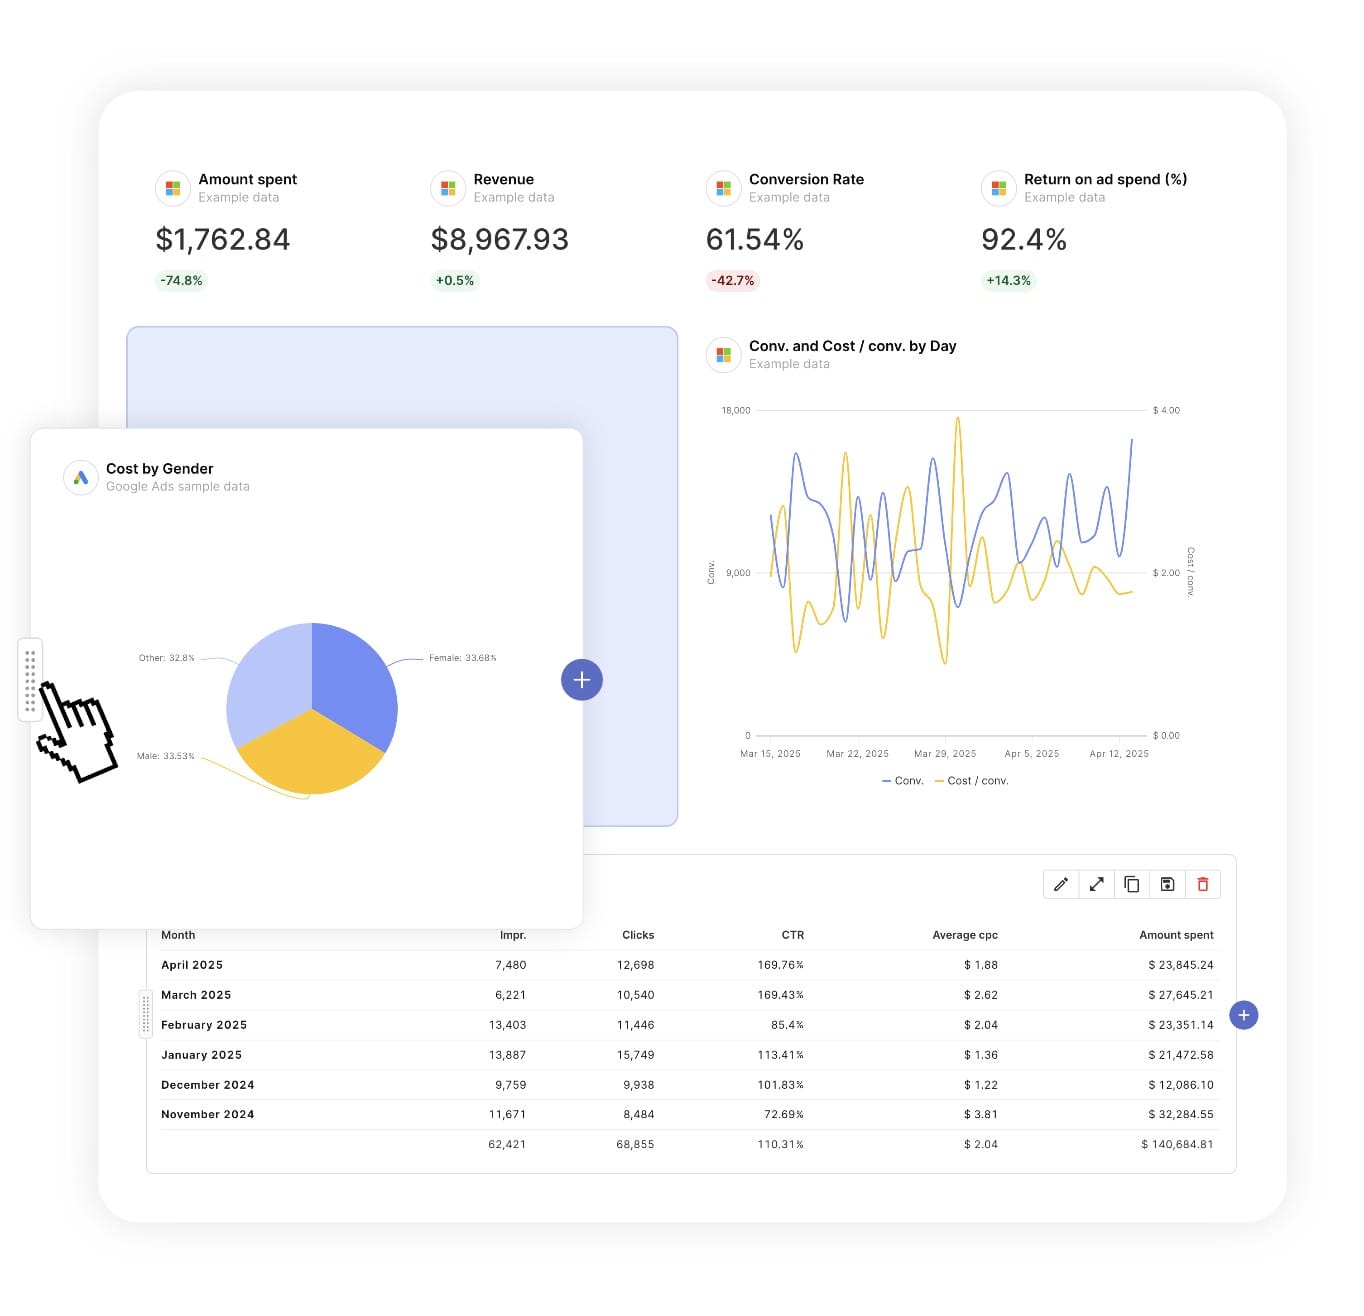
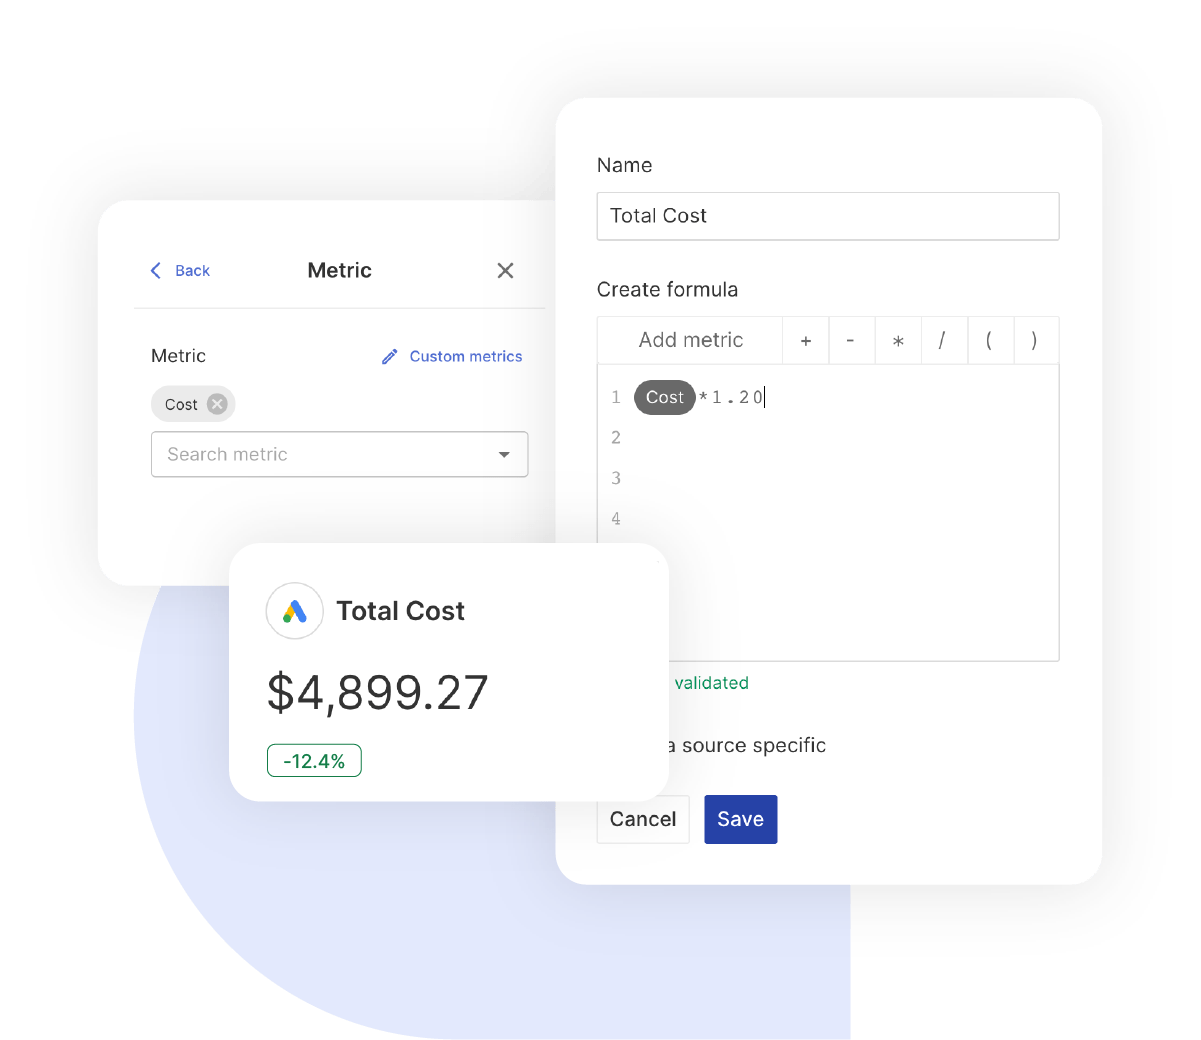
Custom Calculations Built In
Calculate engagement quality scores, traffic value, and conversion efficiency. Mix any metrics to show exactly what your agency delivers month over month.


What To Include In A Web Analytics Report

Build white-label web analytics reports that demonstrate campaign impact, justify marketing spend, and position your agency as the data expert in the room.

Executive Dashboard That Actually Gets Read

Start with the numbers that matter the most:

  • Total Users & New Users – Proof that the audience is growing rather than plateauing.
  • Conversion Rate – Shows how many visitors take meaningful action instead of just browsing.
  • Engagement Rate – Clear indicator of visitor quality and on-site interaction, finally replacing the outdated bounce rate obsession.
  • Average Engagement Duration – Demonstrates whether your content keeps people on the site long enough to matter.

Perfect for monthly retainers and quarterly reviews when you need fast ROI clarity.

Core Traffic & Engagement Metrics

The foundational numbers every report needs:

  • Active Users & Sessions – Real visitor counts that cut out bot noise and inflated traffic.
  • Sessions Per User – Evidence of habit formation and repeat engagement over time.
  • New Users vs. Returning Users – Clear balance between growth and loyalty within your audience.
  • Engagement Duration Per Active User – How long quality visitors truly spend with the brand.

Baseline metrics that prove traffic quality rather than empty volume—what clients actually need.

Traffic Source Breakdown & Channel Performance

Show them where the visitors come from:

  • Session Medium & Session Campaign Name – Reveal which campaigns deliver real results instead of vanity traffic.
  • Session Source Analysis – Organic, direct, referral, and social broken down with actual conversion context.
  • First User Campaign Name – Identify what originally brought visitors in for meaningful attribution.
  • Organic Google Search Clicks & Impressions – SEO data proving that rankings directly drive traffic.
  • Organic Google Search Click Through Rate – A single number showing how well your pages win clicks in the SERP.

Justify budget allocation with channel-level performance—shift spend to winners and cut the dead weight.

User Behavior & Content Performance

Prove your content strategy works:

  • Screen Page Views & Screen Page Views Per Session – Measure how deeply users consume your content across the site.
  • Scrolled Users – Identify who actually reads your content instead of bouncing after the hero.
  • Event Count & Events Per Session – Track real interactions: button clicks, video plays, downloads, form activity.
  • Engagement Duration Per Session – Average active interaction time that shows content quality and user intent.

Show which content drives engagement, which pages need fixing, and where to double down.

Conversion & Goal Tracking

The metrics that tie back to business goals:

  • Conversions & Conversion Rate – Goal completions aligned with the outcomes clients actually care about.
  • Event Value – Dollar values assigned to actions such as form fills, downloads, sign-ups, or key interactions.
  • Session Conversion Rate – The percentage of visits that result in a meaningful action.
  • User Conversion Rate – The share of unique visitors who convert, counting each converter once.

Demonstrate your optimisation efforts are pushing the metrics that matter most.

Custom Metrics Your Competitors Aren’t Showing

Build calculations that prove your unique value:

  • Engagement Quality Score – (Engaged Sessions ÷ Total Sessions) × 100 to measure actual traffic quality.
  • Content Effectiveness Rate – Pages per session × average engagement duration to quantify content performance.
  • Traffic Value Score – Session conversion rate × event value to rank channels by business impact.
  • Visitor Loyalty Index – Returning users ÷ total users to track audience retention strength.

Calculate the KPIs your clients genuinely care about and establish yourself as the agency that understands their business.

Month-Over-Month Comparison & Trend Analysis

Show progress, not just snapshots:

  • New Users Growth Rate – Demonstrate audience acquisition is scaling rather than plateauing.
  • Engagement Rate Trends – Prove content improvements are increasing audience interaction over time.
  • Conversion Rate Progress – Highlight steady gains from ongoing optimisation efforts.
  • Session Growth vs. User Growth – Show repeat visit increases, not just one-time traffic spikes.

Use trend data to build trust, demonstrate consistent improvement, and surface issues before clients spot them.

Strategic Recommendations Section

Every report needs clear next steps:

  • Traffic Source Optimization – Scale high-converting channels and repair underperforming acquisition paths.
  • Content Strategy Adjustments – Prioritise topics that earn strong scroll depth and long engagement time.
  • Conversion Rate Optimisation Plays – Targeted fixes for pages, forms, and calls-to-action with specific tests to run.
  • Technical Performance Fixes – Resolve speed issues, mobile layout failures, and tracking gaps that suppress results.

End every report with 3–5 actionable steps so clients see insight turning into execution.

CUSTOMIZATION

Customize Your Web Analytics Report

FiltersLeverage a variety of filters to show more specific data points to quickly identify issues and take swift action.

SchedulingAutomate and share your dashboards and reports on a schedule that best meets your needs.

White labelReflect your brand by incorporating your logo and brand colors into your reports. You can also use your domain to share and send your reports.

GoalsSet and track goals to gain insight into performance, trends and progress toward your goals.

Custom MetricCombine two metrics from the same data source to calculate an entirely new custom metric.

Multi-language reportsCreate reports for your clients in 14 available languages through our automatic and editable translation feature.

Report DesignResizable widgets allow you to adjust the presentation of KPIs, charts, tables, text, and images to focus clients on key data and insights.

Text and ImagesProvide context to clients or stakeholders through descriptive text widgets. Incorporate images, such as ad assets, to improve client communication and understanding.

Flexible Date RangesEasily compare data across different time periods. Fully control the date range of your overall reports or specific KPIs, charts, and tables to highlight trends.

See all features
SEO & Analytics Report Templates

Choose a template, connect your ad accounts, and deliver professional SEO reports in minutes.

Connect With Your Favorite Data Sources

Easily Connect & Integrate Data in a Single Report

FAQ

Frequently Asked Questions

  • What is a Web Analytics report template?

    A Web Analytics report template is a pre-built report that automatically pulls user, engagement, and conversion data from your analytics platform. It showcases key metrics such as total users, conversion rate, engagement quality, and on-site behaviour… presented in a clear, professional layout suited for monthly retainers and quarterly ROI reviews.

  • How long does it take to set up a Web Analytics report?

    Setup takes 10 minutes: choose a template, connect ad accounts, and customize with your branding for a professional report.

  • Can I white-label Web Analytics reports with my agency's branding?

    Yes, add your logo, colors, and host reports on your domain (e.g., reports.youragency.com) for a seamless, professional client experience.

  • Which ad platforms are supported?

    Swydo integrates with 35+ platforms, including LinkedIn Ads, Facebook Ads, and Google Ads, allowing you to build consistent, multi-platform reports with real-time performance insights.

  • What's the cost after the free trial?

    Plans start at $69/month for 10 data sources, with no per-client fees. Additional sources cost $2–$4.50 each. Learn more.

Client testimonials

Discover Why Over 2,500 Agencies Trust Swydo


View all customer stories

Create your free online marketing report in minutes

Free for 14 days, no credit card required, cancel at any time

Request a demo ▶ Get started