Reporting Ninja’s cheapest plan is $20 a month. Whether the tool you replace it with costs less than that or ten times more comes down to one number most comparison posts never print.
The decision turns on two things, and the sticker price is neither. The first is your billing unit: whether a tool charges per client, per data source, per dashboard, or a flat rate, because that sets how fast your bill grows as you add clients and connect accounts. The second is how much of your week the tool spends babysitting dashboards, the cost that never appears on a pricing page.
The nine alternatives worth an agency’s time are Swydo, AgencyAnalytics, DashThis, Whatagraph, Databox, Data Studio, Klipfolio, Supermetrics, and NinjaCat. Which one is right depends on those two things, not on who advertises the lowest entry price.
Full disclosure: Swydo is our tool, so read this with the skepticism you’d bring to any company ranking a list it appears on. Where another tool fits your agency better, this says so.
Here’s the order. First a quick note on which “Ninja” you’re actually comparing, then how the five billing models play out at your agency size, then the nine tools with current pricing and honest trade-offs, and a five-question decision guide at the end.
Is Reporting Ninja the Same as NinjaCat or Ninja Reports
No. Three different products share the “Ninja” name, and review sites mix them up constantly, so it’s worth getting straight before you compare anything.
- Reporting Ninja (reportingninja.com) is the tool this article is about: a PPC-focused reporting platform out of Madrid that builds custom reports, connects Google Ads, Meta, Microsoft Advertising, GA4 and more, and doubles as a connector for Looker Studio and Google Sheets.
- Ninja Reports is a completely unrelated SEO-audit tool. It runs on-page crawls and site audits. Different company, different job.
- NinjaCat (ninjacat.io) is an enterprise agency-reporting platform with 100+ integrations and a managed, full-service setup built for large agencies and media companies.
Search “Reporting Ninja” and land on glowing reviews of an SEO crawler or an enterprise suite with white-glove onboarding, and you were reading about a different product. Keep the three straight as you weigh your options.
NinjaCat earns a place on this list in its own right as the enterprise pick, and it’s covered below.
How to Pick the Right Reporting Tool for Your Agency
The tool that fits your agency is the one whose billing unit grows slowest for your mix of clients and data sources. Almost no comparison post says that out loud.
Reporting tools charge in one of five ways. Once you can name the model a tool uses, you can predict what it costs you at 5 clients, 20 clients, and 50 clients before you start a trial.
- Per client. A flat rate for each client you report on. AgencyAnalytics works this way. Your bill tracks client count, not channel complexity.
- Per data source. You pay for each connected account. One Google Ads account, one GA4 property, one Meta page each count as a source. Swydo and Databox use this. Your bill tracks how many accounts you connect.
- Per dashboard. You pay for the number of report views you build. DashThis and Klipfolio price this way. Your bill tracks how many separate reports you keep alive.
- Source credits. You spend credits to connect and blend sources. Whatagraph runs on this. It’s a close cousin of per-source, with blending folded into the unit.
- Flat with account caps. One price covers everything up to a ceiling of accounts per platform. Reporting Ninja sits here. Predictable, as long as you stay under the cap.
Run the same agency through two of these models and the cheaper tool flips depending on your shape.
Scenario A. A paid-media shop. Five clients, each running six ad accounts. That’s 30 data sources but only 5 clients. A per-client tool bills you for 5 units. A per-source tool bills you for 30. Per-client wins.
Scenario B. An SEO agency with 40 clients, each needing one GA4 property and one Search Console account. That’s 80 sources against 40 clients. At roughly $20 a client, the per-client model runs about $800 a month. A per-source tool, with a base plan that covers the first chunk of sources and a rate that drops as you scale, lands far lower. Per-source wins.
The Billing Unit Test
One question decides your real cost
Every reporting tool charges you in one of five ways. Which unit multiplies fastest for your mix of clients and accounts? Pick the tool whose unit grows slowest for your shape, not the one with the lowest sticker price.
Per client
AgencyAnalytics
Per data source
Swydo, Databox
Per dashboard
DashThis, Klipfolio
Source credits
Whatagraph
Flat + account caps
Reporting Ninja
Scenario A · Paid-media shop
5 clients × 6 ad accounts each = 30 data sources
Per-client wins. Few clients, many accounts each, so you’re billed for 5 units, not 30.
Scenario B · SEO agency
40 clients × 2 sources each = 80 data sources
Per-source wins. Many clients, few accounts each, so a discounted per-source scale beats per-client math.
Same two tools, opposite winners. The deciding factor is your ratio of clients to data sources, not the headline price. The per-client figure uses AgencyAnalytics Core at its $20 annual per-client rate; the per-source figure uses Swydo’s $69 base with 10 sources included and a volume-discounted scale. Illustrative, so run your own counts.
That flips the winner between the same two tools, decided by your ratio of clients to sources rather than the sticker price, so count both before you choose.
One more distinction, since the pricing models lean on it. A dashboard is a live, always-current view clients log into. A report is a snapshot you schedule and send. Some tools charge by one, some by the other, so knowing which you actually deliver decides which billing model treats you best.
Reporting Ninja Alternatives at a Glance
Two price columns, so you’re comparing like for like on the same billing basis. The “Bills you by” column is what really drives your cost as your agency grows.
| Tool | Bills you by | Billed monthly | Billed yearly (per mo) | White-label | Best for |
|---|---|---|---|---|---|
| Swydo | Data source10 included | $69/mo | $62/mo | Base plan | Predictable pricing + monitoring |
| AgencyAnalytics | Client | $25/client | $20/client | Base plan | Widest agency feature set |
| DashThis | Dashboard3 included | $54/mo | $44/mo | All plans | Fast templates + support |
| Whatagraph | Source credits | Annual only | $812/mo | Max plan | Best-looking reports |
| Databox | Data source3 included | $99/mo | $79/mo | Premium / add-on | Internal KPI monitoring |
| Data Studio | Freeconnectors extra | Free | Free | Not built in | Free, Google-stack teams |
| Klipfolio | Dashboard | Not confirmed | Not confirmed | Add-on | Deep custom control |
| Supermetrics | Destination | $49/mo | $39/mo | N/A (pipeline) | Feeding your own dashboards |
| NinjaCat | Custom quote | Custom | Custom | Included | Large / enterprise agencies |
Entry-plan starting prices, USD. Yearly figures show the per-month equivalent when billed annually. Whatagraph bills annually only, with no monthly option. Databox and Data Studio each offer a free tier. Klipfolio’s current pricing isn’t confirmed. Confirm pricing before purchase.
1. Swydo
Best for predictable pricing and cutting the daily dashboard grind at scale.
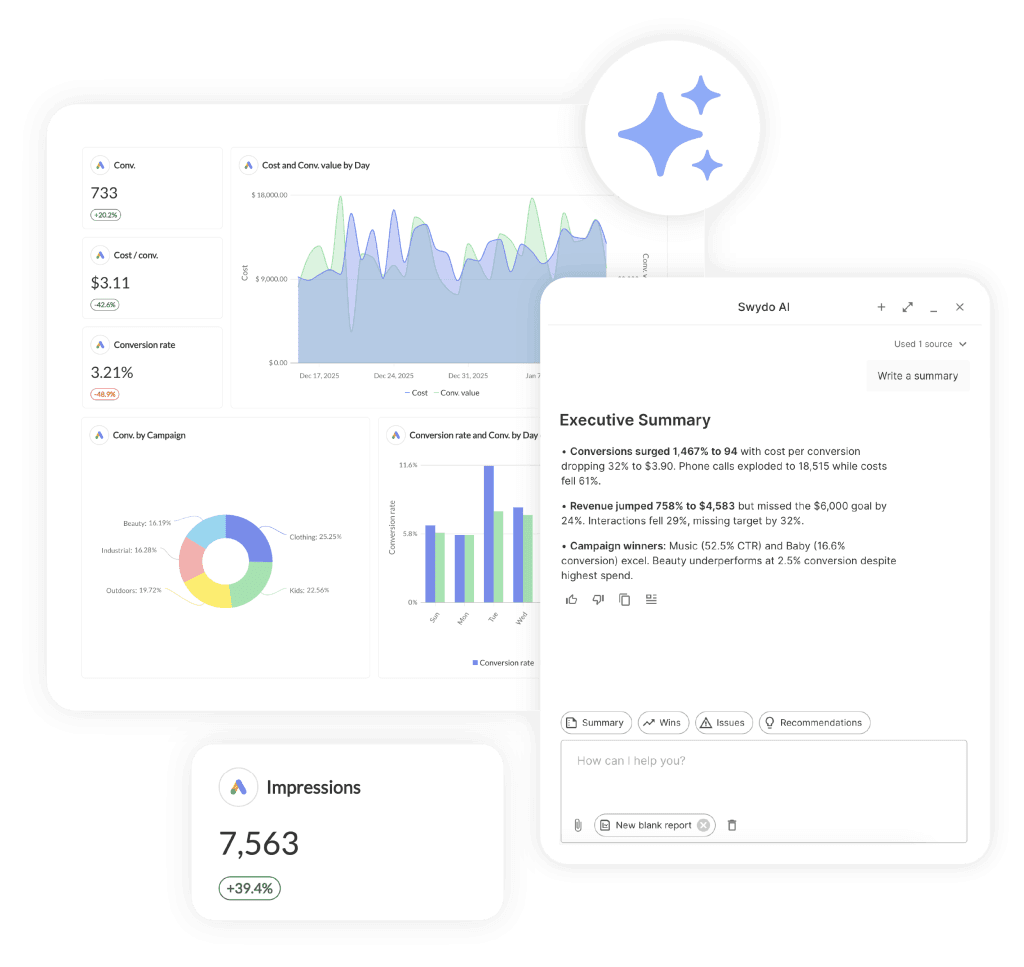
The short case: flat, predictable pricing, white-labeling on the first plan rather than a premium tier, and a daily workflow built to run whether you manage five clients or fifty.
Pricing. Plans open at $69/month, or $62 billed annually, covering 10 data sources plus unlimited clients, users, and reports, with every feature and white-labeling in the base rate. Past 10 sources, each one carries a fixed fee that drops as your volume grows, and the published calculator puts 600 sources at $1,514/month. You pay for active data sources, never for seats, so adding an analyst or a client login costs nothing.
What stands out. Swydo turns the manual Monday routine into a workflow.
- Metrics Overview puts the key metrics for every client on one screen, so you’re not opening a dozen dashboards to see who’s up and who’s down.
- Goals measure each client against their targets.
- Alerts notify you when a metric spikes or drops, before your client notices.
- Data Health Check flags a broken data source before a scheduled report goes out with a hole in it.
At five clients that saves an hour; at fifty it saves the morning, which is what pulls agencies off Looker Studio and the rest.
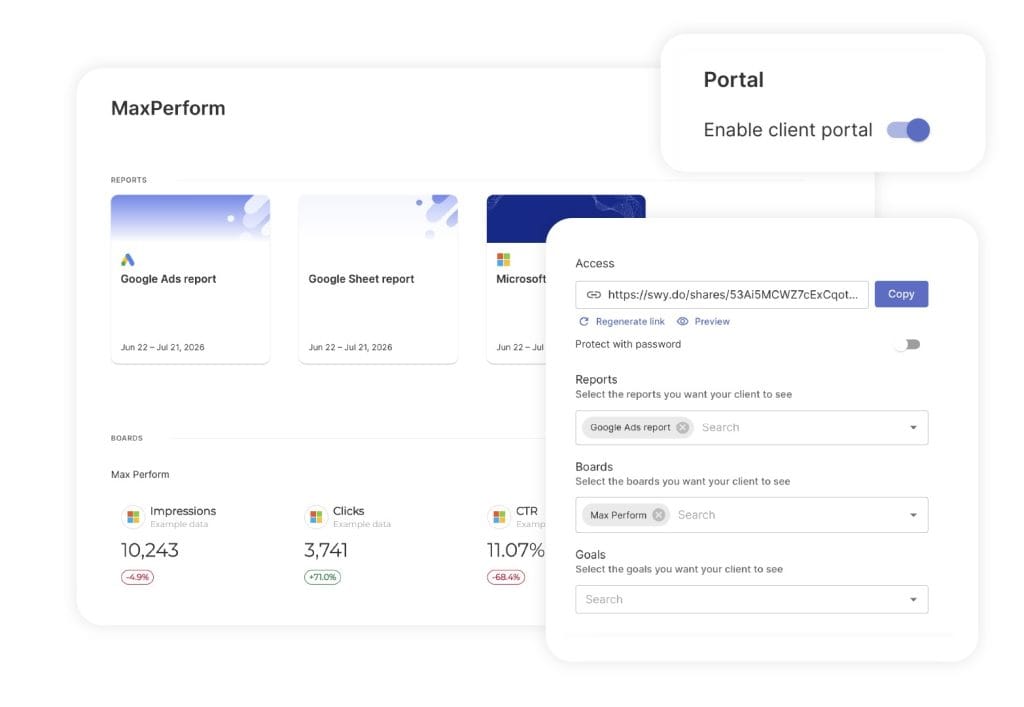
Three more pieces matter at scale. The new Client Portal gives each client one secure, branded link that combines their Reports, Boards, and Goals, with a password and a link you can regenerate to revoke access when an engagement ends.
Swydo AI now builds and edits reports from a plain-language prompt, writes the client summary, and lets you save prompts to reuse across clients, so a new hire’s first report matches your house style.
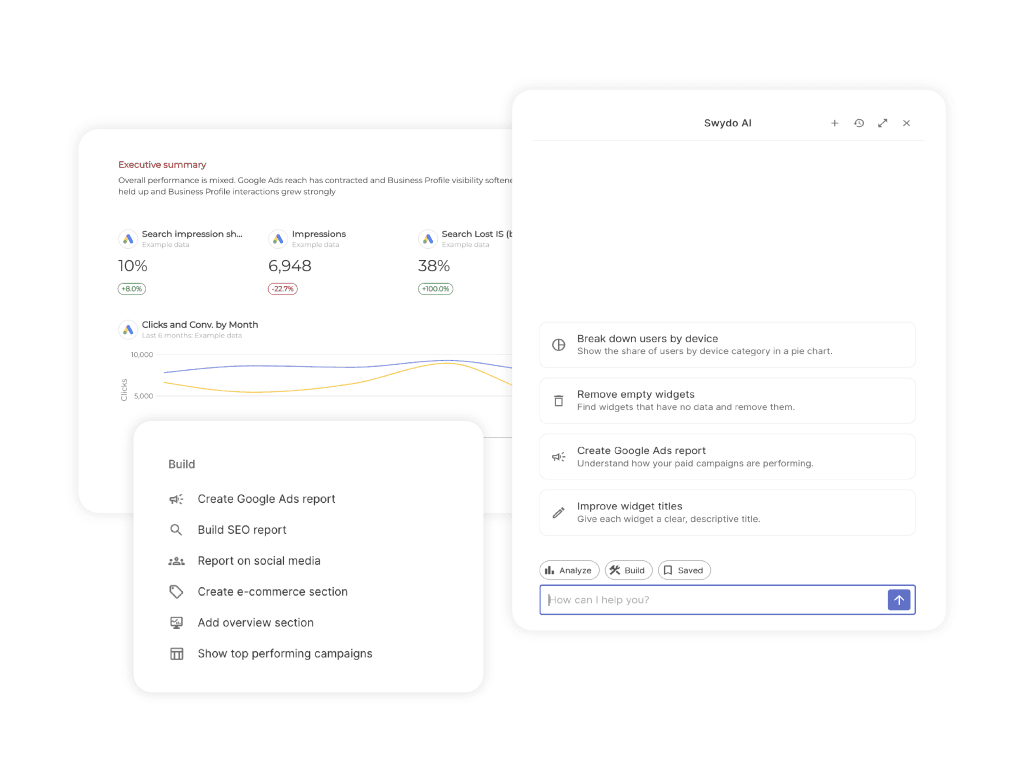
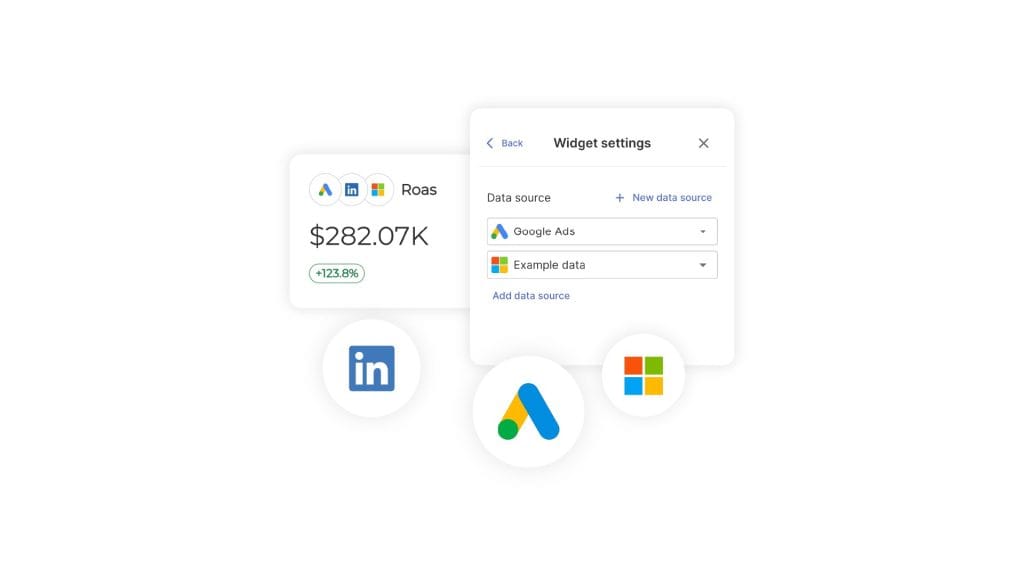
And Combined Data Sources blends up to five ad platforms into one widget for cross-channel ROAS, spend, and revenue. All of it runs on 38+ native integrations, with more added regularly.
Watch out. There’s no public REST API, so custom data piping runs through Google Sheets with Zapier or Make. There’s no free tier once the trial ends. And custom metrics don’t yet work inside Combined Data Sources widgets. If a programmable API is a hard requirement, Reporting Ninja has one and Swydo doesn’t.
From $69/month ($62 annually), 10 data sources included, unlimited users · 14-day free trial, no credit card · free migration · Swydo
2. AgencyAnalytics
Best for the widest agency feature set with simple per-client pricing.
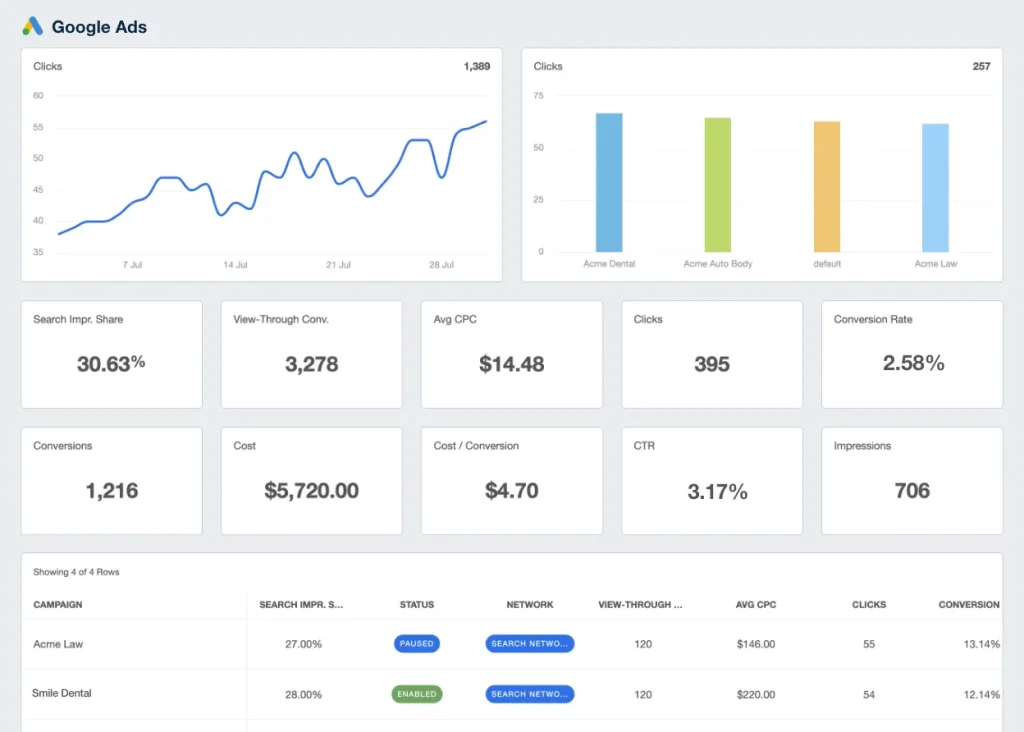
AgencyAnalytics is a feature-heavy platform, with a large integration library at 80+ connectors and a 4.7/5 rating on G2. The thing to understand up front is that it charges per client. That model stays clean and easy to forecast when your complexity comes from client count rather than the number of accounts under each. When it runs the other way, the pricing works against you.
Pricing. Two tiers. Core runs $25 per client per month, or $20 per client billed annually, and includes unlimited data sources, reports, and users, plus white-label branding, AI insights, client portals, and forecasting. Above it sits a custom Enterprise tier that starts at 25 clients. Customers who joined earlier still sit on the old four-tier plans, and many older reviews quote those numbers, so pull a fresh quote before you commit.
What stands out. The AI is current. AgencyAnalytics ships an MCP server, so you can connect ChatGPT or Claude to your workspace and query campaign data in plain language. Few reporting tools offer that yet.
Watch out. The per-client math. At five or ten clients the price is fair; past twenty-five or thirty it climbs faster than a per-source tool would, especially when each client needs only a couple of accounts. There’s also no template propagation, so one change can’t cascade across every linked report, and you edit them one at a time. The Swydo vs AgencyAnalytics comparison breaks down where each model wins.
Core from $25 per client/month ($20 annually) · unlimited data sources and users · 14-day free trial, no credit card
3. DashThis
Best for fast, template-first dashboards and top-rated support.
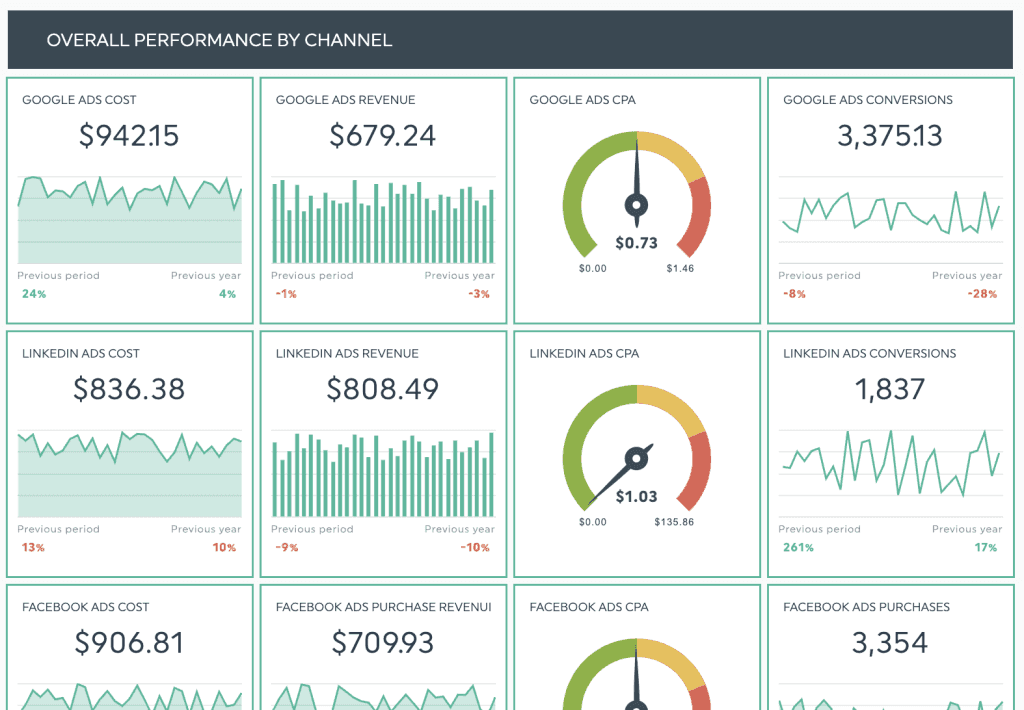
Want a clean client dashboard live this afternoon, with zero learning curve? DashThis is built for exactly that. The templates come pre-built, the interface is simple, and its support is well regarded. For a freelancer or a small shop that values speed over deep customization, it’s a reasonable pick, as long as you know where the ceiling is.
Pricing. Dashboard-based. The Individual plan starts at $49 a month, or $42 billed annually, for 3 dashboards. Professional runs about $149 a month (roughly $139 annually) for 10, where white-labeling and a custom domain arrive, and the top plans reach about $449 a month. Plans now count data sources too, not just dashboards, which pushes the cost up when you run a lot of accounts per report.
What stands out. Speed. The pre-built SEO, PPC, and social templates get a client-ready dashboard live in minutes, and the support team is among the most praised in the category.
Watch out. The dashboard-based model. One dashboard equals one report, and cloning a dashboard counts as another live one. Agencies that build a separate report per client, or per client per channel, watch the count climb faster than planned. There’s also no public API, so CSV upload becomes the workaround. The Swydo vs DashThis comparison shows how per-source pricing changes the math.
From $49/month ($42 annually), 3 dashboards · white-label on Professional · 14-day free trial
4. Whatagraph
Best for the best-looking reports and AI-built dashboards.
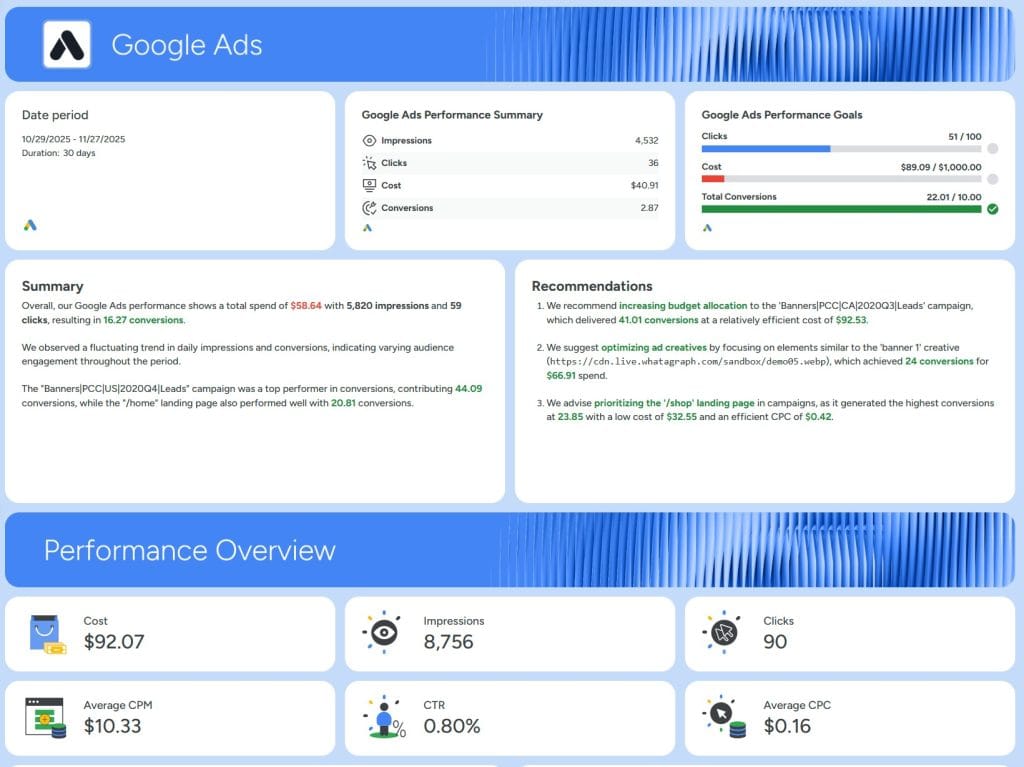
Whatagraph’s calling card is how its reports look. If your pitch leans on visual polish, and you want clients to enjoy opening what you send, it does that part well. The question is whether the look is worth the price.
Pricing. Annual billing only, with no monthly option, which matters when you compare it to anything month-to-month. The Max plan starts at $812 a month billed annually, about $9,700 a year, and Prime sits above it on a custom quote. Pricing is metered on source credits, where one credit is one connected account, and Max has a floor of 50 credits, so a 20-account agency pays the same as a 50-account one. Max includes unlimited users and reports, white-label reports, KPI overviews with alerts, a dedicated success manager, and Whatagraph IQ. There’s no free tier.
What stands out. Whatagraph IQ. Describe the dashboard you want in plain language, and it builds the structure, blending cross-channel data and custom metrics without code.
Watch out. Price and commitment. At $812 a month billed annually, it’s by far the steepest entry point here, and the annual-only billing locks you in for a full year with no month-to-month option. The 50-credit floor means a small agency pays for capacity it won’t use. Whether the reports justify that premium depends on how much your clients weigh looks. The Swydo vs Whatagraph breakdown is a useful gut-check.
No monthly billing; Max from $812/month billed annually · 50-credit floor · white-label included on Max
5. Databox
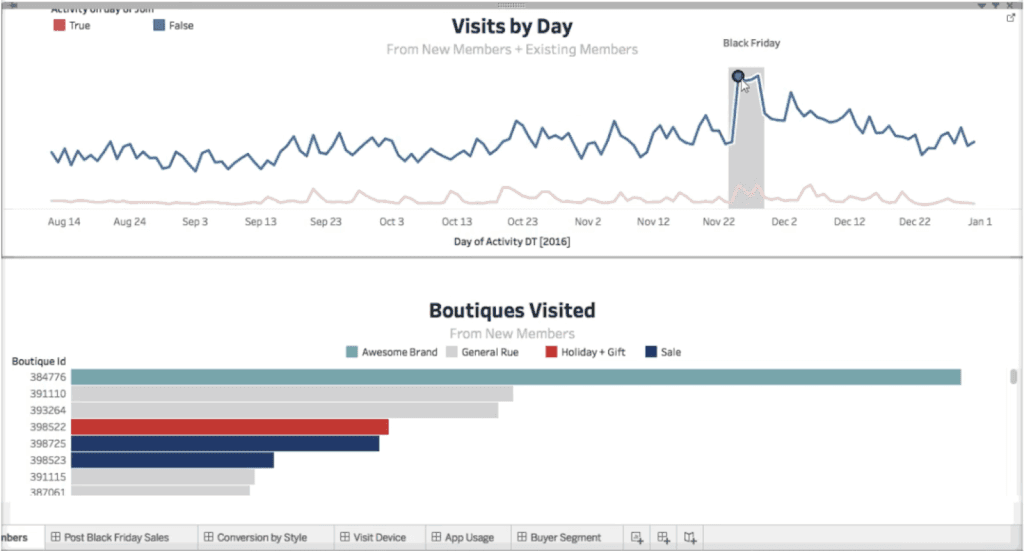
Best for internal KPI monitoring and benchmarking, less for client-facing delivery.
Databox is built for watching numbers move, not for mailing polished PDFs. If your day is really about keeping a live pulse on KPIs, sizing performance against industry benchmarks, and catching a Slack ping when something drifts, it fits. It pulls from 100+ sources, and the mobile apps are strong.
Pricing. A free tier with 3 data sources. Paid plans price by source: Pro at $199 a month, or $159 billed annually, Growth at $399 a month (data prep, anomaly detection, warehouse connections), and Premium at $799 a month (50 sources, white-labeling, a dedicated specialist). Users are unlimited on every paid plan.
What stands out. Monitoring and benchmarking. Databox stacks a client’s performance against industry baselines and tells you when a metric heads the wrong way.
Watch out. Two things hold it back for client work. White-labeling lives on the $799 Premium tier, a steep climb if branded delivery is the point. And the reports aren’t linked, so updating one metric across a dozen similar client reports means editing each by hand. A few Databox alternatives are built more squarely for client-facing reporting.
Free tier; paid from $199/month ($159 annually), priced by data source · white-label on Premium
6. Data Studio
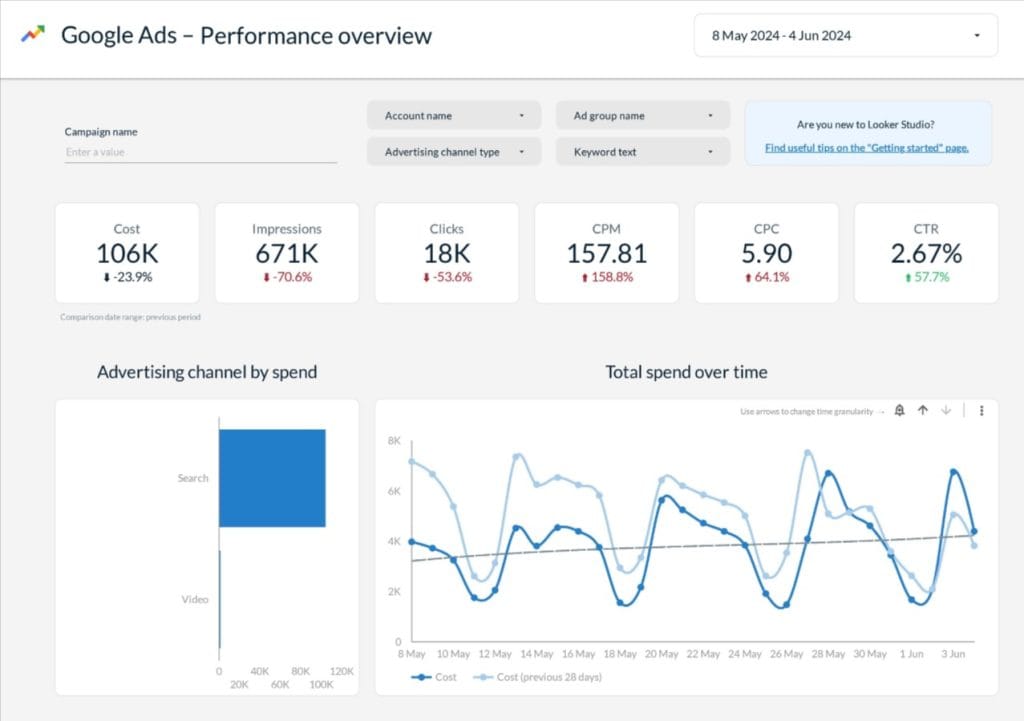
Best free option for teams living inside the Google stack.
Google renamed Looker Studio back to Data Studio, and existing reports, data sources, and permissions carried over automatically. The free tier is still the best no-cost dashboard tool, with native GA4, Google Ads, and BigQuery connectors and a deep bench of community connectors for everything else.
Pricing. Free. For a small team reporting mostly on Google data, that’s hard to argue with.
What stands out. The price, and the Google-native connectors. If your data already lives in GA4, Google Ads, and BigQuery, nothing stitches it together for less.
Watch out. The cost shows up elsewhere. Non-Google data needs paid third-party connectors, usually $20 to $350 a month each, and BigQuery bills climb at scale. The bigger cost is time: no client-management layer, no white-label portal, and no connection monitoring, so at any real volume you’re back to organizing reports and hunting broken feeds by hand. Agencies running many client reports often put the upkeep at 15 to 20 hours a month. Once you outgrow a handful of Google-only reports, the Looker Studio alternatives rundown covers where teams go next.
Free; paid connectors and BigQuery costs apply for non-Google data
7. Klipfolio
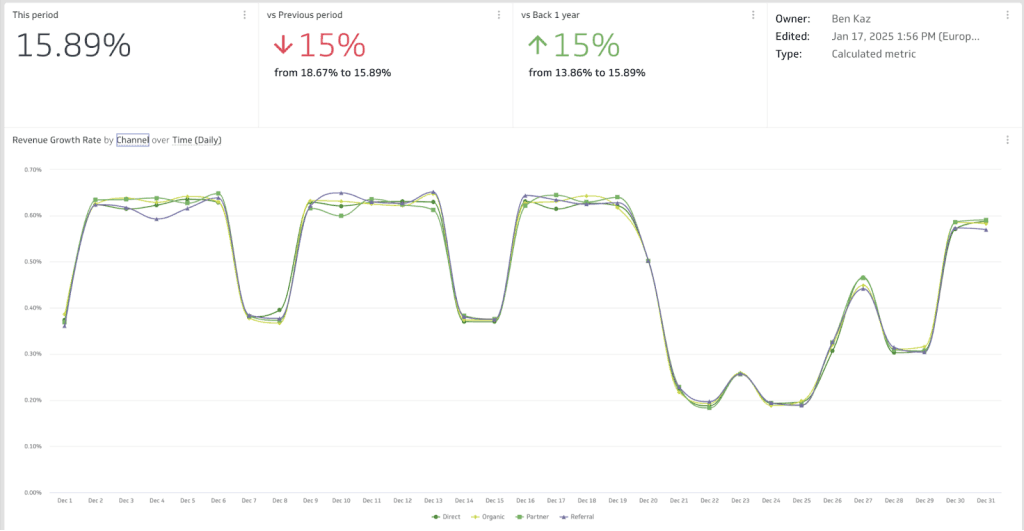
Best for technical teams that want deep, granular customization.
Klipfolio sits closest to a true BI tool on this list. Its Klips product offers 130+ integrations and near-total control over how data is modeled and displayed, which is what a technical, data-fluent team wants and what a time-strapped account manager doesn’t.
Pricing. It starts at around $90 a month for a handful of dashboards and climbs from there, with white-labeling as an add-on at roughly $299 a month on top. There’s no permanent free plan.
What stands out. Control. You can shape and visualize data with a precision most template-first tools don’t allow.
Watch out. The learning curve. Ready-made templates are scarce, so you build from raw materials rather than snapping together blocks. If you want reports live fast, that’s a poor trade; if you want to engineer something exact and have the skills, it delivers. The Klipfolio alternatives roundup is a good companion if the customization appeals but the setup time gives you pause.
From around $90/month · white-label add-on (~$299/month) · no permanent free plan
8. Supermetrics
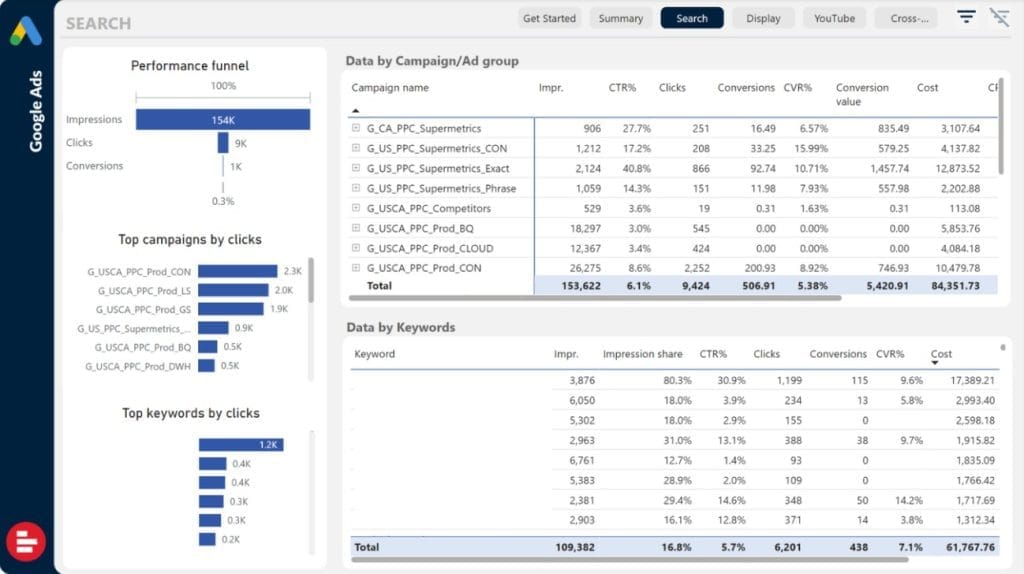
Best as a data pipeline feeding your own dashboards, not as a report builder.
Supermetrics belongs here with an asterisk: it isn’t a client-reporting tool. It’s the plumbing. It extracts your marketing data and pipes it into Looker Studio, Google Sheets, BigQuery, or your warehouse, where you build the reports yourself. Already have a dashboard setup you like and just need clean data flowing in? This is how you feed it.
Pricing. Annual-only, starting around $29 a month and scaling by the number of connectors and destinations you need. Costs rise with sources, destinations, and refresh frequency, which is easy to underestimate when you scope a full agency workload.
What stands out. Clean, reliable data extraction. Supermetrics moves marketing data into whatever destination you’ve chosen without the gaps that plague lesser connectors.
Watch out. This is a fit issue, not a quality one. With Supermetrics, you’re still building and maintaining reports in a separate tool, which is more moving parts than most agencies want. For client-ready reports without assembling a stack, the all-in-one tools above get you there faster.
From around $29/month, annual billing · scales by connectors and destinations
9. NinjaCat
Best for large and enterprise agencies wanting a managed, full-service platform.
NinjaCat, the enterprise platform that is not Reporting Ninja, closes out the list for big agencies and media companies. It brings 100+ integrations, advanced reporting, and AI agents together under a managed model with hands-on onboarding.
Pricing. Custom and quote-based, aimed at agencies operating at scale, so you talk to sales rather than read a number off a page. That’s normal for this tier.
What stands out. Full service. You get a partner and an onboarding team, not just a login, which is what a large operation with complicated needs wants.
Watch out. For most people reading this, it’s overkill. If you’re weighing $69 and $229 monthly tools, an enterprise platform with custom pricing and an implementation period isn’t your speed. If you’ve outgrown the self-serve options above, it’s the grown-up choice.
Custom enterprise pricing · 100+ integrations · managed onboarding
Mistakes Agencies Make When Switching Reporting Tools
The costliest reporting mistakes happen during the switch, not the search, and nearly all of them trace back to comparing sticker prices instead of real costs, or to missing a fee that surfaces only after you’ve signed.
- The base-price trap. A $20 base looks cheaper than a $69 base until you run your real client and source counts through both. Do the math at today’s scale, then again at where you’ll be in a year. The lowest headline rarely wins the actual invoice.
- White-label gating. Plenty of tools advertise a low entry price, then put custom domains and branded email behind a higher tier. If branded delivery matters, confirm which plan includes it before you compare. A scan of white-label reporting tools by what’s bundled at the base tier saves an ugly surprise.
- Annual-only lock-in. Some tools bill for a full year up front on paid plans. Fine if you’re sure, not fine if you wanted to test by the month. Know the commitment before you sign.
- The migration tax. Switching means rebuilding templates and re-teaching clients where to log in. Ask whether your new tool sets up your first reports for you, since some do, and fold that rebuild time into the decision.
- Skipping connection monitoring. A tool that won’t tell you when a data feed breaks will eventually send a client a report full of holes. Proactive monitoring versus passive reporting is worth weighing now, not after the awkward email.
One more thing to check has nothing to do with the tool. When GA4 renamed its engagement metrics and changed how impressions and views are counted, some year-over-year comparisons look off through no fault of your reporting software. After you migrate, confirm your historical numbers still line up, so you don’t blame the new platform for a definition change upstream.
Which Reporting Ninja Alternative Should You Choose
The right pick is the one whose billing unit matches how you grow. Match your shape to the model, and ignore the lowest number on the page.
- Small agency, few accounts per client, want it simple: AgencyAnalytics on Core, or DashThis if speed and templates matter most. Per-client and per-dashboard pricing both stay cheap at low volume.
- Paid-media agency, many ad accounts per client: Swydo. Per-source pricing plus cross-channel blending fits a setup where each client carries several accounts, and the flat base keeps the bill predictable.
- Many clients, few sources each (common for SEO): Swydo again. The per-source model with a discounted scale beats per-client math once client counts climb and accounts per client stay low.
- Visual polish is the selling point: Whatagraph, if the premium and the annual commitment fit your budget.
- Internal KPI tracking and benchmarks, not client PDFs: Databox.
- Light, Google-only reporting on a zero budget: Data Studio.
- Technical team wanting deep custom control: Klipfolio.
- Large or enterprise agency wanting a managed partner: NinjaCat.
Which Alternative Fits Your Agency
Find the row that sounds like you, then start your shortlist there.
Paid-media agency with several ad accounts per client
Per-source pricing + cross-channel blending, predictable flat base
Swydo
Many clients, only a couple of sources each (common for SEO)
Discounted per-source scale beats per-client math at high client counts
Swydo
Small client base, want it simple and forecastable
Per-client pricing stays cheap at low volume; deepest agency feature set
AgencyAnalytics
Need a client dashboard live today with no learning curve
Pre-assembled templates and top-rated support
DashThis
Visual polish is your selling point and budget allows a premium
Best-looking reports + AI dashboard building (annual billing)
Whatagraph
Tracking internal KPIs and benchmarks, not mailing client PDFs
Live monitoring, alerts, and benchmark comparisons
Databox
Light, Google-only reporting on a zero budget
Free, with native GA4 / Google Ads connectors
Data Studio
Technical team that wants to engineer exact, granular dashboards
Deep customization and modeling (steeper learning curve)
Klipfolio
Large or enterprise agency wanting a managed partner
Full-service platform, 100+ integrations, hands-on onboarding
NinjaCat
Two rows describe you? You’re likely at a crossover point, so run your real client and data-source counts through both billing models before deciding.
If two profiles describe you, you’re at a crossover point where the billing models sit close, so run your real client and source counts through both at today’s scale and next year’s.
Reporting Ninja Alternatives FAQ
Direct answers to the questions agencies actually ask before switching reporting tools
Reporting Ninja is a PPC-focused marketing reporting tool that builds automated, white-labeled client reports and dashboards. It connects to ad and analytics sources like Google Ads, Meta, Microsoft Advertising, and GA4, and it can also feed data into Looker Studio and Google Sheets.
Agencies use it mainly to send scheduled paid-media reports without building them by hand each month.
Reporting Ninja starts at $20 per month when billed annually, or about $25 month to month. The entry plan covers up to 10 accounts of each integration type, and every plan includes all features plus a REST API.
There’s a 15-day free trial with no credit card required, but no permanent free plan once the trial ends.
Reporting Ninja offers a 15-day free trial with no credit card required, but it has no permanent free plan. You’ll need a paid plan once the trial ends.
If you want a tool that stays free long term, Data Studio (formerly Looker Studio) is the better route, especially for Google-based reporting.
Reporting Ninja is worth it if you run mostly paid-media reports and want one low, predictable price with API access. It’s a weaker fit if you manage many clients across many channels and want built-in monitoring or a client portal.
The honest answer depends on your channel mix and how much you value automation and oversight over a low sticker price.
No, they are three separate products. Reporting Ninja is the PPC reporting tool. Ninja Reports is an unrelated SEO-audit crawler. NinjaCat is a separate enterprise reporting platform built for large agencies and media companies.
Reviews often blur the three, so check which product a review actually describes before you trust its rating.
Data Studio is the cheapest alternative because it’s free, which works well if your data lives mostly in Google Ads, GA4, and BigQuery. Among paid all-in-one tools, Swydo starts at $69 per month and includes 10 data sources with unlimited users, so you never pay per seat.
The cheapest choice depends on how your bill scales, not the entry price. The lowest-cost tool at 5 clients can become the priciest at 50.
Reporting tools charge in one of five ways, and the billing model matters more than the headline price. Match the unit you pay for to how your agency actually adds work.
| Billing model | How your bill grows | Example tools |
|---|---|---|
| Per client | With each client you add | AgencyAnalytics |
| Per data source | With each connected account | Swydo, Databox |
| Per dashboard | With each report view you build | DashThis, Klipfolio |
| Source credits | With each blended source | Whatagraph |
| Flat with account caps | Fixed, up to an account limit | Reporting Ninja |
Few clients with many ad accounts each favors per-client pricing. Many clients with one or two sources each favors per-source. Count both before you choose.
The most common hidden costs are white-labeling locked behind a higher tier, per-client or per-source overage fees, annual-only billing, and paid connectors for free tools like Data Studio. Each one can double the real price you expected from the base plan.
The fix is simple: price the tool at your real client and source counts, not the advertised entry rate. That’s where the surprises hide.
Yes. Data Studio, formerly Looker Studio, is the best free reporting tool, with native Google connectors and unlimited reports. Databox also offers a limited free tier.
Free works at small scale, but none of these include a client-management layer or connection monitoring, so the manual upkeep grows fast as you add clients.
There’s no single best alternative; the right one depends on how you grow and how much manual work you’ll accept. Swydo suits agencies wanting flat pricing, white-labeling on the base plan, and monitoring that flags broken data before clients notice.
AgencyAnalytics fits agencies wanting the widest feature set on simple per-client pricing, DashThis wins on fast templates, and Whatagraph on visual polish. Match the billing model and workflow to your agency, not the longest feature list.
For a small agency, the best reporting tool is one with low, predictable pricing and white-labeling included, so your brand is on every report from day one. Swydo, AgencyAnalytics, and DashThis all fit well at small scale.
If budget is the top concern and your data is Google-only, Data Studio is a solid free starting point until the manual upkeep outgrows the savings.
For a large agency, the best reporting tool is one whose pricing doesn’t punish scale and whose workflow cuts manual checks across many clients. Per-source tools like Swydo tend to stay affordable as client counts climb, while per-client pricing can get expensive past 25 to 30 clients.
Very large operations that want a managed, full-service setup often look at enterprise platforms like NinjaCat instead.
The best white-label reporting tools include the branding on their base plan. Swydo, AgencyAnalytics, and DashThis all white-label from their entry plans, covering your custom domain, logo, and branded report emails.
Whatagraph includes it on Max, its only standard plan, and Databox keeps it on the top Agency Premium plan or a paid add-on, so confirm where branding sits before you compare prices.
It comes down to billing math and workflow. Reporting Ninja gives you flat, account-capped pricing and a REST API, which is ideal for predictable cost and programmatic access.
Swydo uses per-source pricing with white-labeling included, cross-channel blending, and a monitoring workflow that catches broken connections before clients do, which is ideal for branded delivery and less manual oversight at scale. Count your clients and accounts per client, then pick the model that grows slowest for that ratio.
Agencies either build reports by hand in tools like Data Studio, or use a platform that centralizes every client in one place. The manual route means opening each client’s dashboard, checking the numbers, and watching for broken data before reports go out.
Platforms like Swydo replace that routine with a single metrics overview, goal tracking, and alerts. A client portal then gives each client one secure, branded link to their reports and goals, so you stop managing a separate URL for everyone. That is what keeps reporting for 5 to 50 clients from eating your whole morning.
Some can, and it’s a feature worth prioritizing. Tools with connection monitoring, like Swydo’s Data Health Check, email you when an ad account or analytics source drops, so you fix it before a client gets a report with missing numbers.
Many tools, including free ones like Data Studio, have no such warning. A broken feed can go unnoticed until the client points it out, which is the worst way to find out.
Yes. Most dedicated reporting tools let you build a report once, then schedule it to send automatically on a set cadence with live, refreshed data. This removes the manual work of rebuilding and re-sending reports every month.
When you compare tools, look for scheduling, templates you can reuse across clients, and automatic data refresh. Those three turn reporting from a monthly chore into a background task.
Increasingly, yes. Several reporting tools now generate written summaries of a client’s results, and some let you query your data in plain language. Swydo’s AI builds and edits reports from a plain-language prompt and writes the client summary, AgencyAnalytics connects to ChatGPT and Claude through an MCP server, and Whatagraph builds dashboards from a text prompt.
AI is useful for a first-draft insight, but review the output before it reaches a client, since it can miss context only you know.
A dashboard is a live, always-current view that clients log in to see anytime. A report is a snapshot of a set period that you schedule and send, usually as a PDF or a link.
The distinction matters for cost, because some tools charge by dashboards and some by reports. Knowing which one you actually deliver helps you pick the cheaper billing model.
White labeling means the report carries your agency’s brand instead of the software’s, including your logo, colors, custom domain, and branded email. It matters because clients should see your agency’s work, not the tool behind it.
The catch is where it lives. On some tools white-labeling is included on the base plan; on others it sits on a higher tier, which changes the real price.
To switch reporting tools, note your existing report structure, connect your data sources in the new tool, rebuild your templates, then tell clients where to view their reports. The main cost is the rebuild time, so weigh it alongside the monthly price.
Some tools set up your first reports for you, which removes most of that manual work. Ask about it during the trial.
Yes. Swydo migrates your existing reports for free as part of onboarding, which removes most of the manual rebuild. Most other tools leave you to set up templates and connections yourself.
It’s worth asking about migration help during a trial, since it can save days of setup work across a full client roster.
Most do, and a trial is the best way to test the daily workflow before committing. Swydo offers a 14-day free trial with no credit card, Reporting Ninja gives 15 days, and AgencyAnalytics and DashThis both run 14 days.
Databox and Data Studio have free tiers you can start on right away. Spend the trial on your real clients, not the demo data.
With a template-based tool, a first client report can be live in minutes, since you connect the data sources and start from a pre-built layout. Setting up your full roster takes longer, mostly the time to connect each client’s accounts.
Tools with reusable templates and free migration get you fully running the fastest.
The Bottom Line
Multiply your clients by the number of accounts each one runs, then match that shape to a billing model. Under about 30 clients with a few accounts each, per-source pricing like Swydo’s usually wins on cost; with many accounts per client, a per-client tool can come out ahead. Run both numbers at today’s size and next year’s before you commit.
If one thing decides it, make it the daily workflow. The tool you open every morning either shows you every client on one screen and alerts you when a feed breaks, or it leaves you a stack of dashboards to check by hand.
Shortlist the two tools that fit your billing shape, then build one real client report in each on a free trial. You’ll know inside an afternoon which one fits how your agency works. Swydo’s trial is free, there’s no credit card, and the team migrates your existing reports for you. Start at Swydo.
Put every client’s reporting on one screen, and catch a broken data source before your client does.
Start Your Free Trial Today