
An AI assistant will build you a working Google Ads reporting demo in about twenty minutes, and Google will retire the API version it wrote against in about six months. For most marketing agencies, that gap settles the build-versus-buy question, and it isn’t close.
The demo is maybe 10% of the actual work. The other 90% never ends, because the platforms you depend on keep changing underneath you and none of those changes announce themselves in a prompt.
Here’s the order. What the demo leaves out, the eight things that break in production, what AI and MCP actually change, whether a data connector is a real third path, what a build costs over two years, when building is the right answer, and what you’re paying for when you buy instead.
The Quick Version
- A one-prompt demo pulls one account’s data on a good day. Production reporting is multi-client, multi-platform, scheduled, reconciled, branded, and reliable, and that gap is the work.
- The cost is maintenance rather than construction, because ad platforms retire API versions every few months and your integrations break when they do.
- AI, MCP, and direct APIs lower the cost of the easy 80% and do almost nothing for the hard 20%.
- Data connectors like Windsor and Supermetrics are a real third path, but they move data without reporting it, so they relocate the work rather than remove it.
- Building makes sense in four specific situations. Outside those, you’re paying a developer to rebuild something you could rent for the price of a few billable hours a month.
- Buying a reporting tool means buying someone else to ride the maintenance treadmill for you.
The Demo That Fools Everyone
The trap springs on a Tuesday afternoon. You ask an AI assistant to “build a tool that pulls my client’s Google Ads data and shows it in a dashboard.” Twenty minutes later you have something that works. It authenticates, it pulls last month’s spend and conversions, it renders a chart, and it feels finished.
It’s a proof of concept for the happy path, which was never the hard part.
That demo has no token refresh, so it stops working in an hour when the access token expires. It pulls one account, so it has no idea what happens when you add a second client. It assumes the API call succeeds, so the first time Google returns a rate-limit error or a partial response, it either crashes or silently shows wrong numbers. It has no schedule, no email delivery, no branding, no user permissions, and no way to handle the client who runs Google Ads, Meta, and LinkedIn at once.
Every one of those gaps is a project, and together they’re the product the demo hid from you.
The Demo Is 10% of the Product
What an afternoon of prompting gets you, and what it leaves on the floor.
Authenticate one account, pull last month, render a chart. Twenty minutes, and it looks finished.
Token refresh, second client, error handling. The access token expires in an hour and nothing renews it.
Rate limits, pagination, scheduling, PDF rendering, email deliverability. Forty reports firing on the first of the month find every quota ceiling at once.
White-label, multi-tenancy, per-client access, reconciliation. A client counts 92 conversions where your report says 80.
API version migrations, on someone else’s schedule. Google deprecates on roughly half-year cycles. Meta ships a new version about every quarter.
What Actually Breaks When You Build
Building reporting is hard because you’re integrating with a dozen systems you don’t control, each with its own rules, all of them changing without asking you. Writing the code is the easy part. Here are the eight places it goes wrong.
Authentication and Access
Each platform uses OAuth, and OAuth is not a checkbox. You handle the initial consent flow, then store and refresh tokens before they expire, then handle the case where a client revokes access or changes their password and the token dies mid-report.
Then there’s app review. Before Meta or Google will let your app touch real client data at scale, you go through an approval process, justify each permission scope, and often submit to a security review. That takes weeks, and it happens before you write a single line of real reporting logic. Manager-account structures like Google’s MCC and Meta’s Business Manager add another layer, because the account you authenticate isn’t always the account that holds the data.
Rate Limits and Quotas
Every API throttles you. Pull data for one client and you’ll never notice. Pull for forty clients on the first of the month, when every report runs at once, and you hit quota walls that need request queuing, exponential backoff, retry logic, and caching so you’re not re-pulling the same data and burning quota you don’t have.
None of that exists in the demo, all of it exists in production, and it’s usually discovered the morning every client’s report was supposed to go out.
API Versioning and the Maintenance Treadmill
Home-built tools usually die here. The platforms retire old API versions constantly. Google’s advertising APIs deprecate versions on roughly half-year cycles, and once a version sunsets, calls to it are rejected with an HTTP 403. Meta ships a new Graph and Marketing API version about every quarter and supports each one for only around two years.
Every integration you build is a subscription to ongoing maintenance work, so the day you finish building is the day you start maintaining. Miss a migration deadline and the integration doesn’t degrade gracefully. It stops, mid-reporting-cycle, and your client’s report is blank.
A tool with 38 integrations isn’t a tool somebody built once. It’s 38 maintenance commitments somebody signed, in perpetuity, and the only question is whose name is on them.
Data Accuracy and Reconciliation
Your client opens your report, sees 80 conversions, opens Google Ads directly, sees 92, and now they don’t trust anything you build. This is the support nightmare that makes people abandon home-built tools.
The discrepancy is almost never a bug in the obvious sense. It’s attribution windows that differ between platforms, time zones that don’t match, currency conversion, and the fact that “conversions” is defined differently in Google Ads, GA4, and the client’s CRM. GA4 sampling alone can make the same query return slightly different numbers.
Reconciling all of this, and being able to explain it to a client, is a permanent part of owning the tool rather than a one-time fix, and it’s why marketing attribution models belong in your onboarding conversation instead of your first support ticket.
Pagination, Truncation, and Large Accounts
APIs return big result sets in pages, behind cursors. Handle pagination wrong and you silently get the first page and miss the rest, so a large account’s report is quietly incomplete and nobody notices until the numbers are way off.
If you’re piping data through an AI model to summarize or transform it, you inherit a second truncation problem in context limits. Feed too much data into the model and it drops the overflow or returns a partial result that looks complete. Truncation failures are the worst kind, because nothing errors out. The report renders, confidently, with missing data.
Scheduling, Delivery, and Reliability
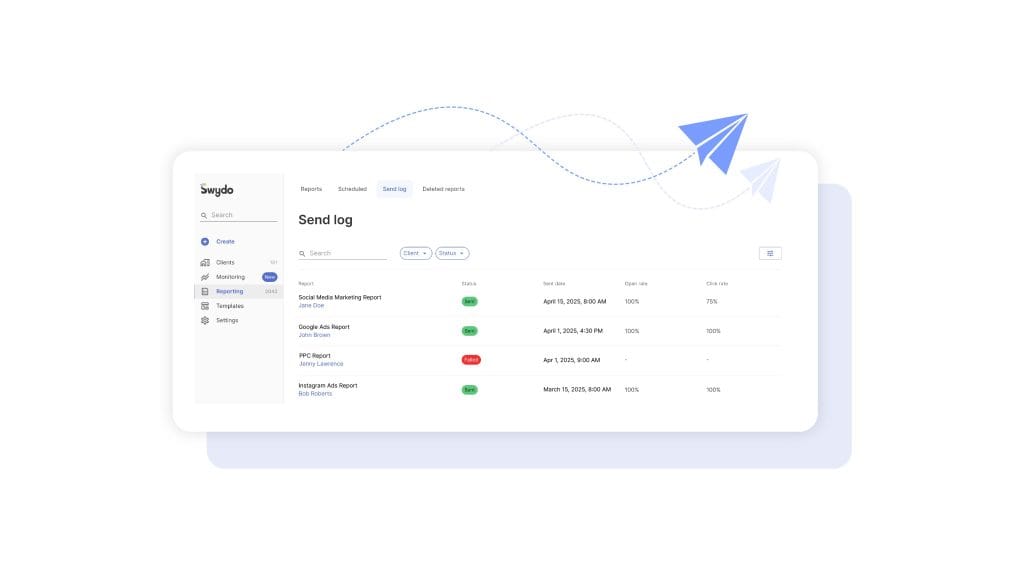
A report nobody receives isn’t a report. So now you’re running scheduled jobs that fire reliably at the right time in the right time zone, generating PDFs that render correctly, and sending email that lands in the inbox rather than spam, which means SPF, DKIM, and DMARC setup, bounce handling, and retry logic for the sends that fail. None of that is reporting, and all of it is required for reporting to work.
Multi-Tenancy, Security, and Compliance
The moment you have more than one client, you need strict data isolation so Client A can never see Client B’s data, plus user roles and permissions for your own team. Then each client wants their own view, which means per-client access links, a way to password-protect the sensitive ones, and a way to kill access the day their marketing manager leaves for a competitor.
You’re also storing OAuth secrets and client data, which means encryption, access control, and a credible answer when a client’s procurement team asks about GDPR or sends you a security questionnaire. “It’s a script my intern wrote” is not that answer.
The Edge Cases Nobody Plans For
A client pauses a campaign and the metric returns null instead of zero, and your math breaks. An account gets renamed and your hardcoded reference is now invalid. A currency changes. A platform has a partial outage and returns some data but not all. A client adds TikTok and expects it in the report next week. Each one is small, there are hundreds of them, and you find them one production failure at a time.
The AI, MCP, and API Question, Specifically
This conversation is happening now because AI, MCP, and open APIs genuinely lowered the barrier to starting. Being precise about what they change is worth the paragraph.
AI coding assistants are excellent at the happy path and brittle on the long tail. They’ll generate the working demo fast. They won’t, by default, write the token refresh, the backoff logic, the pagination handling, or the reconciliation rules, because those require knowing the specific failure modes of each platform and the specific quirks of your clients’ accounts. Vibe-coding gets you 80% in a day and the last 20% takes months, because the last 20% is judgment and edge cases the model has no way to know about. When it breaks, you still need someone who understands the system well enough to debug it, and “the AI wrote it” makes that harder.
MCP is a real step forward for connecting a model to data sources, and it repeals none of the problems above. You still own authentication, rate limits, and schema mapping. Wire up several MCP servers and you now own the orchestration and routing between them, plus the context limits of whatever model sits in the middle. An MCP server for a given ad platform either exists, in which case you depend on someone else maintaining it, or it doesn’t, in which case you’re maintaining it. Either way, you’ve added a layer.
Direct APIs give you the raw material. But “the data is available through an API” and “I have a reliable, reconciled, scheduled, branded, multi-client reporting system” are separated by exactly the 90% this article is about.
Here’s the part worth sitting with. AI aimed at the integration layer buys you a demo. AI aimed at the report layer, inside a tool where the integrations are already maintained, buys you the thing you actually wanted. In Swydo that looks like describing the report you want in plain language and getting back a built structure — sections, KPIs, tables, and charts — then editing it by asking rather than clicking. Same technology, pointed at the half of the problem that isn’t a treadmill.
These tools make the demo cheaper, and the maintenance is the cost.
What About Data Connectors Like Windsor and Supermetrics?
A third path sits between building from scratch and buying an all-in-one tool, and it’s the most common objection to both. Tools like Windsor.ai, Supermetrics, and Databox handle the extraction layer for you, pulling from Google, Meta, and the rest and dropping the data into a destination like Looker Studio, Google Sheets, or BigQuery. You skip the raw API code and the maintenance treadmill, because the connector vendor rides it instead.
This is a real option and for the right job it’s a good one. It changes the build-versus-buy math less than it first appears, because a connector moves data without reporting it. It gets your numbers into Looker Studio. It does not build, brand, schedule, or deliver the client report.
So the connector path is “rent the pipes, then build the dashboard.” You’ve swapped the API maintenance treadmill for a connector subscription plus a Looker Studio reporting layer you own and maintain, which runs into Looker (Data) Studio limitations of its own once you pass ten or fifteen clients.
What the Connectors Actually Cost
This category reprices often, so check the vendor’s page before you commit. A few things push the real number above the headline price.
Supermetrics charges per destination. Starter runs $44 a month on annual billing for three data sources and one destination. Growth is $177 a month for six sources and one destination, with a second destination at $187 and extra accounts at $14 each up to a cap. Sending data to both Looker Studio and Google Sheets roughly doubles the bill, and an agency with many client accounts hits the account ceiling and lands on a custom Enterprise quote.
Windsor.ai is the cheaper pure pipe, and it prices by platform type rather than by account. Basic is $19 a month on annual billing for three sources, 75 accounts, and unlimited users. Standard is $99 for seven sources. Ten clients on Google Ads, GA4, and Meta genuinely fits the $19 plan. Add LinkedIn, TikTok, Search Console, and a rank tracker and you’re on Standard. It’s well-priced for moving data, and it’s data only.
Databox sits closest to all-in-one because it includes dashboards. Pro starts at $159 a month for three data sources with each additional source at $5.60, where every individual account or property counts as a source, and white-label is a $14 add-on. A ten-client agency easily needs thirty sources, so the per-source meter is the thing to watch.
For comparison, Swydo starts at $69 a month with ten data sources included, white-label on every plan, and extraction, building, scheduling, and delivery in one price.
The Math for a Real Agency
Take ten clients, each running GA4, Google Ads, and Meta. That’s thirty connected accounts.
What Ten Clients Actually Cost
Ten clients on GA4, Google Ads, and Meta — thirty connected accounts.
| Option | Monthly | Report included? | What you still own |
|---|---|---|---|
| Swydo | $159 | Yes | Commentary and sign-off. $69 base with 10 sources, plus 20 extra at $4.50. |
| Windsor.ai | $19–$99 | No | The entire Looker Studio layer — build, brand, schedule, maintain. Prices by platform type, not account. |
| Supermetrics | $177+ | No | The Looker Studio layer, plus $14 per extra account, $187 per extra destination, and a custom quote past the account cap. |
| Databox | ~$324 | Dashboards | $159 Pro plus 27 sources at $5.60, plus $14 for white-label. Every account counts as a source. |
| Build it | $15,000+ | No | All of it, forever. One developer at a $180,000 loaded annual cost, before the maintenance treadmill starts. |
Connector prices are the vendors’ published annual-billing rates and this category reprices often, so check before you commit. The build row is one loaded developer salary divided by twelve, which is the floor rather than the estimate.
The honest read is that Windsor at $19 to $99 dramatically undercuts Swydo’s $159, and it should, because it isn’t selling the same thing. Windsor’s price doesn’t include the report.
Add the labor to build and maintain the Data Studio layer, white-label it, and keep it from breaking, and the connector path costs more in total, in money and in hours.
You’re comparing “$99 plus a standing Data Studio project” against “$159 with the reports already done.” Which of those two line items is actually cheaper depends entirely on what an hour of your team’s time is worth, and most agencies never run that number.
Supermetrics and Databox land at or above Swydo’s all-in price while still leaving you either the build, in Supermetrics’ case, or a per-source meter that charges for every new client, in Databox’s. If you’re weighing that specific trade, the Databox alternatives breakdown covers it in more detail than fits here.
When the Connector Path Is the Right Call
It wins when reporting isn’t your goal. If you need a real data warehouse, want to model data in BigQuery, report in Power BI or Tableau, or handle data blending across marketing and non-marketing business data, a connector feeding a warehouse is exactly the right tool and an all-in-one reporting platform would box you in.
For the agency whose job is sending clients clear, branded reports every month, the connector path reintroduces the thing you were trying to avoid. You escaped the API maintenance treadmill and signed up for a scaling Looker Studio problem instead, on top of a subscription that meters by source, destination, account, and client.s both layers into one bill and zero build time.
The Real Cost of Building
Building costs more than everyone estimates, because they price the prompt rather than the project.
Start with people. The median US software developer earns $133,080 a year in base salary, and benefits, taxes, and overhead typically push the loaded cost well past $180,000. A few months of one developer’s time to reach a real first version is real money, and the build is the cheap part.
Then comes the maintenance treadmill, which means a standing time commitment every quarter just to keep existing integrations alive as APIs change. Add the support burden, because the day a number looks wrong, you become the help desk for your own tool.
Opportunity cost is the biggest hidden line item. Every hour your developer spends keeping the Meta integration alive is an hour they’re not spending on revenue-generating work. And there’s risk, which is the cost of an integration silently breaking during a client’s reporting week and you finding out from the client.
A subscription tool amortizes all of that across thousands of agencies, so you’re splitting the cost of the entire maintenance treadmill with everyone else who uses it. That’s why automated reporting tool pricing almost always lands at a fraction of carrying it yourself.
When Building Actually Makes Sense
Four situations, and pretending otherwise would be dishonest.
- You have a dedicated engineering team with genuine spare capacity — not a borrowed developer between client projects.
- Reporting itself is your product or your core differentiator, so the maintenance treadmill is your business rather than a distraction from it.
- You have a requirement no existing tool serves, verified by actually checking rather than assuming.
- You’re at unusual scale, which is rarer than people assume, because maintenance cost scales with you.
One honest trade-off on the buy side, since it’s relevant here. Swydo is built to be configured, not programmed against. It connects 38 integrations and exports to Google Sheets and Looker Studio, and it doesn’t expose a full public REST API for arbitrary custom development, so custom pipelines run through Google Sheets with Zapier or Make.
A team that truly needs bespoke logic on top of their reporting layer may hit a ceiling a packaged tool won’t cross. For that specific team, building might be justified. For the agency whose goal is “send clients good reports without losing a week a month,” it almost never is.
What You’re Actually Buying
Buying a reporting tool means buying out of the maintenance treadmill rather than buying software.
You’re buying 38 integrations that someone else keeps alive every time Google or Meta changes an API, so a version sunset is their 2 a.m. problem.
You’re buying OAuth, token refresh, rate-limit handling, and pagination already solved and tested across thousands of accounts. You’re buying the reconciliation knowledge baked in, so you’re not personally explaining attribution windows to a client at 9 p.m.
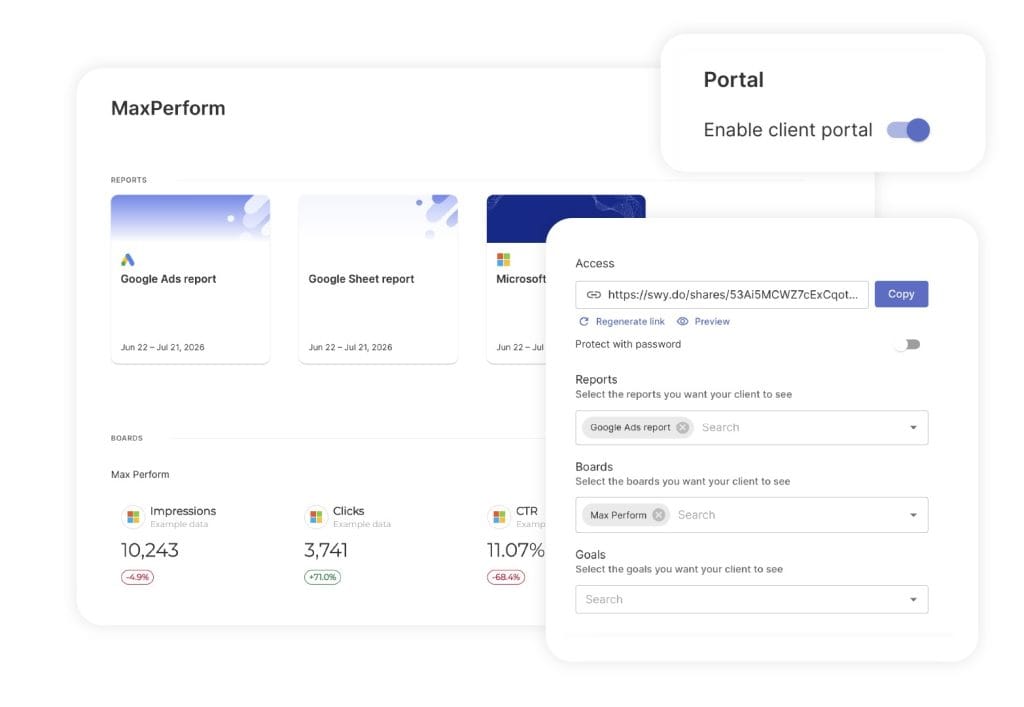
You’re buying the multi-tenancy layer you’d otherwise build. In Swydo that’s the Client Portal, which puts each client’s reports, boards, and goals behind one secure link on your own domain.
You choose exactly what that client sees, preview it before you send, add a password when their security team asks, and regenerate the link to revoke the old one the day a contact leaves.
Building the same thing means per-client auth, share tokens, revocation, and a preview mode, which is a sprint on its own.
You’re buying the AI layer without the API bill. Report summaries, wins, issues, and recommendations generate inside the tool, drop into a text widget, and auto-insert into scheduled emails. Turn it on for clients and they can ask their own dashboard questions in their own language rather than emailing you on the 18th.
Your plan includes 4,000 AI credits a month against an average summary of about 95 credits, so roughly 40 summaries. Credits reset monthly rather than rolling over, you’re billed only for what you use, and a spending limit keeps the number predictable.
You’re buying the answer to the security questionnaire. Requests run on commercially available models in the AWS cloud, routed to whichever region has capacity. Your data isn’t used for training. The offering is GDPR compliant and the existing data processing agreement already covers AWS, so there’s nothing new for your client’s legal team to sign. Compare that to writing your own privacy posture from scratch.
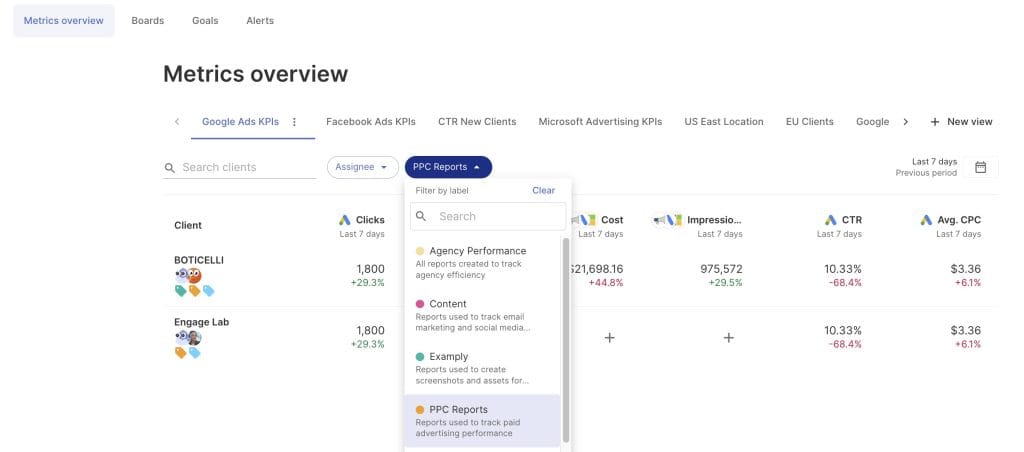
And you’re buying the daily workflow that keeps all of it under control at scale. Instead of opening a separate dashboard for every client each morning, you get a single Metrics Overview across your whole roster, Goals that flag which clients are off track, Alerts that already caught overnight problems, and Data Source Health that surfaces a dead connection before you send.
That’s the difference between monitoring vs reporting, and that check stays a two-minute glance whether you run five clients or fifty.
Build vs. Buy at a Glance
The same nine questions, answered both ways.
| Question | Build | Buy |
|---|---|---|
| Time to a demo | An afternoon | An afternoon |
| Time to a report you’d send a paying client | Months, and then it never finishes | The same afternoon |
| Who handles API version migrations | You, every quarter, forever | The vendor, on their own clock |
| Integrations maintained | However many you can afford to keep alive | 38 and growing, none of them yours |
| Reconciliation knowledge | Learned one angry client at a time | Already baked in and documented |
| Per-client access and revocation | A sprint: auth, share tokens, preview, revoke | A portal per client, password optional, link regenerable |
| Answer to a security questionnaire | Whatever you can write from scratch | GDPR-compliant, DPA already signed |
| Cost, year one | A developer at $180,000 loaded, part-time at best | From $69 a month with 10 data sources |
| Cost, year two | The same, plus everything you shipped in year one | The same, plus whatever they built for free |
Building wins when you have spare engineering capacity, sell reporting itself, have a requirement no tool serves, or run at unusual scale.
Final Thoughts
Run the arithmetic before you commit a developer. Count the platforms your clients run, multiply by the API migrations each vendor ships a year — Google roughly two, Meta roughly four — and that’s your standing maintenance load before you write a single feature. Put it against $69 a month with ten data sources included.
The reason buying wins is that the build never finishes. Everything else is detail around that one fact.
Then test it rather than trusting either of us. Trial a tool against two live clients with their real accounts connected and see how long it takes to get a branded, scheduled report out the door. You’ll know inside an afternoon.
Build vs. Buy Client Reporting FAQ
Straight answers on what building costs and when it’s worth it
You can build a working demo in an afternoon. You can’t build a production tool. AI writes the happy path fast, then leaves you the parts that make reporting reliable: token refresh, rate-limit backoff, pagination, error handling, and data reconciliation. That’s most of the work, and it takes months.
The demo is roughly 10% of the product. It authenticates one account, pulls last month’s numbers, and renders a chart, which is exactly the part that was never hard. Your second client, your first expired token, and your first rate-limit error are all still ahead of you, and none of them show up in the prompt.
A demo takes an afternoon. A tool you’d put in front of a paying client takes months, and then it never finishes. Multi-client support, scheduling, white-label branding, reconciliation, and error handling each add weeks, and the maintenance starts the day the build ends.
Every integration you ship is a standing commitment, so a tool with 38 integrations isn’t something anyone built once. It’s 38 commitments somebody signed, in perpetuity, and the only question is whose name is on them. Ask what the tool costs in year two rather than what it costs to ship.
The APIs give you raw data, not a reporting system. Between “the data is available” and “a reliable, reconciled, scheduled, branded, multi-client report” sits authentication, rate limits, version migrations, pagination, reconciliation, delivery, and security. The APIs are the easy 10%.
Rate limits alone make the point. One client never hits a wall. Forty clients on the first of the month, every report firing at once, hits quota ceilings you didn’t know existed, and now you need queuing, backoff, retries, and caching so you’re not burning quota re-pulling the same numbers. None of that exists in the demo, and all of it exists in production.
No, because the hard part is knowing a fix is needed rather than writing it. AI can write a migration once you hand it the new API spec and tell it what broke. It can’t watch a deprecation schedule, test against your clients’ live accounts, or answer the client when the report lands blank.
Every maintenance failure in reporting is a noticing failure first. A version sunsets, a token dies, a paused campaign returns null instead of zero, and the report renders anyway, confidently, with wrong numbers. Nothing throws an error, and “the AI wrote it” means nobody on your team knows the system well enough to catch it either.
They depend on APIs you don’t control, and those APIs change constantly. Google retires advertising API versions on roughly half-year cycles. Meta ships a new Marketing API version about every quarter and supports each one for around two years. Any of those changes can break an integration you built.
Miss a migration deadline and the integration doesn’t degrade gracefully. Calls to a retired version get rejected outright, so the connection goes dark mid-reporting-cycle and the client’s report renders blank. That’s the maintenance treadmill, and it’s why home-built tools die instead of failing loudly.
Almost never a bug. The platforms genuinely disagree, because each one defines a conversion differently, applies its own attribution window, and runs on its own time zone. Your client sees 80 conversions in your report and 92 in Google Ads, and now they don’t trust anything you built.
The usual causes:
| What you see | What’s actually causing it |
|---|---|
| Fewer conversions in your report than in Google Ads | Attribution windows differ between platforms |
| Totals shift at the start or end of the month | Time zones don’t match between the account and the report |
| Spend doesn’t line up with the invoice | Currency converted at a different rate or date |
| GA4 and Google Ads disagree on the same conversion | Each one defines a conversion differently |
| The same query returns slightly different numbers each run | GA4 sampling |
| A big account’s totals are quietly too low | Pagination returned page one and dropped the rest |
Explaining this gap to a client, every time it appears, is a permanent part of owning the tool.
On the build side, that’s a sprint on its own. You need strict data isolation so Client A can never see Client B’s numbers, a per-client share link, a preview mode so you can check what they’ll see before you send it, optional password protection for the sensitive accounts, and a way to kill a link the day their marketing manager leaves for a competitor.
On the buy side it’s a settings tab. Swydo’s Client Portal puts each client’s reports, boards, and goals behind one secure link on your own domain, and you pick exactly what that client sees. Add a password when their security team asks. Regenerate the link and the old one dies immediately. Update what’s shared whenever the engagement changes.
One honest limit worth naming: a portal shows what you publish to it rather than acting as a self-serve query tool, so it works best once you’ve decided what each client should see.
All of it, forever. OAuth tokens that expire, clients who revoke access, rate limits that only bite at scale, API versions that sunset on someone else’s schedule, and pagination that silently returns page one and drops the rest.
Then the parts that aren’t reporting at all but are required for reporting to work. Scheduled jobs that fire in the right time zone. PDFs that render. Email that lands in the inbox rather than spam, which means SPF, DKIM, DMARC, bounce handling, and retries. Data isolation so Client A never sees Client B. Per-client access links you can revoke. And a real answer when a client’s procurement team sends a security questionnaire, because “it’s a script my intern wrote” isn’t one.
Looker Studio is free for Google’s own data sources, and everything else costs. Meta, LinkedIn, TikTok, and most CRMs need a paid third-party connector, there’s no built-in alerting, and you build, brand, and maintain every client dashboard by hand.
Looker Studio is the build option with a drag-and-drop editor instead of a code editor. You swapped writing integration code for hand-maintaining dashboards, one per client, forever. That’s a good trade for internal analysis or a handful of Google-only clients, and it stops being free the month a client adds a non-Google channel, or the month you add your tenth client and realize you’re rebuilding the same dashboard for the tenth time.
Yes, and plenty of agencies do. Spreadsheets aren’t cheaper, though. They’re billed in hours instead of dollars, and the bill scales with your client count while a tool’s doesn’t.
The copy-paste step is where errors enter and where your reporting week comes from. Every month someone exports from Google Ads, exports from Meta, pastes both into a sheet, fixes the date ranges, and rebuilds the chart. It works fine at three clients. What does it look like at fifteen, and did that person have anything better to do?
It’s a valid middle path if you know what it covers. A connector handles data extraction and rides the API maintenance treadmill for you, which is real value. It does not build, brand, schedule, or deliver the client report, so that part stays yours.
The connector path is “rent the pipes, then build the dashboard.” You’ve swapped an API treadmill for a connector subscription plus a Looker Studio layer you own and maintain. For pure client reporting that usually costs more in total once you count the hours, and for feeding a data warehouse or custom BI it’s the right choice.
Ten clients on GA4, Google Ads, and Meta — thirty connected accounts:
| Option | Monthly | What you still own |
|---|---|---|
| Swydo | $159 | Commentary and sign-off. $69 base with 10 sources, plus 20 extra at $4.50. |
| Windsor.ai | $19–$99 | The whole Looker Studio layer. Prices by platform type rather than account. |
| Supermetrics | $177+ | The Looker Studio layer, plus $14 per extra account and $187 per extra destination. |
| Databox | ~$324 | Dashboards included. $159 Pro plus 27 sources at $5.60, plus $14 for white-label. |
Windsor at $19 to $99 undercuts Swydo badly, and it should, because it isn’t selling the same thing. Its price doesn’t include the report. Connector pricing shifts often, so check the vendor’s page before you commit.
It makes connecting a model to data sources easier and removes none of the authentication, rate limits, schema mapping, or version maintenance. MCP is a connection layer rather than a reporting system, so everything that broke before still breaks.
Wire up several servers and you’ve added work. Now you own the routing between them and the context limits of the model in the middle. Feed it too much data and it drops the overflow silently, which is the worst failure mode there is, because nothing errors out. And an MCP server for a given ad platform either exists, in which case you depend on someone else maintaining it, or it doesn’t, in which case you’re maintaining it.
When reporting isn’t your goal. A connector feeding a warehouse is exactly right if you need to model data in BigQuery, report in Power BI or Tableau, or blend marketing data with business data that lives somewhere else. An all-in-one reporting platform would box you in there.
If your job is sending clients branded reports every month, the connector path reintroduces the thing you were trying to avoid. You escaped the API treadmill and picked up a dashboard treadmill instead, on top of a subscription that meters by source, destination, account, and client. Which treadmill did you mean to buy?
For almost every agency, buying wins once maintenance is in the math. A build costs a developer’s salary plus a permanent commitment to keep integrations alive as APIs change. A subscription splits that same maintenance across thousands of agencies, which is why it lands at a fraction of the cost.
The median US software developer earns $133,080 in base salary, and benefits, taxes, and overhead push the loaded cost well past $180,000. A few months of that to reach a first real version outruns years of a subscription, and the build is the cheap part. You’re renting your share of everyone else’s API migrations.
Four situations, and they’re narrower than people assume. You have a dedicated engineering team with real spare capacity. You sell reporting itself, so the treadmill is your business. You have a unique requirement no tool serves, verified by actually checking. Or you’re at unusual scale, which is rarer than it sounds, because maintenance cost scales with you.
There’s an honest limit on the buy side worth naming. A packaged tool is built to be configured rather than programmed against, so a team that needs bespoke logic on top of the reporting layer can hit a ceiling a subscription won’t cross. Swydo has no public REST API, for instance, so custom pipelines run through Google Sheets with Zapier or Make. For the agency whose goal is sending good reports without losing a week a month, that ceiling almost never comes up.
It depends on what the vendor does with the data, which is the question a client’s procurement team will ask you first. In Swydo, requests run on commercially available models in the AWS cloud, routed to whichever region has capacity. Your data isn’t used for training. The offering is GDPR compliant and the existing data processing agreement already covers AWS, so there’s nothing new for anyone’s legal team to sign.
Cost is the second question. Your plan includes 4,000 AI credits a month against an average summary of about 95 credits, so roughly 40 summaries. Credits reset monthly rather than rolling over, you’re billed only for what you use, and a spending limit keeps the number predictable if a whole team has access.
Build the same thing yourself and you own the model contract, the token bill, the prompt-injection surface, and the privacy answer, all before you’ve written a line of reporting logic. Either way, keep the sign-off human. A misread trend in an auto-summary still carries your name on the report.
It’s a fair objection and smaller than it feels, because your data doesn’t live in the reporting tool. It lives in Google Ads, Meta, and GA4. A vendor change costs you the rebuild of your report templates rather than your history. Ask before you sign whether you can export report data and templates, and whether pricing meters per client.
Then compare that to the build. A build has the same switching cost the day you abandon it, and you paid a developer to maintain it the whole time you owned it. Buy-side risk is a bad month. Build-side risk is a bad year plus a salary. Tools that price per data source rather than per client also keep new business from repricing your stack, which is where most lock-in pain comes from.
You inherit a system nobody understands and every client depends on. It keeps working until a version sunsets or a client adds TikTok, and then someone has to open code they didn’t write, against platform quirks they’ve never seen, during a reporting week.
AI-generated code makes this worse. “The assistant wrote it” means nobody reasoned through the failure modes in the first place, so debugging starts from zero. That’s the risk line item nobody prices at the start, and it’s the one that turns a build into a rewrite. What’s your plan for the week that happens?
One signal is enough. You found out a report was broken because the client told you. Someone on your team has “reporting week” blocked on their calendar. A new client means rebuilding the same dashboard from scratch again.
All three are the same problem in different clothes, which is that your reporting cost scales with your client count. A setup that works at five clients and dies at twenty was never working, it was just small. The honest test is what next month looks like if you win three new accounts.
Put a real tool next to your build estimate and send a branded client report today.
Start Your Free 14-Day Trial