
Reporting only ROAS to a client in 2026 is reporting half the picture. A campaign with a 5:1 ROAS can have negative ROI if the product margin is thin or your agency fees aren’t in the denominator. And a platform-reported ROAS of 6:1 inside Performance Max can mask a blended ROAS of 2.5:1 across the actual business.
This is where the Profitability Ladder comes in — a four-rung framework that climbs from tactical to strategic by adding more cost-side reality to the denominator at each step:
Each rung adds more cost-side reality to the denominator. Climb from tactical to strategic — and report all four.
ROAS Revenue ÷ Ad Spend
Campaign-level decisions, daily optimization, channel comparison.
POAS Gross Profit ÷ Ad Spend
Ecommerce campaign decisions when SKU margins differ.
MER Total Revenue ÷ Total Marketing Spend
Board-level decisions, total marketing efficiency — the number CFOs trust.
ROI (Net Profit − Investment) ÷ Investment
Strategic decisions, retainer justification, end-of-quarter reporting.
↑ Tactical to Strategic ↑
Each rung answers a different question for a different audience. The mistake is staying on Rung 1 and calling it a complete report. This guide walks all four — what each measures, when to lead with it, what good looks like in 2026, and how to surface them without rebuilding the same dashboard four times.
What You’ll Need to Run the Profitability Ladder
The whole stack can be built from tools most agencies already pay for. What changes is the layer that ties them together.
- The ad platforms themselves — Google Ads, Meta, TikTok, Microsoft, LinkedIn. Free. These give you per-channel ROAS at the platform level.
- Google Analytics 4 — Free. Source of truth for revenue when paired with ecommerce or lead-conversion tracking.
- A spreadsheet for COGS and margins — Google Sheets works. This is where SKU-level gross-margin data lives so POAS calculations actually reflect profit.
- A reporting layer that blends them — to put all four metrics on one dashboard without copy-pasting numbers every Monday. Swydo’s 14-day trial includes 10 data sources, which covers most small-to-mid agency setups (a typical 5-channel client uses 5–7 sources). Seats are unlimited regardless of plan.
The point of the stack isn’t more tools — it’s fewer surprises during the quarterly review. With the right reporting layer, the four rungs live on one screen.
What Is the Difference Between ROAS and ROI?
The difference between ROAS and ROI is what’s in the denominator and what’s in the numerator. ROAS uses revenue and ad spend. ROI uses profit and total marketing investment. The first asks “is this ad efficient?” The second asks “did this marketing make money?”
Measures
Ad-spend efficiency
Numerator
Revenue from ads
Denominator
Ad spend only
Accounts for margins?
No
Accounts for agency fees?
No
Best for
Daily campaign decisions
Time window
Days to weeks
Reported as
Ratio (4:1) or multiple (4x)
Measures
Marketing profitability
Numerator
Net profit from marketing
Denominator
All marketing costs
Accounts for margins?
Yes
Accounts for agency fees?
Yes
Best for
Strategic & retainer decisions
Time window
Months to quarters
Reported as
Percentage (300%)
A campaign can be efficient and unprofitable at the same time. That’s the trap.
Two campaigns can look identical on ROAS and produce very different ROI. A 5:1 ROAS on a 15%-margin product yields $0.75 of gross profit per ad dollar — before agency fees, tools, creative, or shipping. A 3:1 ROAS on a 70%-margin SaaS subscription yields $2.10. Same ROAS column on the report; one client makes money and the other doesn’t.
This is why the question “is ROAS good?” is not really answerable on its own. A good ROAS depends on the gross margin behind it.
What Is ROAS and How Do You Calculate It?
ROAS is Revenue from Advertising divided by Cost of Advertising. A 4:1 ROAS means every dollar of ad spend produced four dollars in revenue.
The ROAS Formula
You’ll see it written three ways for the same thing: as a ratio (4:1), a multiple (4x), or a percentage (400%). Pick one and stick with it across all client reports — switching formats between campaigns confuses everyone.
ROAS Formulas by Business Model
The basic ROAS formula doesn’t change, but the numerator does depending on what the client sells.
For subscription businesses, decide upfront whether “average subscription value” means first month, first year, or LTV. Three different numbers; three very different ROAS calculations. Always document the choice in the report footer so the client doesn’t think you’re cherry-picking.
A Worked ROAS Example
An ecommerce client spent $10,000 on a Meta campaign and generated $40,000 in sales. ROAS = $40,000 ÷ $10,000 = 4.0 — a 4:1 return.
The same client ran $15,000 on Google Shopping and produced $75,000 in sales. ROAS = $75,000 ÷ $15,000 = 5.0 — a 5:1 return.
Google Shopping wins on ROAS. So shift budget from Meta to Google, right? Not yet. The ROAS comparison alone is the trap. You need to know the product margin behind each channel’s sales mix, the agency fees attached to each, and whether Meta is doing upper-funnel work that Google is harvesting. We’ll get there.
What’s a Good ROAS in 2026?
A 3:1 ROAS is the rough industry floor for break-even after typical agency fees and product costs. 4:1 is generally considered healthy. Above 5:1 is strong for direct-response, lower for awareness work.
But “good ROAS” is industry-dependent. According to WhatConverts’ 2025 benchmarks compiled from Varos data across 33 verticals:
- Google Ads median: 3.31x
- Meta Ads median: 2.19x — and dropping the longer you ignore the underlying Facebook Ads metrics feeding it
- TikTok Ads median: 1.41x (rising to ~2.25x with Value optimization)
Ecommerce sits below average. Across 35,000+ DTC brands, average ecommerce ROAS in 2025 was 2.87x with a median of 2.04x — meaning half of all DTC stores are operating below 2:1. High-margin verticals like Home & Garden clear 6x blended; thin-margin verticals like Apparel sit around 4x.
If your client is in apparel and pulling a 3:1 ROAS, that’s near the bottom of the pack. If they’re in home goods at 3:1, that’s underperforming the category. Benchmark against the client’s vertical, not against a generic “4:1 is good.”
What Is ROI and How Do You Calculate It?
ROI is Net Profit from Marketing divided by Total Marketing Investment, expressed as a percentage. ROAS measures efficiency. ROI measures whether the entire marketing operation made the client more money than it cost.
The Marketing ROI Formula
Where:
- Net Profit = Revenue × Gross Margin − all variable costs tied to those sales
- Total Marketing Investment = ad spend + agency fees + creative production + tools + internal staff time
The denominator is where most agency ROI calculations cheat. If you’re a retainer agency charging $5,000/month and you put $30,000/month into ad spend, the ROI denominator is $35,000, not $30,000. Reporting ROI without your own fees in the denominator is the same lie as a financial advisor reporting returns before their management fee.
A Worked ROI Example
A B2B client’s quarterly marketing program looks like this:
- Ad spend: $30,000
- Agency fees: $15,000
- Content production: $5,000
- Total marketing investment: $50,000
- Revenue generated: $200,000
- Gross margin: 70% → Gross profit: $140,000
ROI = (($140,000 − $50,000) ÷ $50,000) × 100 = 180%
Every dollar of marketing investment — including the agency fee — returned $1.80 in profit. That’s the number a CFO cares about. It’s also the number that wins contract renewals.
If you’d reported ROAS on this same campaign, you’d have shown a 6.67:1 return ($200,000 ÷ $30,000) — impressive but misleading, because it ignored the $20,000 in fees and creative. Both numbers are true. Only one survives a CFO review.
A quiet way to make this calculation honest without doing the math by hand on every report: apply an Agency Markup to the cost metric of any ad-platform data source. The widget then reports cost as ad spend plus your markup, so every ROAS-style and ROI-style number downstream reflects the true cost to the client. The CFO meeting gets shorter when the numbers already include what you charge — and your agency profitability story stops needing footnotes.
What’s a Good Marketing ROI?
5:1 (500%) is widely cited as a strong marketing ROI benchmark, but the actual number depends heavily on the channel and the maturity of the client’s business. Mature B2B programs land around 3:1 to 8:1. Direct-response ecommerce ROI is usually lower because margins are thinner. SEO is the outlier — long payback period, then very high ROI when it compounds.
According to First Page Sage’s 2026 SEO ROI Statistics covering Q1 2021 through Q3 2025:
- Average SEO ROI across 19 industries: 748% (thought-leadership programs)
- Average time to break-even: ~9 months
- Highest-ROI vertical: Real Estate (~1,389%)
- Lowest-ROI vertical: Ecommerce (~317%)
SEO conversion rates average 2.4% versus 1.3% for PPC, which is a large part of why SEO ROI compounds while PPC ROI plateaus.
What Is POAS and Why Does It Matter for Ecommerce?
POAS (Profit on Ad Spend) is Gross Profit divided by Ad Spend. It’s ROAS adjusted for what actually arrives in the bank account after COGS, shipping, and payment fees. For ecommerce clients with mixed SKU margins, POAS is the right campaign-level metric — and one of the few ecommerce metrics that survives a CFO conversation intact.
The POAS Formula
Where Gross Profit = Net Revenue − COGS − Shipping/Fulfillment − Payment Gateway Fees − Discounts/Returns.
POAS reads on the same scale as ROAS. A POAS of 2 means every ad dollar produces two dollars of gross profit, which after agency fees and overhead usually means the business is making money. A POAS below 1 means you’re losing money on the campaign no matter what the platform shows.
POAS vs. ROAS — When the Difference Bites
Two ad sets, same client, same budget, same ROAS on the dashboard. Different stories underneath:
| Metric | Ad Set A High-Margin Skincare | Ad Set B Low-Margin Apparel |
|---|---|---|
| Ad spend | $5,000 | $5,000 |
| Revenue | $20,000 | $20,000 |
| ROAS | 4.0x | 4.0x |
| Gross margin | 70% | 25% |
| Gross profit | $14,000 | $5,000 |
| POAS | 2.8x | 1.0x |
| Verdict | Healthy — scale it | Break-even at best |
Identical ROAS (highlighted). The dashboard didn’t lie — it just didn’t tell you what mattered.
If you optimize on ROAS, both look identical. If you optimize on POAS, you scale Ad Set A and rebuild the catalog or creative for Ad Set B before scaling. The dashboard didn’t lie. It just didn’t tell you what mattered.
This is why DTC tools like Triple Whale, Northbeam, and ProfitMetrics now surface POAS as the default campaign metric and treat ROAS as a leading indicator. For agencies running clients with mixed-margin catalogs, optimizing on ROAS instead of POAS is the single biggest reporting mistake you can make in 2026.
How to Track POAS Without a Dedicated DTC Platform
POAS needs three data feeds in one place: ad spend (per campaign or ad set), revenue (per campaign or ad set), and gross margin (per SKU or category). The first two come from the ad platforms. The third usually lives in a Google Sheet or in Shopify analytics reports.
Inside Swydo, the workflow looks like this:
- Connect the ad accounts that drive ecommerce traffic — Google Ads, Meta Ads, TikTok Ads. Each becomes a data source you can pull revenue and spend from.
- Add a Google Sheets data source with one column per SKU or product category and one column for gross margin percentage. Update monthly when the client revises COGS.
- Build a Custom Metric that multiplies revenue by the margin column and divides by ad spend. That’s POAS — a calculated metric you can drop into a report or a Monitoring Board widget.
- Surface it on a per-client Monitoring Board so it updates daily without anyone touching the report.
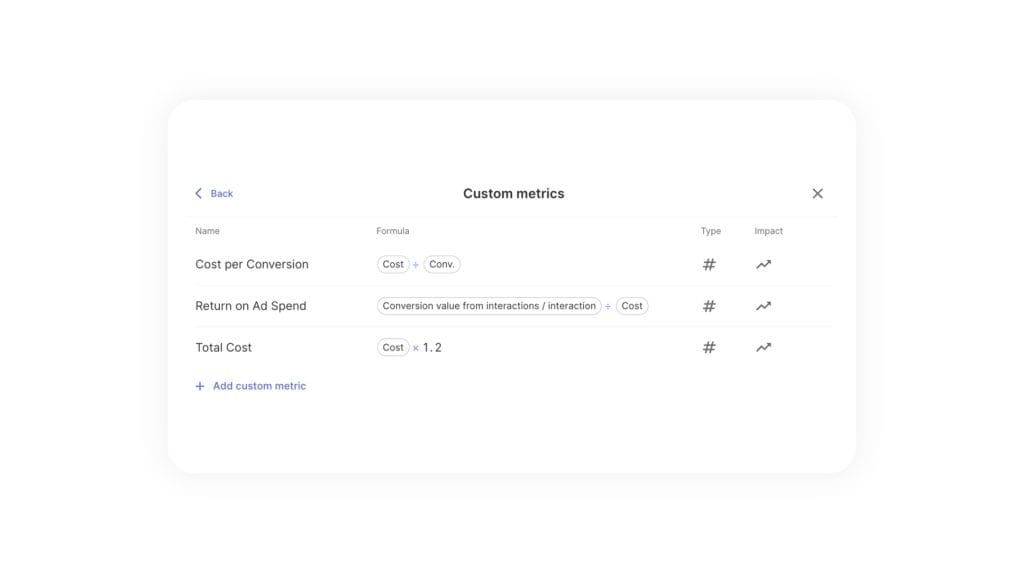
For POAS at the individual-channel level, this gives you a clean per-channel read — Google POAS, Meta POAS, TikTok POAS — side by side. For a single blended POAS across all channels at once, calculate it per channel here and use a Manual KPI to hold the combined figure, or read the channels individually. Either way the margin-aware number is on the board, which is the part that matters.
What Is MER (Marketing Efficiency Ratio) and When Should You Use It?
MER is Total Revenue divided by Total Marketing Spend across all channels. It’s the metric DTC operators use to sanity-check what the ad platforms are claiming. When iOS 14.5 broke Meta’s attribution in 2021, MER became the trust anchor for ecommerce reporting and hasn’t gone away.
The MER Formula
MER is sometimes called “blended ROAS” because the math is the same — it’s just measured at the business level rather than per channel.
A healthy DTC MER in 2026 is 3x to 5x at scale. Median across DTC brands is roughly 4x. Brands growing 30%+ year-over-year typically run blended ROAS around 3.8x; brands that have plateaued tend to sit closer to 2.1x. Below 2x is structurally unprofitable for most consumer brands.
MER vs. ROAS — Why the Two Numbers Disagree
Platform-reported ROAS is rising while business-reported MER is falling — and this gap has been widening since AI-driven bidding took over.
Performance Max now serves more than a million advertisers, according to Google. Advantage+ Sales Campaigns are Meta’s default across most objectives. Both systems use modeled conversions and aggressive last-click attribution, which means the ROAS they report often counts the same conversion twice across channels — once in Google, once in Meta — and gives partial credit for incrementality that would have happened anyway.
Result: Meta says ROAS is 3.5x. Google says ROAS is 5.2x. Total ad spend was $50,000 across both. Reported revenue from the two platforms combined: $260,000. Actual business revenue from Shopify: $150,000. The platforms over-counted by $110,000.
$50K ad spend across Meta + Google — what each side claims
Meta says 3.5x. Google says 5.2x. Blended MER tells the truth. ROAS doesn’t.
MER catches this. ROAS doesn’t. That’s why the operator class — Triple Whale, Northbeam, Common Thread Collective — runs business decisions on MER and treats platform ROAS as a leading signal only.
Sidenote. If you want a sharper read than MER alone gives you, run a holdout test — Meta Conversion Lift, Google Incremental Attribution, or a regional pause test for two weeks. MER catches over-attribution at the portfolio level; incrementality catches it at the channel level. They’re complementary, not competing.
How to Track Blended ROAS Across Channels in One Report
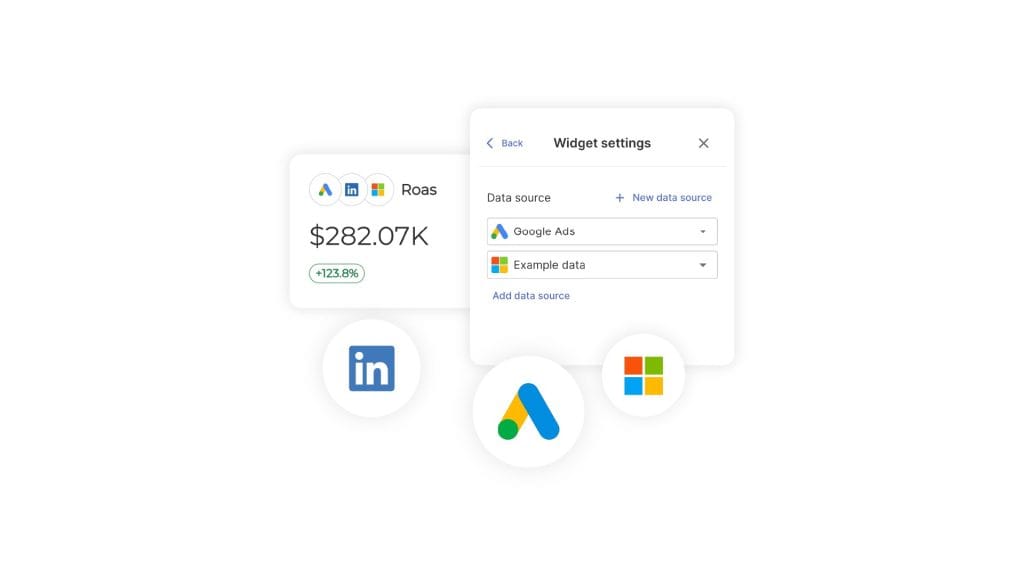
A blended ROAS / MER report needs total ad spend across every paid channel divided by total revenue from the ecommerce platform or CRM. Most reporting tools force you to build a separate widget per channel and add them up in your head. That’s how MER mistakes happen — and why blending data sources cleanly inside one widget matters more than agencies usually give it credit for.
Swydo’s Combined Data Sources widget — released May 2025, with ROAS added December 2025 — pulls spend, revenue, and ROAS from up to five ad platforms into a single widget. Pair it with a revenue source like, Google Ads, Linkedin Ads, Microsoft Ads, and you have a real MER number on a dashboard that updates daily. Because Combined Data Sources also works inside Monitoring Boards, Goals, and Alerts, the same blended number can drive your team’s daily view, not just the client report.
ROAS vs. ROI vs. POAS vs. MER — Which Metric Should You Use When?
Use ROAS for campaign optimization. Use POAS for ecommerce campaign optimization when SKU margins differ. Use MER for board-level health and CFO reporting. Use ROI for strategic decisions and retainer justification. These aren’t competing metrics — they’re four rungs of the Profitability Ladder, and reporting maturity is reporting all four.
ROAS
“Is this ad efficient?”
Best forDaily optimization, channel comparison
UpdateDaily
AudiencePPC / performance team
POAS
“Is this ad profitable per SKU?”
Best forEcommerce with mixed margins
UpdateDaily / weekly
AudienceEcom manager, strategist
MER
“Is the whole engine working?”
Best forBoard-level health check
UpdateWeekly
AudienceFounder, CMO, CFO
ROI
“Did marketing make money?”
Best forQuarterly reviews, retainers
UpdateMonthly / quarterly
AudienceC-suite, business owner
The mistake is reporting only one of these. ROAS-only reports overstate health for thin-margin clients. ROI-only reports lag too much to drive daily optimization. The agencies that retain clients longest run all four on a dashboard and decide which one to lead with based on the audience and the meeting.
When Should You Prioritize ROAS Over ROI?
Prioritize ROAS when the decision needs to happen today, the campaign is direct-response, and you’re comparing apples to apples across channels or ad sets. ROAS is the right metric for daily optimization, bid management, and cross-platform efficiency comparisons. Save ROI for the monthly business review.
Use ROAS for Direct-Response and Time-Sensitive Campaigns
A holiday flash sale needs hourly read on which ad sets are pulling weight. Wait three weeks for clean ROI data and the sale is over. ROAS gives you the read inside a day. Same logic for app install campaigns, ecommerce promotions, and lead-gen with a known cost-per-lead target.
Set up the basics first:
- Configure PPC tracking with monetary values per conversion on every platform.
- Implement Conversions API for Meta and Enhanced Conversions for Google — first-party server-side data lifts reported ROAS accuracy by 10–20% in most accounts, especially after the iOS opt-out reality.
- Use UTM parameters consistently across all platforms so cross-channel attribution lines up in GA4.
- Build automated ROAS reporting so you’re not pulling numbers manually every Monday.
Use ROAS for Cross-Channel Budget Allocation
When you’re deciding whether to shift $5,000 from Meta to Google next week, ROAS is the right lens — provided the products being promoted have similar margins. If margins differ across channels (a luxury skincare client running Meta on Tier 1 SKUs and Google Shopping on a clearance category), use POAS instead.
A workable starting allocation framework: 70% to proven channels, 20% to promising channels, 10% to experimental channels. Review weekly. Shift 5–10% of budget at a time based on ROAS performance. Don’t reallocate more than 20% in a single move — variance will trick you into chasing noise.
Use ROAS for Auction-Environment Bid Management
Performance Max, Advantage+, target-ROAS Smart Bidding — these all need a target ROAS to optimize against. Set it 10–15% above your true break-even ROAS to give the algorithm room to learn. Too aggressive and the platform won’t spend; too lax and you lose money on every conversion. A solid Google Ads optimization checklist keeps the rest of the account healthy enough that target-ROAS bidding has something to work with.
A client with 30% gross margin needs a 3.33:1 minimum ROAS just to break even on the ad spend alone — before any agency fee or overhead. Aim for 4:1 to have something left for everyone else.
For PPC clients specifically, our deep dive on the PPC metrics that actually drive optimization decisions has the full list — POAS, blended ROAS, and impression share among them.
When Should You Prioritize ROI Over ROAS?
Prioritize ROI when the decision is strategic, the program is integrated across funnel stages, and the audience is the business owner or CFO. ROI is the right metric for retainer renewals, budget planning, and answering “is marketing working?” at a board level. ROAS doesn’t survive that meeting because it doesn’t include your fees.
Use ROI for Integrated Marketing Programs
A campaign that mixes awareness (YouTube, display), consideration (content, webinars), and conversion (search, retargeting) cannot be evaluated on per-channel ROAS without lying about it. Search ROAS will look heroic because it’s harvesting demand the other channels created.
For example: a financial services client spends $50,000 across YouTube ($10K), content marketing ($15K), and Google Search ($25K). Search ROAS reads 7:1; YouTube ROAS reads 1.5:1. Cut YouTube? Probably not — when the analytics team modeled the full conversion paths, 65% of search conversions had first touched YouTube. ROAS hid the dependency. Program-level ROI surfaced it.
Use ROI for Retainer Justification and C-Suite Reporting
A CFO reviewing your retainer cares about two things: did the marketing investment return more than it cost, and is the trend going the right way. ROAS doesn’t answer either question because it doesn’t include your retainer in the denominator.
When you’re presenting to the C-suite, lead with ROI and let ROAS support the channel breakdown. The conversation goes like this: “Marketing returned 240% this quarter, up from 180% last quarter. Here’s where the gains came from” — followed by a per-channel ROAS table that shows the contribution mix. ROI is the headline; ROAS is the detail.
Use ROI for Long-Term Strategy and Compounding Channels
SEO, content, lifecycle email, and brand work all have payback periods measured in months, not days. ROAS, calculated weekly, will make these channels look like budget pits for the first two quarters. They’re not — they’re compounding. The right metric is rolling 12-month ROI with intermediate progress markers (organic traffic growth, email list growth, branded search volume).
A reasonable evaluation cadence by channel type:
| Channel type | Evaluation window | Primary metric |
|---|---|---|
| Direct-response paid (search, social, retargeting) | Daily / weekly | ROAS, POAS |
| Mid-funnel paid (paid social awareness, display) | 30 days | Assisted conversion ROAS, MER contribution |
| Brand and upper-funnel | Quarterly | MER trend, branded search volume |
| SEO and content | 6–12 months | ROI, organic traffic, leads from organic |
| Lifecycle email / SMS | Monthly | Revenue per recipient, contribution to MER |
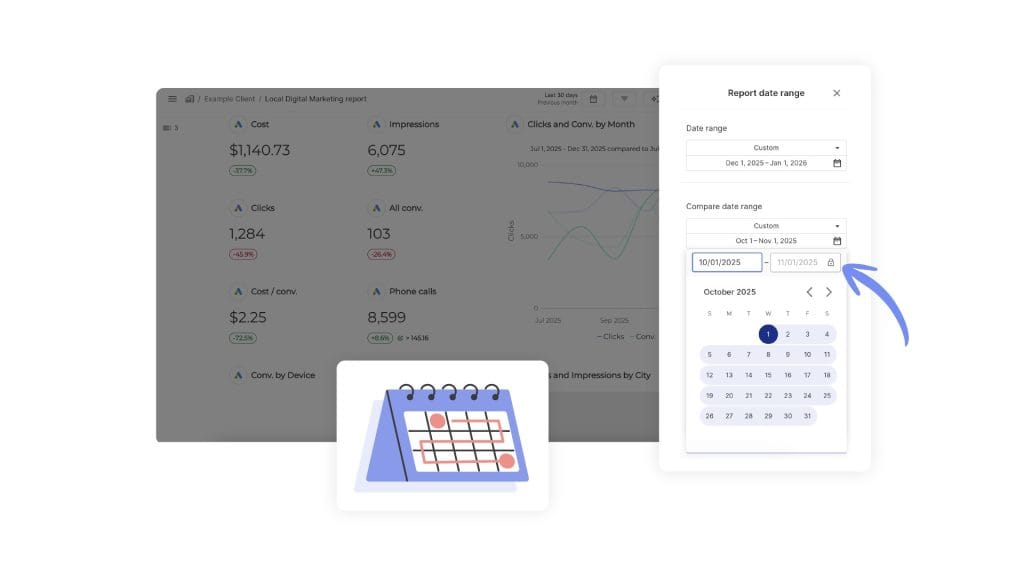
The awkward part of reporting on this many windows in one place is comparing periods that don’t match up — this quarter against last quarter is easy, this fiscal year against last fiscal year is easy, but Q4 against the full first half of the year breaks most reporting tools. Different-length date comparisons inside Swydo handle that: pick any start and end date for the current period, any start and end date for the comparison period, and the widget treats them as equivalent ranges. Useful when the channel-level reality doesn’t line up with calendar quarters.
What Are the Industry Benchmarks for ROAS in 2026?
Median ROAS in 2026 varies more by channel and vertical than by anything else. Google Ads runs a median 3.31x across verticals; Meta runs 2.19x; TikTok 1.41x; SEO 9.10x. Ecommerce averages 2.87x blended. Benchmark against the client’s vertical and channel mix, not against a generic “4:1 is good.”
Cross-Channel ROAS Medians
| Channel | Median ROAS | Notes |
|---|---|---|
| Google Ads | 3.31x | Across 33 verticals, Varos data 2025 |
| Meta Ads | 2.19x | Q1–Q2 2025, declining year-over-year |
| TikTok Ads | 1.41x | Rises to ~2.25x with Value optimization |
| Amazon Ads | 7.95x | Sponsored Products + Brands combined |
| Pinterest / X Ads | ~2.7x | Smaller spend bases, higher variance |
| SEO (organic) | 9.10x | B2B median, First Page Sage 2026 |
Ecommerce ROAS by Vertical
| Vertical | Average ROAS | Source |
|---|---|---|
| Apparel | 4.3x | Top quartile DTC benchmarks |
| Beauty/Skincare | 3.5x | Paid social median |
| Baby & Kids | 3.71x | DTC blended average |
| Home & Garden | 6.7x | Blended (high-margin) |
| Electronics | ~6.0x | Higher AOV offsets thinner margin |
| All-vertical median | 2.04x | Half of DTC stores below this |
| All-vertical average | 2.87x | Pulled down by thin-margin verticals |
The top quartile of DTC stores clears 4x. The bottom quartile sits below 1.8x. Seasonality is brutal: Q4 peaks 4–5x; January/February troughs at 2–2.5x.
SEO ROI and Break-Even by Industry
| Industry | SEO ROI (3-year avg) | Time to break-even |
|---|---|---|
| Real Estate | ~1,389% | 4–6 months |
| HVAC Services | ~1,254% | 5–7 months |
| Legal Services | ~1,200% | 9–12 months |
| Financial Services | ~990% | 9–12 months |
| Healthcare | ~890% | 9–12 months |
| 19-industry average | ~748% | ~9 months |
| Ecommerce | ~317% | 6–9 months |
SEO conversion rates run roughly 2.4% versus 1.3% for PPC, which compounds the long-term ROI advantage. For deeper SEO benchmarking, our guide on SEO metrics walks through what to track at each stage.
How to Calculate Your Client’s Break-Even ROAS
A generic benchmark only gets you so far. The real number you need is the break-even ROAS for this specific client, which depends entirely on their gross margin and the agency fees in play.
For a client at 40% gross margin: break-even ROAS = 1 ÷ 0.40 = 2.5x. They need every campaign to clear 2.5:1 just to not lose money on the ad spend. Add 0.5–1.0x cushion for agency fees, tools, and overhead — so the operating floor is around 3.0–3.5x.
Break-Even ROAS Calculator
Drag to your client’s gross margin. Break-even = 1 ÷ margin.
Break-even ROAS
2.5x
Floor with fees (+0.75x)
3.3x
Document this number in the client’s reporting setup. It’s the line below which campaigns should be paused for review.
How Do You Report ROAS, ROI, POAS, and MER to Clients Without It Becoming a Full-Time Job?
Stop building per-client reports from scratch. Build one master template per report type, link it across the client roster, and let the platform handle the data refresh. The agencies still copying numbers into Google Slides every month are losing 6–10 hours per client per month they could be spending on actual optimization. The whole approach is what client reporting best practices looks like once you’ve moved past spreadsheets.
A four-metric reporting setup that works for most agency clients:
- Master report template with one ROAS section per ad channel, one ROI section that includes your agency fees in the denominator, and one MER widget at the top showing blended performance. Build once, link to every client.
- Daily-monitoring dashboard for the metrics that need daily eyes — POAS by campaign for ecommerce clients, ROAS by channel for everyone else. The line between monitoring vs. reporting matters here: monitoring is for your team; reports are for the client.
- Goals set against the client’s actual break-even ROAS plus a cushion — not a generic 4:1 floor. Swydo’s Goals system shows On Track / Off Track / Achieved color-coded states so you don’t have to eyeball whether a campaign is pacing right.
- Alerts configured to email when ROAS drops below the floor for 7 days running, or when MER drifts more than 15% from the trailing 30-day baseline.
This is where client reporting software earns its keep. The agencies that pull cleanly automated ROAS, ROI, POAS, and MER into a branded dashboard and a scheduled email every Monday hold onto clients longer — because the client never has to ask “how are we doing?” The answer is already in their inbox by 8:00am. Even better if the email itself includes a short written summary of what moved — Swydo’s AI-generated Email Summaries drop into the scheduled-report email automatically and rewrite themselves each send, so the client gets the “what changed and why” before they click anything.
That recurring, scheduled, automated touchpoint is one of the most overlooked levers for client retention. Clients don’t leave agencies that consistently show them they’re winning.
If you’re running 20+ clients, the per-client view stops being the right starting point. A Metrics Overview screen across the entire roster shows ROAS, MER, and ROI as KPI tiles per client, color-coded against each client’s break-even threshold. Red tile → that’s the account to look at first on Monday. Green across the board → spend the morning on net-new acquisition instead. The benefits of a marketing analytics dashboard at the portfolio level mostly come down to this — seeing the whole book of business before you start the day.
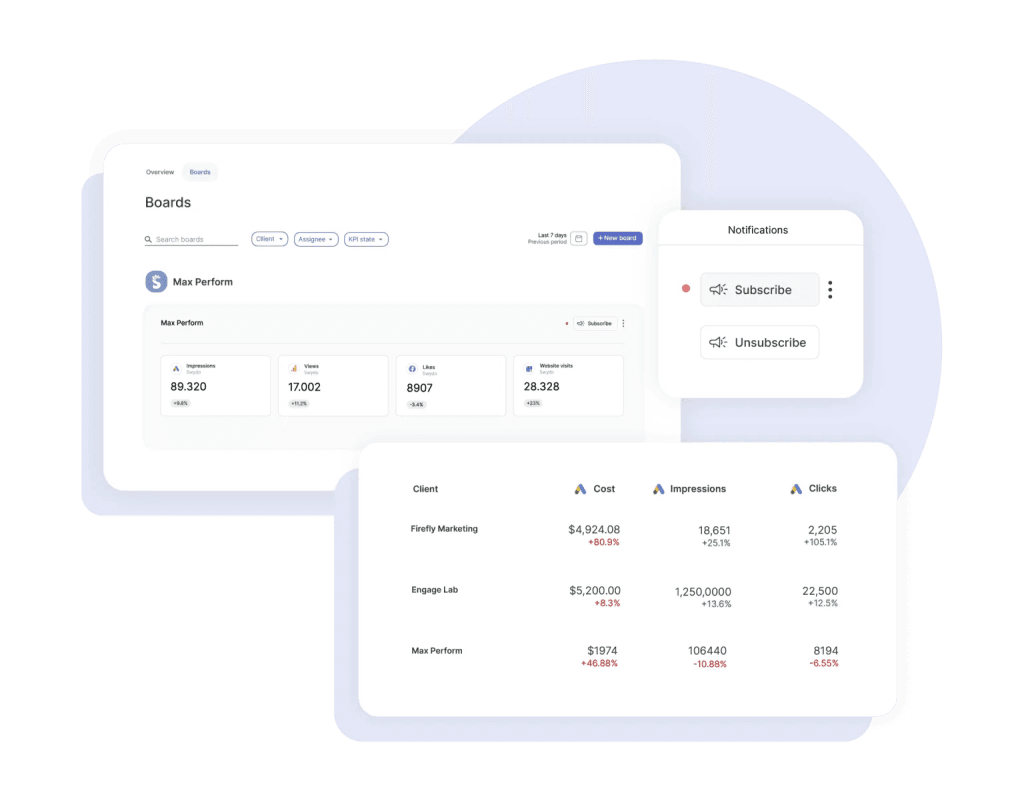
On cost: the flat rate includes 10 data sources — enough for a handful of clients running a few channels each — and the per-source fee drops as you add volume, so scaling up gets cheaper per account rather than more expensive. Seats are unlimited, and reporting frequency doesn’t change the price, so daily dashboards cost the same as monthly PDFs. Seasonal agencies can pause the subscription between busy periods rather than cancel and rebuild.
ROAS vs. ROI: Frequently Asked Questions
Direct answers to the questions agencies and marketers actually search
ROAS measures revenue per ad dollar. ROI measures profit per total marketing dollar. ROAS only includes ad spend in the denominator. ROI includes ad spend plus agency fees, tools, and creative — and uses profit instead of revenue.
A campaign can be efficient on ROAS and unprofitable on ROI at the same time. ROAS asks “is this ad efficient?” ROI asks “did this marketing make money?”
No. ROAS uses revenue ÷ ad spend. ROI uses (profit − total marketing investment) ÷ total marketing investment. ROAS is a ratio (4:1). ROI is a percentage (300%).
The two numbers can disagree sharply. A 5:1 ROAS on a 15%-margin product returns $0.75 in gross profit per ad dollar before fees. A 3:1 ROAS on a 70%-margin product returns $2.10. Same ROAS column on the report; one client makes money and the other doesn’t.
Yes — this is the most common reporting trap. ROAS ignores product margin and agency fees. A 5:1 ROAS on a thin-margin product can still lose money once COGS, shipping, agency retainer, and tools are factored in.
Break-even ROAS equals 1 ÷ gross margin. A client at 20% margin needs a 5:1 ROAS just to break even on the ad spend alone — before paying for anything else. That’s why ROAS-only reports overstate health for thin-margin clients.
ROAS stands for Return on Ad Spend. It’s a ratio that shows how much revenue an advertising campaign generates per dollar spent on ads.
A 4:1 ROAS means every $1 of ad spend produced $4 in revenue. It’s the standard efficiency metric for paid media and the default reporting metric inside Google Ads, Meta Ads, and TikTok Ads.
All three are correct and mean the same thing. 4:1, 4x, and 400% are identical — every dollar of ad spend returned four dollars in revenue.
Pick one format and use it consistently across every client report. Switching between formats between campaigns confuses clients and makes the reporting itself feel inconsistent. Ratio (4:1) is the most common in agency reports.
POAS stands for Profit on Ad Spend. It’s gross profit divided by ad spend. It’s ROAS adjusted for what actually arrives in the bank account after COGS, shipping, and payment fees.
POAS reads on the same scale as ROAS. A POAS of 2 means every ad dollar produced $2 in gross profit. A POAS below 1 means the campaign is losing money no matter what the platform shows.
MER stands for Marketing Efficiency Ratio. It’s total business revenue divided by total marketing spend across all channels. It’s also called “blended ROAS” — the math is identical.
MER became standard in DTC reporting after iOS 14.5 broke Meta’s attribution. It’s the trust anchor that catches platform over-attribution: if Meta and Google both claim the same conversion, MER exposes the double-counting because it uses actual business revenue, not platform-reported revenue.
ROAS = Revenue from Advertising ÷ Cost of Advertising.
Example: $10,000 in ad spend that generated $40,000 in sales = 4:1 ROAS. The basic formula doesn’t change across business models, but the numerator does — ecommerce uses sales revenue, lead-gen uses lead count × average lead value, and subscription uses new subscribers × average subscription value.
Lead-Gen ROAS = (Number of Leads × Average Lead Value) ÷ Total Ad Spend.
The hard part is establishing an honest average lead value. Use a rolling 90-day window of closed-won deals divided by leads generated in that window. Don’t use the sales team’s best-case projections — those inflate ROAS until renewal time when the actual numbers surface.
Subscription ROAS = (New Subscribers × Average Subscription Value) ÷ Total Ad Spend.
Decide upfront whether “average subscription value” means first month, first year, or full LTV. Three different numbers, three very different ROAS calculations. Document the choice in the report footer so the client doesn’t think you’re cherry-picking when the number changes.
ROI (%) = ((Net Profit from Marketing − Total Marketing Investment) ÷ Total Marketing Investment) × 100.
Net Profit = Revenue × Gross Margin minus variable costs tied to those sales. Total Marketing Investment = ad spend + agency fees + creative + tools + internal staff time. Worked example: $200K revenue at 70% margin = $140K profit; $50K total marketing investment; ROI = (($140K − $50K) ÷ $50K) × 100 = 180%.
Add the agency retainer to the denominator alongside ad spend. ROI = ((Net Profit − (Ad Spend + Agency Fees + Tools + Creative)) ÷ (Ad Spend + Agency Fees + Tools + Creative)) × 100.
Reporting ROI without your own fees in the denominator inflates the number — and CFOs catch it on the second renewal. It’s the same lie as a financial advisor reporting returns before their management fee.
POAS = Gross Profit ÷ Total Ad Spend.
Gross Profit = Net Revenue − COGS − Shipping/Fulfillment − Payment Gateway Fees − Discounts/Returns. POAS needs three data feeds: ad spend per campaign, revenue per campaign, and gross margin per SKU or category. The first two come from the ad platforms; the third usually lives in a spreadsheet or Shopify export.
MER = Total Business Revenue ÷ Total Marketing Spend Across All Channels.
Use actual business revenue from Shopify or the CRM — not the sum of platform-reported revenue from Google, Meta, and TikTok. Using platform totals defeats the point of MER, which exists specifically to catch the over-attribution that comes from platforms claiming the same conversion twice.
Break-Even ROAS = 1 ÷ Gross Margin.
A 40% margin client needs 1 ÷ 0.40 = 2.5x ROAS just to not lose money on the ad spend alone. Add 0.5–1.0x cushion for agency fees and overhead, so the practical floor lands around 3.0–3.5x. Document this number in the client’s reporting setup — it’s the threshold below which campaigns should be flagged for review.
| Gross Margin | Break-Even ROAS | Floor with Fees |
|---|---|---|
| 20% | 5.0x | 5.5–6.0x |
| 30% | 3.3x | 3.8–4.3x |
| 40% | 2.5x | 3.0–3.5x |
| 50% | 2.0x | 2.5–3.0x |
| 70% | 1.4x | 1.9–2.4x |
Yes, when SKU margins differ. ROAS treats a 70%-margin skincare sale and a 25%-margin apparel sale as identical when revenue matches. POAS doesn’t.
Two ad sets with identical $5,000 spend and $20,000 revenue both show 4:1 ROAS. But the skincare set returns $14,000 in gross profit (POAS 2.8x); the apparel set returns $5,000 (POAS 1.0x). Scaling both equally on ROAS scales a break-even campaign. Optimizing on POAS scales the winner and rebuilds the loser.
You need three data feeds in one place: ad spend per campaign, revenue per campaign, and gross margin per SKU.
The first two come from the ad platforms. The third lives in a Google Sheet with one column per SKU or category and a margin percentage column, updated monthly when COGS changes. Inside a reporting tool that supports custom metrics, build a formula that multiplies revenue by the margin column and divides by ad spend. That’s POAS, and it slots into any widget like a native platform metric.
Blended ROAS is total business revenue divided by total marketing spend across all channels. It’s the same metric as MER (Marketing Efficiency Ratio) — different name, identical math.
The naming is tribal: DTC operators say MER; agency-side often says blended ROAS. Whichever label you use, the point is catching over-attribution at the portfolio level by comparing actual business revenue to what the platforms claim they delivered.
There is no mathematical difference — they’re the same metric. Total revenue divided by total marketing spend across all channels.
DTC operators (Triple Whale, Northbeam, Common Thread Collective) standardized on “MER.” Agencies still often default to “blended ROAS.” Pick whichever term the client uses and stay consistent inside the report.
Because AI bidding systems use modeled conversions and aggressive last-click attribution, so the same conversion often gets counted twice — once in Google, once in Meta.
Real-world example: Meta reports 3.5x ROAS, Google reports 5.2x ROAS, total ad spend is $50K, and combined platform-reported revenue is $260K. Actual Shopify revenue is $150K. The platforms over-counted by $110K. MER catches this; per-channel ROAS doesn’t. Treat platform ROAS as a leading signal and run business decisions on MER.
3x to 5x at scale is healthy. Median is roughly 4x. Below 2x is structurally unprofitable for most consumer brands.
Brands growing 30%+ year-over-year typically run blended ROAS around 3.8x. Plateaued brands tend to sit closer to 2.1x. If MER is dropping while platform ROAS is rising, the platforms are inflating their attribution and the actual business is getting less efficient — not more.
Set up server-side conversion tracking: Conversions API for Meta, Enhanced Conversions for Google.
First-party server-side data lifts reported ROAS accuracy by 10–20% in most accounts. Pair it with consistent UTM parameters across all platforms so cross-channel attribution lines up in GA4. For a sharper read at the channel level, run periodic incrementality tests — Meta Conversion Lift, Google Incremental Attribution, or a two-week regional pause test. MER catches over-attribution at the portfolio level; incrementality testing catches it at the channel level.
3:1 is the rough industry break-even floor. 4:1 is healthy. 5:1+ is strong for direct-response, lower for awareness.
But “good ROAS” depends entirely on gross margin. A 5:1 ROAS on a 15%-margin product loses money. A 2:1 ROAS on an 80%-margin SaaS product makes money. Benchmark against the client’s vertical and margin profile, not a generic “4:1 is good” rule.
Median ROAS varies sharply by channel. Amazon and SEO compound; TikTok and Meta typically sit lower than Google.
| Channel | Median ROAS |
|---|---|
| Google Ads | 3.31x |
| Meta Ads | 2.19x |
| TikTok Ads | 1.41x (rises to ~2.25x with Value optimization) |
| Amazon Ads | 7.95x |
| Pinterest / X Ads | ~2.7x |
| SEO (organic) | 9.10x (B2B median) |
Median ecommerce ROAS is 2.04x. Average is 2.87x. Top-quartile DTC stores clear 4x. Half of all DTC stores operate below 2:1.
Seasonality is brutal: Q4 peaks at 4–5x while January and February trough at 2–2.5x. Compare the client’s number against their vertical — apparel and beauty land in different brackets than home goods or electronics.
| Vertical | Average ROAS |
|---|---|
| Apparel | 4.3x (top quartile) |
| Beauty / Skincare | 3.5x |
| Baby & Kids | 3.71x |
| Home & Garden | 6.7x |
| Electronics | ~6.0x |
| All-vertical median | 2.04x |
5:1 (500%) is the most-cited benchmark for strong marketing ROI. Mature B2B programs typically land 3:1 to 8:1. Direct-response ecommerce ROI runs lower because margins are thinner.
SEO is the outlier with a long payback period and very high compounding ROI once it kicks in. Average SEO ROI across 19 industries is roughly 748% on a 3-year window, with break-even around 9 months.
SEO ROI ranges from ~317% (ecommerce) to ~1,389% (real estate) on a 3-year window. Average across 19 industries is around 748%.
SEO conversion rates run about 2.4% versus 1.3% for PPC, which compounds the long-term advantage. The trade-off is patience: break-even sits between 4 and 12 months depending on the vertical.
| Industry | SEO ROI (3-yr avg) | Break-Even |
|---|---|---|
| Real Estate | ~1,389% | 4–6 months |
| HVAC Services | ~1,254% | 5–7 months |
| Legal Services | ~1,200% | 9–12 months |
| Financial Services | ~990% | 9–12 months |
| Healthcare | ~890% | 9–12 months |
| Ecommerce | ~317% | 6–9 months |
Set target ROAS 10–15% above the client’s true break-even ROAS.
Too aggressive and Performance Max or target-ROAS Smart Bidding won’t spend. Too lax and you lose money on every conversion. If the client’s break-even is 3:1, set the target around 3.3–3.45x and give the algorithm 2–3 weeks to learn before adjusting. Sudden target changes reset the learning phase.
Use ROAS for daily campaign optimization. Use POAS for ecommerce campaigns with mixed margins. Use MER for weekly health checks. Use ROI for strategic and CFO-level decisions.
These aren’t competing metrics. They’re four rungs of the same Profitability Ladder, and reporting maturity means running all four — not picking one and calling it complete.
| Metric | Question it answers | Cadence | Audience |
|---|---|---|---|
| ROAS | Is this ad efficient? | Daily | PPC team |
| POAS | Is this ad profitable per SKU? | Daily / weekly | Ecom strategist |
| MER | Is the engine working? | Weekly | Founder, CMO |
| ROI | Did marketing make money? | Monthly / quarterly | CFO, owner |
When the decision needs to happen today, the campaign is direct-response, and margins are similar across channels.
Use ROAS for flash sales, app installs, bid management, and cross-channel budget shifts. Holiday campaigns can’t wait three weeks for clean ROI data. ROAS gives a usable read inside a day.
When the decision is strategic, the program spans multiple funnel stages, and the audience is the business owner or CFO.
An integrated campaign mixing YouTube, content, and search can’t be evaluated on per-channel ROAS without lying. Search ROAS will look heroic because it’s harvesting demand the upper-funnel channels created. Cut YouTube on its 1.5:1 ROAS and search performance often collapses next quarter. Program-level ROI surfaces the dependency that ROAS hides.
Different metrics, different cadences.
- ROAS: Daily for direct-response campaigns.
- POAS: Daily or weekly for ecommerce.
- MER: Weekly as a portfolio-level health check.
- ROI: Monthly or quarterly for strategic decisions.
Running all four on the same cadence wastes cycles and creates noise that drowns out the signal. Brand campaigns get evaluated quarterly; SEO and content on a 6–12 month rolling ROI.
Include every cost tied to running the marketing program. Ad spend, agency retainer, creative production, content production, tools and software, internal marketing salaries, freelancers, and platform fees.
Don’t include rent, utilities, or unrelated overhead — those aren’t marketing costs. The line is whether the expense would exist if marketing stopped. If yes, it’s overhead. If no, it belongs in the ROI denominator. Apply this consistently across reporting periods so quarter-over-quarter comparisons stay honest.
Match the headline metric to the audience.
- Daily PPC sync: Lead with ROAS by campaign.
- Ecommerce strategist call: Lead with POAS.
- CMO or founder weekly: Lead with MER.
- Quarterly business review: Lead with ROI.
In a C-suite review, the conversation goes: “Marketing returned 240% this quarter, up from 180% — here’s where the gains came from,” followed by a per-channel ROAS table for detail. ROI is the headline; ROAS is the supporting evidence.
The Profitability Ladder is a four-rung framework that climbs from tactical to strategic metrics — ROAS, POAS, MER, ROI — by adding more cost-side reality at each step.
Each rung answers a different question for a different audience. Implementation order: confirm the client’s break-even ROAS first (Rung 1), layer in POAS for ecommerce campaigns (Rung 2), add MER at the board level (Rung 3), close the loop with quarterly ROI (Rung 4).
| Rung | Metric | Formula |
|---|---|---|
| 1 | ROAS | Revenue ÷ Ad Spend |
| 2 | POAS | Gross Profit ÷ Ad Spend |
| 3 | MER | Total Revenue ÷ Total Marketing Spend |
| 4 | ROI | (Net Profit − Investment) ÷ Investment |
Build one master template per report type and link it across the client roster.
Agencies copy-pasting numbers into Google Slides lose 6–10 hours per client per month they could spend on actual optimization. A working four-metric setup: one ROAS section per ad channel, one ROI section with agency fees in the denominator, one MER widget at the top, and a daily monitoring dashboard for POAS or ROAS by campaign. Configure goals against each client’s break-even ROAS — not a generic 4:1 floor — and set alerts when ROAS drops below the floor for 7 days running or MER drifts more than 15% from the trailing 30-day baseline.
What to Do Next
Pick the metric your client actually needs based on what’s about to be decided. Daily campaign tuning → ROAS. Ecommerce campaign tuning with mixed margins → POAS. Quarterly business review → ROI. Weekly health check across the whole marketing engine → MER. Most agencies need all four on one dashboard, not one of them on four dashboards.
The reporting setup that wins client renewals is the one where the client never has to ask “how are we doing?” because the answer arrives automatically every Monday, the numbers tie back to the gross margin and agency fees that actually move their business, and the trend is visible at a glance. That’s the bar. Everything else is decoration.
If you’re rebuilding your marketing reporting from scratch, the order that works is the Profitability Ladder in sequence: confirm the client’s break-even ROAS first (Rung 1), then layer in POAS for ecommerce campaigns (Rung 2), then add MER at the board level (Rung 3), then close the loop with quarterly ROI (Rung 4). Build the templates once, link them across clients, and let automation do the data refresh. The hours you save go into the optimization work that actually moves ROAS up — which is what you’re being paid for in the first place.
Put ROAS, POAS, MER, and ROI on one client dashboard that updates itself.
Start Your Free Trial Today