
When your marketing data looks bad, tell your client the truth—but tell it with structure. Lead with what happened. Explain why. Then walk them through what you’re doing about it right now.
That’s the short answer. But if you’ve ever been on a reporting call where the numbers tanked and your stomach dropped, you know the short answer isn’t enough. You need the words, the timing, the frameworks, and—honestly—the confidence to deliver a tough message without losing the relationship.
Here’s the thing most agencies get wrong. They assume bad results are what cost them clients. But that’s not what the data says. An UpCity survey found that 80% of clients who leave agencies point to poor communication as the reason. Not poor performance. Communication. And the Setup Marketing Relationship Survey 2025 backs it up—across 400+ brand respondents, “dissatisfaction with delivery” ranked as the top departure driver at 48%. Pricing ranked sixth.
So what does that mean for you? It means the conversation around the data matters more than the data itself. And right now, that conversation is harder than it’s ever been.
Why Reporting Is Harder Right Now Than It’s Ever Been
You’re not imagining it. The data you’re working with today is messier, less complete, and harder to explain than even two years ago. Three things happened at once, and they’re all hitting your reporting calls.
| What Changed | The Impact | Source |
|---|---|---|
| Only ~31% of users accept tracking cookies | ~70% of your client’s web traffic is invisible to traditional tools | Cometly 2026 |
| AI Overviews appear in 25.8% of U.S. searches | Organic CTR dropped 61% when AI Overviews show up | Seer Interactive / Dataslayer |
| Meta made 83 platform changes in 2025 | One major ad platform update every 4.4 days | Dataslayer / Jon Loomer |
| Instagram organic reach fell 30–40% | Even strong content is reaching fewer people | ALM Corp |
| 42% of marketers expect budget cuts in 2026 | Every underperforming metric feels like a bigger deal | eMarketer |
Look at that table for a second. Your SEO traffic could be down because Google is answering queries before anyone clicks. Your Meta ads could be volatile because the platform changed its rules twice this week. Your tracking could be underreporting by 30% because most users never opted in.
And your client just sees a red arrow pointing down.
That gap between what’s actually happening and what the dashboard shows? That’s the gap you need to fill. And how you fill it is what separates agencies that keep clients from agencies that lose them.
The Formula: Own It, Explain It, Fix It
Think about this like a pilot talking to passengers during turbulence. If the captain goes quiet, everyone panics. If the captain says “Don’t worry about it,” while the plane is clearly shaking, nobody believes them. But if the captain says, “We’re hitting some rough air. I’ve adjusted our altitude and we’ll be through it in about ten minutes”—people relax. Not because the turbulence stopped. Because someone credible acknowledged it and had a plan.
That’s your job on every tough reporting call. Acknowledge, diagnose, act. The question is how you actually put that into words when you’re staring at a screen with your client’s face on it and a chart trending down behind you. The good news: you don’t have to invent the language from scratch. A handful of proven openers, used by senior account leads across the industry, will carry you through almost any tough call.
Four Scripts You Can Use Right Now
Four Scripts for Tough Calls
Pick the Right Opener for the Moment
Each one solves a different problem. Match the script to the conversation you’re walking into.
When the news is serious
The Direct Opener
“I have some challenging numbers to share. Here’s what the results are, here’s why we believe this happened, and here’s what we recommend doing about it.”
Why it works: Signals the type of conversation up front. Dragging it out builds anxiety, not reduces it.
When you need to give context
The Contextual Narrative
“We saw a dip this month. We dug in, identified the root cause, and we’ve already adjusted our strategy and set up monitoring to catch similar shifts faster.”
Why it works: Acknowledge, diagnose, fix — in one sentence. Client thinks “they’re on top of this.”
When the industry is down too
The Benchmark Frame
“Our numbers dropped 15%. The industry dropped 30%. Here’s the specific cause, and here’s the fix we’ve already deployed.”
Why it works: Reframes a loss as relative outperformance. Same data, completely different emotional response.
When you need to rebuild trust
The Empathetic Redirect
“I’m disappointed by these numbers too. Let’s walk through what happened and figure out the next move together.”
Why it works: Shifts the dynamic from vendor-explaining-a-problem to partner-solving-one.
1. The Direct Opener
This comes from Holly Green, one of roughly 90 marketing professionals surveyed in a Databox expert roundup. Her formula is simple and it works:
“I have some challenging numbers to share. Here’s what the results are, here’s why we believe this happened, and here’s what we recommend doing about it.”
No preamble. No warm-up. You signal that it’s a serious conversation, share the data, then move straight to diagnosis and action. Why does this work? Because your client’s brain needs to know what kind of conversation this is before it can process details. Dragging it out doesn’t reduce anxiety. It builds it.
2. The Contextual Narrative
Raw numbers without context just generate anxiety. Instead of “Organic traffic dropped 22%,” try the approach MetricsWatch recommends:
“We saw a dip in organic traffic this month. We dug in, identified the root cause—a Google core update that hit this content category industry-wide—and we’ve already adjusted our strategy and set up monitoring to catch similar shifts faster.”
See what happened there? You acknowledged the problem, diagnosed it, and showed you’re already fixing it. Your client walks away thinking “They’re on top of this” instead of “They let this happen.”
3. The Benchmark Frame
Sometimes the best thing you can say is: “Our numbers dropped, but less than everyone else’s.” in our KPI vs Metrics article, which recommends building context around the data—don’t just report the drop, show what it looks like relative to the industry, identify the specific cause, and explain the fix you’ve already deployed. A 15% revenue decrease sounds bad. A 15% decrease when the industry dropped 30%, caused by a specific checkout friction issue you’ve already solved? That sounds like an agency doing its job.
4. The Empathetic Redirect
This one is underrated. Kim Kaupe, in a BusinessCollective roundup, suggests telling your client you’re disappointed too. It sounds small but it changes the dynamic completely. When you show you’re emotionally invested—not just professionally obligated—the conversation shifts from adversarial to collaborative. You’re not the vendor explaining a problem. You’re the partner working through one.
Whichever approach fits your situation, run every data point through the “So What?” test. Every number should answer one of two questions: “We did this and the result was that,” or “We noticed this and here’s what we’re doing.” If a metric doesn’t answer either question? Cut it. During a bad month, extra noise just looks like padding.
What to Stop Saying Immediately
Have you ever noticed how easy it is to talk to clients when things are going well? The emails flow, the calls are fun, everything is smooth. But the minute performance dips, communication slows down. Or gets defensive. Or just… stops.
Growth Rocket calls this the biggest agency communication failure. And they’re right. Going quiet during a rough month tells your client one thing: you’re afraid to tell them something. That thought is more damaging than any number on a report. But silence isn’t the only way agencies sabotage themselves. There are specific phrases that show up on tough calls over and over—phrases that feel safe in the moment but quietly erode trust every time you use them.
Phrases You Need to Drop
| Stop Saying This | Why It Hurts You |
|---|---|
| “The results speak for themselves.” | They don’t. If they did, your client wouldn’t need you. Your job is to interpret and strategize, not point at a dashboard. |
| “We just need more budget.” | Without data to back it up, this sounds like you’re asking for a bigger safety net instead of solving the problem. |
| “It’s the algorithm’s fault.” | Even when it’s true, it sounds like an excuse. Explain the specific change, show the industry-wide impact, and present your plan. |
| “These are just vanity metrics.” | Dismissing what your client cares about signals disrespect. Redirect to better KPIs in a strategy session, not during a bad report. |
| “We” for wins, “the campaign” for losses | Clients notice this ownership shift instantly. Use “we” for everything—good months and bad ones. |
And here’s one more that deserves its own mention. The “compliment sandwich.” You know the one: good news, bad news, good news. It feels safe but it’s been thoroughly debunked. UC Riverside researchers found it mostly benefits the person delivering the news, not the one receiving it. Karen MacMillan at Ivey Business School confirmed in 2025 that it just teaches clients to brace themselves whenever they hear praise. And Roger Schwarz argued in Harvard Business Review that it actually damages both the feedback and the relationship.
So if you’re starting every bad month with “But look, email open rates were great!”—your client has already learned that any good news from you is a warning siren for what’s coming next.
Why Your Client Reacts the Way They Do
5 Biases Shaping Your Reporting Calls
Your Client Isn’t Just Hearing the Numbers
They’re filtering them through cognitive biases that have nothing to do with marketing. Here’s how to work with them — not against them.
Negativity Bias
One bad month can erase eleven good ones in your client’s memory.
The FixAddress bad data before they find it themselves. Surprise makes it worse.
Loss Aversion
Losses feel roughly 2x more painful than equivalent gains feel good.
The FixReframe: “We maintained 70% of traffic” lands better than “We lost 30%.”
Anchoring
The first number your client sees becomes the reference point for everything else.
The FixLead with industry benchmarks. Then share your client’s numbers.
Recency Bias
Clients overweight the latest month and forget the broader trend.
The FixPair every monthly snapshot with trailing averages and cumulative performance.
The MUM Effect
Your team unconsciously softens bad news before it ever reaches the client.
The FixShare raw data alongside interpretation — never replaced by it.
Ever delivered the same bad news to two different clients and gotten completely opposite reactions? That’s not random. Your clients are processing data through cognitive filters that have nothing to do with marketing. Understanding these filters changes how you frame every report.
Psychologists have spent decades studying how people react to negative information—and five specific biases show up in nearly every tough client call. Once you can spot them, you can design your reports and conversations to work with human psychology instead of against it.
Five Biases That Shape How Clients Hear Bad News
- Negativity bias means one bad month can erase eleven good ones in your client’s memory. Negative experiences carry disproportionate psychological weight. The fix? Address bad data before they find it themselves. Surprise makes it worse.
- Loss aversion, documented by Daniel Kahneman, means losses feel roughly twice as painful as equivalent gains feel good. So a 10% drop in conversions stings way more than a 10% increase pleases. Instead of “We lost 30% of traffic,” try “We maintained 70% of traffic while the industry average dropped 45%.” Same data. Completely different emotional response.
- Anchoring means the first number your client sees becomes their reference point for everything else. If you open with a big negative number, even your wins get filtered through that lens. Show industry benchmarks first. Then share your client’s numbers. The context changes everything.
- Recency bias makes clients overweight the latest month and forget the broader trend. A rough February erases a great January through December. Always pair monthly snapshots with trailing averages and cumulative performance.
- The MUM effect (Minimizing Unpleasant Messages) explains why your team instinctively softens bad news before it reaches the client. This happens unconsciously. Build systems where raw data gets shared alongside interpretation—not replaced by it.
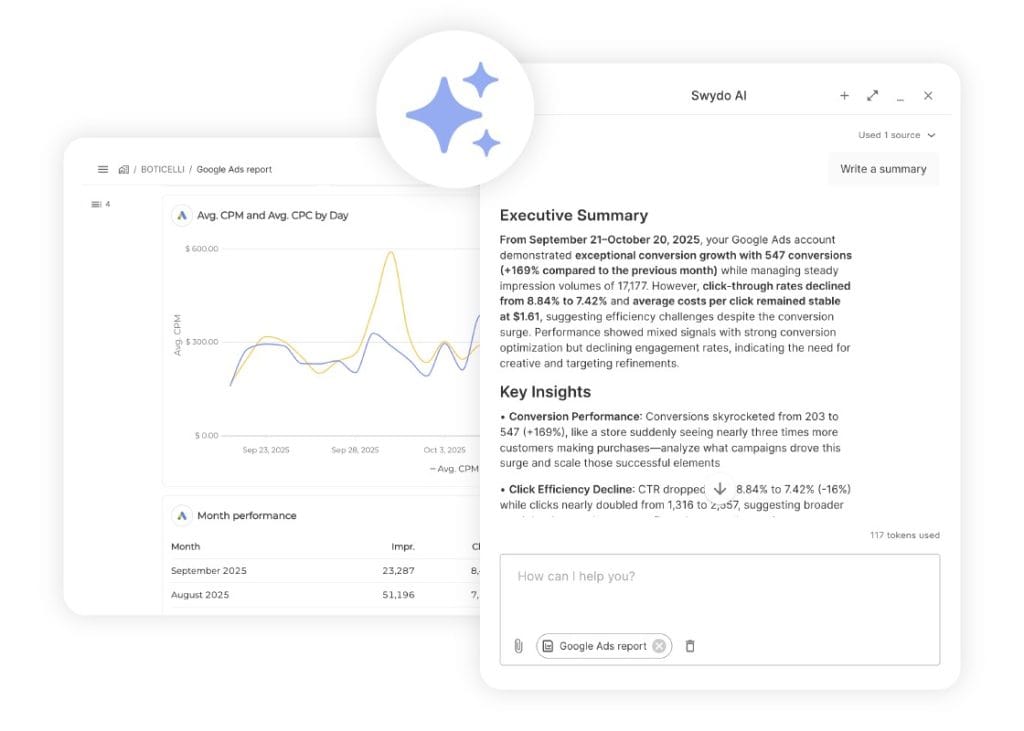
How many of these are showing up in your reporting calls right now? Even being aware of them changes how you structure the conversation. This is also where a reporting tool earns its keep—the right platform lets you pair every metric with commentary right next to the chart, so context and data land together instead of leaving the client to interpret a raw number on their own.
Swydo, for example, lets you drop written narrative directly into reports and uses AI to draft a first pass at “wins,” “issues,” and “recommendations” you can edit before sending. It’s the difference between handing over a dashboard and handing over a story.
Four Frameworks That Give the Conversation Structure
Scripts are great for knowing what to say. But frameworks give you a repeatable structure so your whole team can handle these calls—not just your most senior account manager. Four frameworks have earned their place in agency playbooks because they each solve a different problem: one for complex emotional conversations, one for strategic pivots, one for single-metric issues, and one for the courage to say the hard thing in the first place. Here’s when to reach for each.
SPIKES Protocol
Originally developed at MD Anderson Cancer Center for delivering difficult diagnoses, this is the most tested bad-news framework in existence. Here’s how it translates to your client calls:
| Step | What It Looks Like in an Agency Context |
|---|---|
| S – Setting | Choose the right format. Significant issues need a dedicated video call, not a mention at the end of a routine check-in. Have your data and diagnosis ready before the call starts. |
| P – Perception | “How do you feel the campaign performed this month?” Ask before you present. This surfaces misalignments early and lets you calibrate your delivery. |
| I – Invitation | Gauge how much detail they want. Some clients need the granular breakdown. Others just want the summary and the plan. |
| K – Knowledge | Give a brief warning shot: “I have some challenging numbers to walk through.” This lets their brain shift into processing mode instead of being blindsided. |
| E – Emotions | “I understand this is disappointing given your investment.” Validation isn’t agreement—it’s empathy. It’s the fastest path from reaction to productive conversation. |
| S – Strategy | “Here’s our 30-day pivot with three specific tests. I’d like your input on prioritization.” Make the plan collaborative. |
Reason-Options-Choose (R-O-C)
Agency consultant Karl Sakas built this one specifically for agency-client conversations. It’s simpler than SPIKES and works well for strategic pivots. Give the reason results fell short. Present two or three options with clear trade-offs. Let the client choose. Why does this matter? Because when your client picks the path forward, they own the recovery plan with you. They’re a partner in the solution, not a critic of the problem.
BEAR Model
The BEAR framework is useful when you need to address one specific metric. Behavior: “CTR dropped from 2.1% to 0.8% over four weeks.” Effect: “That means our CPA is running 62% above target.” Alternative: “We recommend shifting to the video formats that tested well in Q1.” Result: “Based on similar pivots, we project return to target within three weeks.” Clean, complete, and forward-looking.
Radical Candor
Kim Scott’s framework, discussed in agency contexts by Creativebrief, maps the danger zone perfectly. The biggest agency failure isn’t being too harsh—it’s being too nice. Scott calls it “Ruinous Empathy.” You care about the relationship so much that you avoid hard truths. You soften the data. You hint at problems instead of naming them. The short-term comfort feels right. But the long-term result is a client who gets blindsided by reality and blames you for not speaking up sooner.
Ask yourself: are you being kind and clear? Or just kind?
When to Say It, Where to Say It, and How to Structure the Report
Knowing what to say is only half the battle. The other half is deciding when to bring it up, which channel to use, and how to lay out the report itself so your client is set up to hear the message. These three choices—timing, channel, and structure—quietly shape every tough conversation before you even open your mouth.
Timing: Be First. Always.
Your client should never discover a problem before you do. Communicate issues the moment you find them. And don’t surprise clients with bad news during a meeting. Share results in advance. Let them absorb it. Then discuss context on the call.
Here’s what the ideal protocol looks like:
- Send a brief heads-up email with the key data point and a note that you’re already digging into root causes
- Schedule a detailed discussion within 24–48 hours
- Follow up with a written summary documenting every commitment you made on the call
Being first is mostly about systems, not hustle. If you’re waiting for month-end to discover a drop, you’ve already lost the timing battle. This is where automated monitoring and alerts become a genuine competitive advantage—tools like Swydo let you set KPI thresholds that ping you the moment a metric crosses into trouble, so you can reach out to the client before they even notice. The agency that emails first looks proactive. The agency that responds to the client’s angry email looks reactive. Same facts, completely different relationship.
Choosing the Right Channel
The medium you pick signals how seriously you take the situation. Use phone or video when the message is emotionally significant. Defaulting to email for tough conversations makes you look like you’re avoiding the hard talk.
| Situation | Right Channel |
|---|---|
| Minor metric dip within normal variance | Written report with a contextual annotation explaining the dip |
| Significant campaign underperformance | Dedicated video call where you can read reactions, answer questions in real time, and show empathy through tone |
| Major failure, budget issue, or strategic pivot | Immediate video call followed by a detailed written summary of everything discussed and committed to |
Report Structure That Works for Bad Months
The best approach is a three-phase process: send the report 24–48 hours before the meeting, do a live video walkthrough where you narrate the story behind the numbers, then follow up with a summary email. Never send a dashboard without interpretation. Numbers without narrative are just noise.
Your Client’s Personality Type Changes Everything
The 4 Client Personality Types
Which of Your Clients Is Which?
The same bad-news delivery lands four different ways. Match your approach to the personality, not your own comfort zone.
The Bulldozer
Type-A · Hands-on · Demanding
Warning Sign
Jumps into micromanaging the moment performance drops.
Approach: Come over-prepared. Show plans, anticipate objections, demonstrate expertise. They respect competence.
The People Pleaser
Conflict-averse · Says everything’s fine
Warning Sign
Absorbs frustration silently — then terminates out of nowhere.
Approach: Don’t take reassurances at face value. Use written goals, check against them, loop in their boss periodically.
The Team Player
Collaborative · Fair · Transparent
Warning Sign
Rare red flags — but don’t take them for granted.
Approach: Bring them into strategic thinking. Treat as real partners — they become your best references.
The Silent Partner
Quiet · Hands-off · Hard to read
Warning Sign
Goes into “ghost mode” when unhappy. Fewer replies. Skipped calls.
Approach: Set structured cadences from day one. Treat any change in responsiveness as a red flag.
Have you ever given the same update to two clients and had completely different outcomes? One appreciated your transparency. The other went cold. That’s not about the data. It’s about the person.
Agency consultant James Critelli, writing in Nail It and Scale It, identifies four personality types from hundreds of client engagements. Each one needs a different approach.
- The Bulldozer is Type-A, hands-on, and jumps into micromanaging the moment performance drops. The fix? Come over-prepared. Show plans, anticipate objections, demonstrate expertise. They respect competence. Show it.
- The People Pleaser is your highest churn risk, and you’d never know it. They say everything’s fine. They absorb frustration silently. Then they terminate out of nowhere. Don’t take reassurances at face value. Use written goals and check against them. Loop in their boss periodically.
- The Team Player gives you fair timelines and values transparency. Bring them into the strategic thinking. These clients become your best references when treated as real partners.
- The Silent Partner goes into “ghost mode” when unhappy. Fewer replies. Shorter emails. Skipped calls. By the time you notice, they’re halfway gone. Set structured cadences from day one and treat any change in responsiveness as a red flag.
Which of your current clients falls into each category? And more importantly—are you communicating with them the way they need, or the way that’s comfortable for you?
When “Bad Data” Isn’t Actually Bad
Sometimes the most valuable thing you can do is redefine what “bad” even means. Because right now, a lot of data that looks bad is actually a measurement problem, not a performance problem. Four patterns account for most of these misreads. Learn to spot them, and you’ll save yourself from apologizing for results that were never actually failures.
Seasonality
Opteo frames it well: “A dip in sales before Black Friday is expected. Customers are holding out for deals. We saw the same pattern last year.” Always compare year-over-year. Month-over-month comparisons during seasonal periods will mislead you every time.
Attribution Collapse
This might be the most important thing you explain to clients right now. According to Direct Agents, 73% of marketers report significant attribution difficulties since iOS 14.5. Your customers are interacting with an average of 9.5 touchpoints before converting. Last-click attribution—still the default in most dashboards—massively undervalues top-of-funnel work. The numbers aren’t wrong because your strategy is wrong. They’re wrong because the measurement tools can’t keep up.
Lag Indicators
SEO takes three to six months. Brand campaigns influence purchase behavior on timelines that don’t match monthly reports. If you launched a content strategy six weeks ago and someone asks why it’s not converting yet—that’s not a failure. It’s physics. Show clients the leading indicators (engagement, branded search, qualified traffic) that predict the lagging ones (revenue, conversions) they’re waiting for.
Platform-Level Shifts
ChatGPT accounts for an estimated 20% of search-related traffic worldwide. Gartner projects 25% of organic search traffic will move to AI tools by end of 2026. When an entire channel shifts, you don’t apologize. You explain the shift, show that it’s hitting competitors the same way, and present your adaptation plan.
The Measurement Tools That Actually Work Right Now
Old attribution is breaking down. So what do you use instead? Three methods are emerging as the new standard, reported by eMarketer and PMG.
- Marketing Mix Modeling (MMM) uses historical data to show how each marketing input contributes to outcomes. About 46.9% of marketers are increasing MMM investment right now. Google’s Meridian and Meta’s Robyn have made it accessible for mid-size agencies for the first time.
- Incrementality testing measures only conversions that wouldn’t have happened without the ad. About 52% of marketers use some form of it. This is powerful because it answers the question your client actually cares about: “Is this spend doing anything we wouldn’t get for free?”
- Server-side tracking and enhanced conversions recover 10–25% of previously lost data by sending first-party info directly to ad platforms, bypassing browser restrictions. Showing clients you’re recovering lost data proves you’re closing the measurement gap—not just complaining about it.
When you present these to your client, frame it as a “cone of confidence.” Here’s what you can directly observe. Here’s what you’re modeling with reasonable confidence. And here’s where you’re making directional judgments. That’s not hedging. That’s honest, sophisticated measurement—and it’s far more useful than pretending any single dashboard number is gospel.
Why Clients Actually Leave (It’s Not What You Think)
Why Clients Leave Agencies
Pricing Isn’t the Problem. Communication Is.
Top reasons clients cite for leaving their agency, ranked by frequency.
Lack of proactive strategic guidance
68%
Poor communication and transparency
57%
Inability to demonstrate value
53%
Relationship deterioration
49%
Dissatisfaction with delivery
48%
Pricing
37%
The takeaway: The top four reasons clients leave are all about how you show up — not what you charge. Every tough reporting call either strengthens or erodes these four areas.
The Setup Marketing Relationship Survey 2025 found that 40% of clients plan to switch agencies within six months. But look at why they leave, compiled by Swydo, in our retention strategies article:
- Lack of proactive strategic guidance: 68%
- Poor communication and transparency: 57%
- Inability to demonstrate value: 53%
- Relationship deterioration: 49%
- Pricing: only 37%
See the pattern? Pricing is sixth. The top four are all about how you communicate and show up. And the math on retention is overwhelming: acquiring a new client costs 5–25x more than keeping one (Bain & Company). A 5% bump in retention can boost profits by 25–95%. Existing clients spend 67% more. Referrals from happy clients generate a third of new business.
Every bad-data conversation is either strengthening or eroding this. Which one is happening in your calls right now?
The Recovery Playbook: Before, During, and After
A tough reporting call isn’t a single moment—it’s a sequence. What you do in the 48 hours before the meeting shapes how the conversation lands. What you do during the meeting determines whether your client leaves with confidence or dread. And what you do after is what actually rebuilds trust. Treat all three phases like they matter equally, because your client will.
Before the Meeting
- Share results in advance. Never ambush.
- Prepare two or three solution options with timelines and projected outcomes.
- Verify all data. Presenting inaccurate numbers during a bad-news conversation is catastrophic.
- Think about your client’s personality type and adjust your approach.
- Anticipate the three questions they’re most likely to ask and have answers ready.
During the Meeting
Open with acknowledgment. Present data using the right framework—SPIKES for complex situations, R-O-C for strategic pivots, BEAR for specific metric issues. Take genuine ownership, not performative blame-taking. Present the action plan collaboratively and document next steps in real time. And close by asking: “Does this plan align with your expectations? What would you adjust?”
After the Meeting
Send a written summary of every commitment within 24 hours. If you normally report monthly, shift to biweekly during recovery. Prioritize quick wins to rebuild confidence. And follow through on everything you said you’d do. Everything. Nothing kills a recovery faster than a broken promise when trust is already thin.
The 30-60-90 Day Recovery Arc
The 30-60-90 Day Recovery Arc
From Rough Month To Rebuilt Trust
A bad reporting call isn’t the end — it’s the start of a 90-day arc. Here’s what each phase needs to look like.
Days 1–14
Diagnose & Stabilize
- Complete root cause analysis and share it
- Pause or adjust underperforming elements
- Reallocate budget to what’s working
- Implement tactical changes with clear hypotheses
Days 15–30
Test & Build Momentum
- Run A/B tests one variable at a time
- Share early data even if inconclusive
- Move to biweekly reporting cadence
- Prioritize quick wins to rebuild confidence
Days 31–90
Pivot & Solidify
- Revise strategy based on test results
- Explore new channels where signals are strong
- Set revised KPI targets with the client
- Document lessons learned — or escalate via R-O-C
- Days 1–14: Complete the root cause analysis and share it. Pause or adjust underperforming elements. Reallocate budget to what’s working. Implement tactical changes with clear hypotheses.
- Days 15–30: Run A/B tests on specific variables—one at a time, so you know what’s actually causing results. Share early data with the client even if it’s inconclusive. Momentum matters.
- Days 31–90: Revise strategy based on what the tests told you. Explore new channels. Set revised KPI targets with the client. If things have recovered, document what you learned. If they haven’t, use the R-O-C framework for a bigger strategic conversation.
How to Prevent Bad Months From Becoming Bad Relationships
The best time to prepare for a tough reporting call is before you ever need one. During onboarding, document what normal fluctuation looks like. Set KPIs with baselines, acceptable variance ranges, and review triggers.
Something like: “If organic traffic drops more than 15% for two consecutive weeks, we schedule an immediate review call.” That reframes future dips from “agency failure” to “triggered protocol.” The difference in how your client processes it is enormous.
Run quarterly Value Translation Sessions—meetings where you help your client explain your impact to their internal stakeholders in business terms. Their CMO needs to justify spend to their CFO. If your client can articulate your value in their company’s language, they advocate for you internally. That’s worth more than any dashboard.
And build what we calls “relationship redundancy.” Maintain at least three meaningful connections between your agency and the client’s team. The data shows 49% of departures correlate with personnel changes. If the whole relationship runs through one account manager and one client contact, you’re one resignation away from starting over.
If you manage a portfolio of clients, the biggest risk is usually the one you’re not looking at. The People Pleaser who stops replying. The Silent Partner whose numbers are quietly drifting.
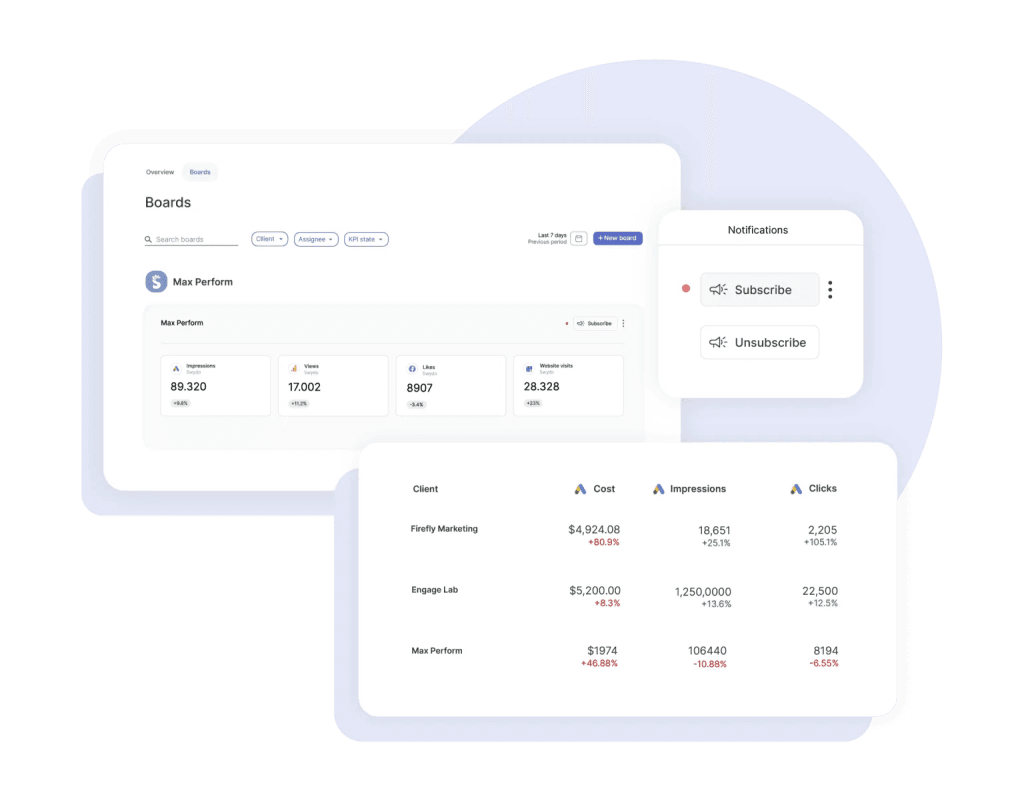
A cross-client overview that surfaces which accounts are off-track in one glance—something Swydo builds into its Metrics Overview—turns “I hope everyone’s okay” into “I know everyone’s okay, and here’s the one client I need to call today.” That shift, from hoping to knowing, is where proactive account management actually starts.
Finally, educate your clients about measurement changes as they happen. Don’t wait until SEO traffic drops to explain AI Overviews. Don’t wait until attribution looks off to explain privacy changes. When you share these shifts proactively, you’re the guide navigating complexity. When you explain them reactively, you’re the vendor making excuses.
The Bottom Line
The agencies losing clients right now aren’t the ones with bad numbers. They’re the ones that go quiet when numbers drop. Growth Rocket nails it: agencies “communicate around performance, not through it.” When things go well, communication flows. When things go badly, it contracts. That instinct is exactly wrong.
Own it. Explain it. Fix it. Do it before your client has to ask.
That’s not just better communication. Right now, it’s your competitive advantage.
Communicating Bad Data to Clients FAQ
Direct answers to the questions agencies are actually searching for
Use a three-part structure: own it, explain it, fix it. Open with a direct acknowledgment such as, “I have some challenging numbers to share.” Then walk through what happened, why it happened, and the specific action plan you’re already executing. Don’t bury the lead, don’t soften with praise, and don’t wait for the client to ask. The conversation around the data matters more than the data itself.
Yes, always. Send a heads-up email with the key data point and a note that you’re already investigating root causes, then schedule a detailed discussion within 24 to 48 hours. Surprising clients with bad news during a live meeting triggers defensive reactions and damages trust. Pre-disclosure lets them process privately and arrive ready to discuss solutions instead of reacting emotionally.
Match the channel to the severity. Minor metric dips can stay in a written report with annotations. Significant underperformance needs a video call so you can read reactions and show empathy through tone. Major failures or strategic pivots require an immediate video call followed by a written summary. Defaulting to email for tough conversations signals you’re avoiding the hard talk.
Avoid five phrases that erode trust. “The results speak for themselves” abdicates your interpretive role. “We just need more budget” sounds like a safety net request. “It’s the algorithm’s fault” sounds like an excuse. “These are just vanity metrics” disrespects what your client cares about. And never use “we” for wins but “the campaign” for losses—clients notice that ownership shift instantly.
The compliment sandwich—good news, bad news, good news—mostly benefits the deliverer, not the receiver. Research from UC Riverside, Ivey Business School, and Harvard Business Review shows it teaches clients to brace themselves whenever they hear praise. Once a client associates positive openings with bad news arriving next, every kind word becomes a warning siren. It damages both the feedback and the relationship.
Going quiet. When things go well, communication flows. When things go badly, agencies contract, get defensive, or stop reaching out. Silence tells your client one thing: you’re afraid to tell them something. That thought is more damaging than any number on a report. Communicate through performance issues, not around them.
SPIKES is a six-step framework for delivering difficult information, originally developed at MD Anderson Cancer Center for medical diagnoses. The steps are: Setting (right format and prep), Perception (ask how they feel performance went), Invitation (gauge how much detail they want), Knowledge (deliver the data with a brief warning shot), Emotions (validate before solving), and Strategy (present a collaborative action plan). It’s the most-tested bad-news framework in existence and translates directly to agency reporting calls.
BEAR stands for Behavior, Effect, Alternative, and Result. Use it for single-metric problems. Example: “CTR dropped from 2.1% to 0.8% (Behavior). Our CPA is now 62% above target (Effect). We recommend shifting to the video formats that tested well last quarter (Alternative). Based on similar pivots, we project return to target within three weeks (Result).” Clean, complete, and forward-looking.
R-O-C is an agency-specific framework from consultant Karl Sakas. Give the reason results fell short, present two or three options with clear trade-offs, then let the client choose the path forward. It works because when clients pick the recovery plan themselves, they own it with you. They become a partner in the solution instead of a critic of the problem. Best for strategic pivots affecting multiple parts of the engagement.
Ruinous Empathy comes from Kim Scott’s Radical Candor framework. It’s when you care about a relationship so much that you avoid hard truths—softening data, hinting at problems instead of naming them, withholding bad news. The short-term comfort feels right, but the long-term result is a client who gets blindsided and blames you for not speaking up sooner. The biggest agency communication failure isn’t being too harsh. It’s being too nice.
Use the benchmark frame: “Our numbers dropped 15%. The industry dropped 30%. Here’s the specific cause and the fix we’ve already deployed.” Or invert the loss: “We maintained 70% of traffic while the industry average dropped 45%.” This isn’t spin—it’s accurate context. Loss aversion makes losses feel twice as painful as gains feel good, so context isn’t optional. It’s how the conversation becomes productive.
Run every data point through one filter: does this number answer “We did this and the result was that,” or “We noticed this and here’s what we’re doing”? If it doesn’t answer either question, cut it. During a bad month, extra metrics just look like padding. The “So What?” test forces every chart to earn its place by tying back to action or insight.
Loss aversion, documented by Daniel Kahneman, means losses feel roughly twice as painful as equivalent gains feel good. A 10% drop stings far more than a 10% gain pleases. This is why framing matters as much as the data itself. “We lost 30% of traffic” triggers loss aversion. “We retained 70% of traffic while the industry dropped 45%” provides context that lets the client’s brain process the number rationally instead of defensively.
Negativity bias is the tendency for negative experiences to carry disproportionate psychological weight. One bad month can erase eleven good ones in your client’s memory. The fix is to address bad data before they find it themselves—surprise makes negativity bias worse. Pair every monthly snapshot with trailing averages and cumulative performance so a single rough month doesn’t define the relationship.
MUM stands for Minimizing Unpleasant Messages. It’s the unconscious tendency for teams to soften bad news before it reaches the client—rounding up dropping metrics, hiding concerning trends, omitting context. The result is reports that feel reassuring short-term but create much bigger trust problems later when reality catches up. The fix: build systems where raw data is shared alongside interpretation, never replaced by it.
Anchoring means the first number a client sees becomes the reference point for everything else—so leading with a big negative number filters even your wins through that lens. Show industry benchmarks first, then your numbers. Recency bias makes clients overweight the latest month and forget the broader trend, so always pair monthly snapshots with trailing averages and cumulative performance. Both biases can be neutralized through intentional report sequencing.
This client type is sometimes called the “Bulldozer”—Type-A, hands-on, and reactive to performance drops. The right approach is to come over-prepared. Bring detailed plans, anticipate their objections, and demonstrate expertise in the room. They’re not trying to take over—they’re trying to confirm you have it under control. Show them you do, and the micromanaging usually subsides.
Watch for two patterns. The “People Pleaser” says everything is fine while silently absorbing frustration, then terminates without warning—don’t take their reassurances at face value, use written goals, and loop in their boss periodically. The “Silent Partner” goes into ghost mode when unhappy: fewer replies, shorter emails, skipped calls. Treat any sustained change in responsiveness as a red flag, not a scheduling fluke.
Clients filter data through cognitive biases and personality types that have nothing to do with marketing. The same numbers will land four different ways depending on whether you’re talking to a Bulldozer, People Pleaser, Team Player, or Silent Partner. Layer in negativity bias, loss aversion, anchoring, recency bias, and the MUM effect, and you have nine different filters between your data and their reaction. Match your communication to the person, not your own comfort zone.
Three structural problems are making data look worse than performance. Only about 31% of users accept tracking cookies, so roughly 70% of web traffic is invisible to traditional tools. AI Overviews appear in over a quarter of U.S. searches and have cut organic CTR by more than 60% when they show up. And ad platforms now ship major changes every few days. Your numbers may be reflecting a measurement problem, not a performance problem.
Use a “cone of confidence” framing. Tell them: here’s what we can directly observe, here’s what we’re modeling with reasonable confidence, and here’s where we’re making directional judgments. Customers now touch an average of 9.5 touchpoints before converting, so last-click attribution massively undervalues top-of-funnel work. The numbers aren’t wrong because the strategy is wrong—they’re wrong because measurement tools can’t keep up. That framing is honest, sophisticated, and far more useful than pretending any single dashboard number is gospel.
Marketing Mix Modeling (MMM) uses historical data to show how each marketing input contributes to outcomes. It matters because traditional pixel-based attribution is breaking down due to privacy changes and cookie loss. Free open-source tools like Google’s Meridian and Meta’s Robyn have made MMM accessible for mid-size agencies for the first time. About half of marketers are increasing MMM investment, making it the emerging standard for measuring channel impact.
Incrementality testing measures only the conversions that wouldn’t have happened without the ad. Around half of marketers now use some form of it. It’s powerful because it answers the question your client actually cares about: “Is this spend doing anything we wouldn’t get for free?” Unlike attribution models that allocate credit across touchpoints, incrementality tests isolate true causal impact—making it a strong defense against budget cuts.
Server-side tracking sends first-party conversion data directly from your server to ad platforms, bypassing browser-level privacy restrictions. Combined with enhanced conversions, it typically recovers 10 to 25% of previously lost data. Showing clients you’ve implemented server-side tracking proves you’re closing the measurement gap—not just complaining about it. It’s one of the most credible signals you can give that you’re keeping up with platform changes.
Always compare year-over-year, not month-over-month, during seasonal periods. A pre-Black Friday sales dip is expected because customers are holding out for deals. A Q1 drop after holiday spending is normal. If the same pattern showed up in the same month last year, it’s seasonality. If it didn’t, it’s a real signal worth investigating. Month-over-month comparisons during seasonal periods will mislead you every time.
SEO is a lag indicator with a three-to-six-month timeline. Brand campaigns operate on even longer horizons. If a content strategy launched six weeks ago isn’t converting, that’s not failure—that’s physics. Show clients leading indicators that predict conversions: engagement, branded search volume, qualified traffic, time on page. These move first and predict the lagging indicators (revenue, signups) the client is waiting for.
AI Overviews now appear in over 25% of U.S. searches, and organic CTR drops more than 60% when they show up. ChatGPT accounts for an estimated 20% of search-related traffic globally, and Gartner projects a quarter of organic search traffic will move to AI tools over the next couple of years. When an entire channel shifts, you don’t apologize—you explain the shift, show competitors are hit the same way, and present an adaptation plan focused on AI visibility, branded search, and direct traffic.
Not because of bad results. An UpCity survey found 80% of departing clients cite poor communication as the reason. The Setup Marketing Relationship Survey ranks the top drivers as: lack of proactive strategic guidance (68%), poor communication and transparency (57%), inability to demonstrate value (53%), relationship deterioration (49%), dissatisfaction with delivery (48%). Pricing ranks last at 37%. The top four reasons are all about how you show up, not what you charge.
Bain & Company research shows acquiring a new client costs 5 to 25 times more than keeping one. A 5% increase in retention can boost profits by 25 to 95%. Existing clients spend 67% more than new ones, and referrals from happy clients generate roughly a third of new business. Every tough reporting call is either strengthening retention math or destroying it.
Days 1 to 14: diagnose and stabilize—complete root cause analysis, pause underperforming elements, reallocate budget to what’s working. Days 15 to 30: test and build momentum—run A/B tests one variable at a time, share early data even if inconclusive, move to biweekly reporting, prioritize quick wins. Days 31 to 90: pivot and solidify—revise strategy based on test results, explore new channels, set revised KPI targets collaboratively, document lessons learned.
Increase communication frequency, not decrease it. Shift from monthly to biweekly reporting during recovery. Send a written summary of every commitment within 24 hours of each call. Prioritize quick wins to rebuild confidence visually. And follow through on everything you said you’d do—nothing kills a recovery faster than a broken promise when trust is already thin.
Set the rules during onboarding, not after a problem appears. Document what normal fluctuation looks like, define KPIs with baselines and acceptable variance ranges, and set review triggers like, “If organic traffic drops more than 15% for two consecutive weeks, we schedule an immediate review.” This reframes future dips from “agency failure” to “triggered protocol”—a massive psychological shift in how clients process the news.
Relationship redundancy means maintaining at least three meaningful connections between your agency and the client’s team. It matters because nearly half of client departures correlate with personnel changes. If your entire relationship runs through one account manager and one client contact, you’re one resignation away from starting over. Build connections at multiple levels and across multiple functions to insulate the relationship from churn on either side.
A Value Translation Session is a quarterly meeting where you help your client articulate your impact in business terms their internal stakeholders care about. Your client’s CMO has to justify spend to their CFO. If they can explain your value in their company’s language—revenue impact, market share, competitive advantage—they advocate for you internally. That advocacy is worth more than any dashboard.
Increase the cadence. If you normally report monthly, shift to biweekly during recovery. The instinct is to communicate less when results are bad—exactly the wrong move. More frequent updates demonstrate progress, surface issues earlier, and signal that you’re actively engaged. Once performance stabilizes for two consecutive reporting periods, you can return to the original cadence.
Turn tough reporting calls into stronger client relationships with reports that pair every metric with the context behind it.
Start Your Free Trial Today