
In a survey of 713 marketers, 63% of the time spent on data-related work went to collecting, cleaning, and formatting rather than to analysis.
Standardized client reporting means every report you send shares the same metrics, layout, and brand, so it’s repeatable instead of rebuilt. Scale means you deliver more of those reports without adding the same number of hours. The order between those two is what decides whether your reporting holds at twenty-five clients or caps you at twelve.
I work at Swydo, so the product examples here are ours. The process itself works in whatever tool you already run.
Here’s the order: what standardization actually covers, the count that tells you when to move, the four decisions you standardize, the four switches you flip to scale, and how to pick a tool whose bill doesn’t grow faster than your revenue.
What It Means to Scale and Standardize Client Reporting
Standardized client reporting means every report shares the same metrics, layout, and brand, so it’s repeatable, not rebuilt from scratch. Scaled reporting means you deliver more of those reports without adding the same number of hours.
Think of a coffee chain. A new store opens fast because there’s one blueprint. Same menu, same setup, same standards. Quality stays put and nobody reinvents the store.
Standardized marketing reporting is that blueprint for your client reports. A new client becomes a new “store” you can open in minutes, because the template, the KPIs, and the brand are already set.
That covers the front of the shop. There’s a back room too.
A report also has data plumbing underneath it. So standardization is really two layers. One is the front your client sees, the structure, metrics, and brand. The other is the back end, where data flows in and has to stay correct.
Skip the back layer and you get reports that look identical while the numbers underneath stay shaky. That’s the trap. And it’s why “just use a template” only gets you halfway.
Why Standardized Reporting Decides Whether You Can Grow
Standardized, automated reporting is more than housekeeping. It protects your margin and your client list, because manual reporting is one of the few costs that climbs in step with your client count while your team stays the same size.
Look at where the hours go. In a survey of 713 marketers, 63% of the time spent on data work went to tasks that could be automated. That’s the collecting, cleaning, and formatting, not the analysis clients actually pay for.
Now add clients. Each one adds the same pile of manual work, and your headcount stays flat. Something gives, usually report quality or your team’s evenings.
Standardize first, automate second, and that cost changes shape:
- Hours go back to billable work. Your team reads, interprets, and approves instead of assembling from nothing.
- Margin goes up without a price increase. Reporting is overhead. Every hour you cut either bills out or buys back time.
- Clients stay longer. A consistent, on-time, on-brand report builds trust. A late or sloppy one starts the client churn conversation early.
- Your numbers finally agree. Define a metric once and every report tells the same story.
It’s one of the few touchpoints you fully control. Worth treating it like one. There’s a deeper case for why client reporting matters if you want it, but the short version is simple. Good reporting keeps clients, weak reporting loses them.
When to Standardize and Scale Your Reporting
Standardize before you think you need to. The trigger is a count, not a feeling.
Standardize when your data-source count passes about 25, which almost always happens earlier than it feels urgent.
A data source is one connected account or property: one Google Ads account, one GA4 property, one Facebook Page. A single client running search, social, and analytics is already three to five sources, so twenty clients can reach a hundred sources before anyone counts. Your source count predicts where reporting cracks far better than your client count does.
The Signals That Say You’re Ready
You’ve outgrown one-off reporting the moment two of these are true. Several of them mean you’re already late:
- A new hire built a report and it looked nothing like everyone else’s.
- Last month, reporting ate more than a full day.
- A client spotted a number that didn’t match their platform.
- Someone copies data out of a dashboard into a slide by hand.
- Two reports define the same metric two different ways.
- A connector broke and nobody noticed until the client did.
Feel this at the small-agency stage? There’s a lighter path for scaling a small agency’s reporting that starts with templates and a shared KPI list rather than a full systems overhaul.
The Reporting Scalability Ladder
Find your roster, then make the move before the next stage forces it.
| Where you are | What it feels like | What breaks first | The move to make |
| Up to ~10 sources (1 to 5 clients) | Manual is fine. You can hold it all in your head. | Nothing yet, but habits form here. | Write your KPI definitions down before you forget why you chose them. |
| 10 to 25 clients | Reports drift apart. New hires build them differently. | Consistency. Two reports define a metric two ways. | Build master templates per service line and link clients to them. |
| 25 to 50 clients | Reporting eats a full work-week every month. | Your time. Manual assembly stops working. | Automate delivery, white-label, and schedule in bulk. |
| 50+ clients | You lose sight of how every client is doing. | Oversight. Problems surface after the client finds them. | Add SOPs, role-based access, and monitoring with alerts. |
The Standardize-Then-Scale Framework
Standardize first, then scale, always in that order. Flip the order and automation ships your mess faster, on a schedule.
Phase one is front-loaded work: a shared KPI library, master templates, locked branding, and a written process. Phase two is what you switch on once that base holds: connect data once, automate delivery, let monitoring do the checking, and match the output to each client.
The template mechanic has a name worth keeping. Call it One Build, Many Sends: build the report once as a master, link your clients to it, and one edit updates them all.
Most agencies who tried a reporting tool and bounced off it turned on automation before they’d agreed on what a report should contain, so the tool faithfully scaled the inconsistency they already had.
The Standardize-Then-Scale Framework
Front-load the foundation. Then turn on the switches that grow with you.
Decide once, apply everywhere
- Build a KPI library with one definition per metric
- Create 4 to 6 master templates, one per service line
- Lock your brand into every report
- Write a reporting SOP and a QA step
Flip the switches on a solid base
- Connect each data source once, reuse everywhere
- Automate delivery and manage schedules in bulk
- Replace manual checking with monitoring
- Match dashboards or PDFs to each client
Standardize first. Scale second. The order is the whole point.
How to Standardize Reporting Across Your Agency
Standardization comes down to four decisions you make once and apply everywhere: your metrics, your templates, your brand, and your process. Get these set and a new client report drops from a half-day job to about fifteen minutes.
Write Down Every KPI Definition Once
Pin down every metric that appears in client reports, with one definition, one calculation, and one owner, so “conversions” means the same thing in every report you send. It’s the move that pays off most in the whole standardization phase, and almost nobody does it first.
The mess it prevents is subtle. One strategist counts form fills as conversions, another counts purchases, and each report is defensible on its own while together they tell two different stories.
Start by separating true KPIs from the metrics that are only context. The split between a KPI and a metric is worth settling as a team, and it’s the backbone of what belongs in a KPI report.
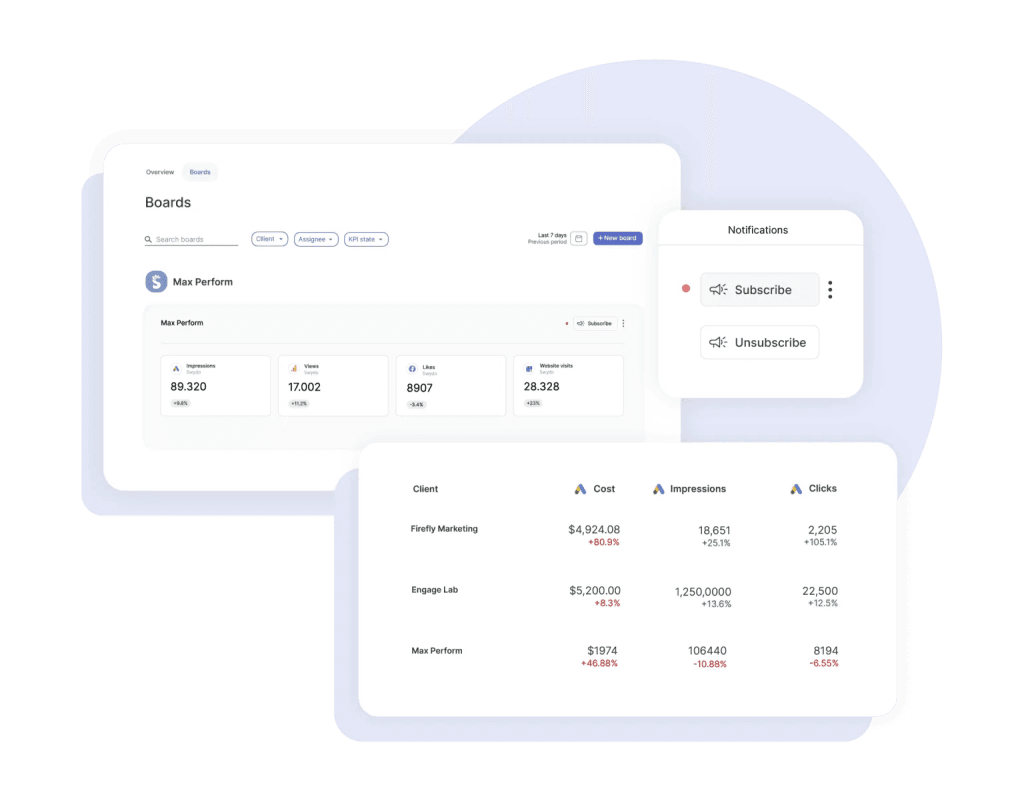
Then check that the library actually holds across clients. Open Monitoring → Metrics Overview and pin up to six KPIs into one view spanning every client, so a single screen tells you whether everyone is using the same definitions.
Build One Master Template per Service Line
Build four to six master templates, one per service you sell (like PPC, SEO, or paid social), instead of one per client. A good master handles about 80% of the report. Your team adds the last 20% as commentary.
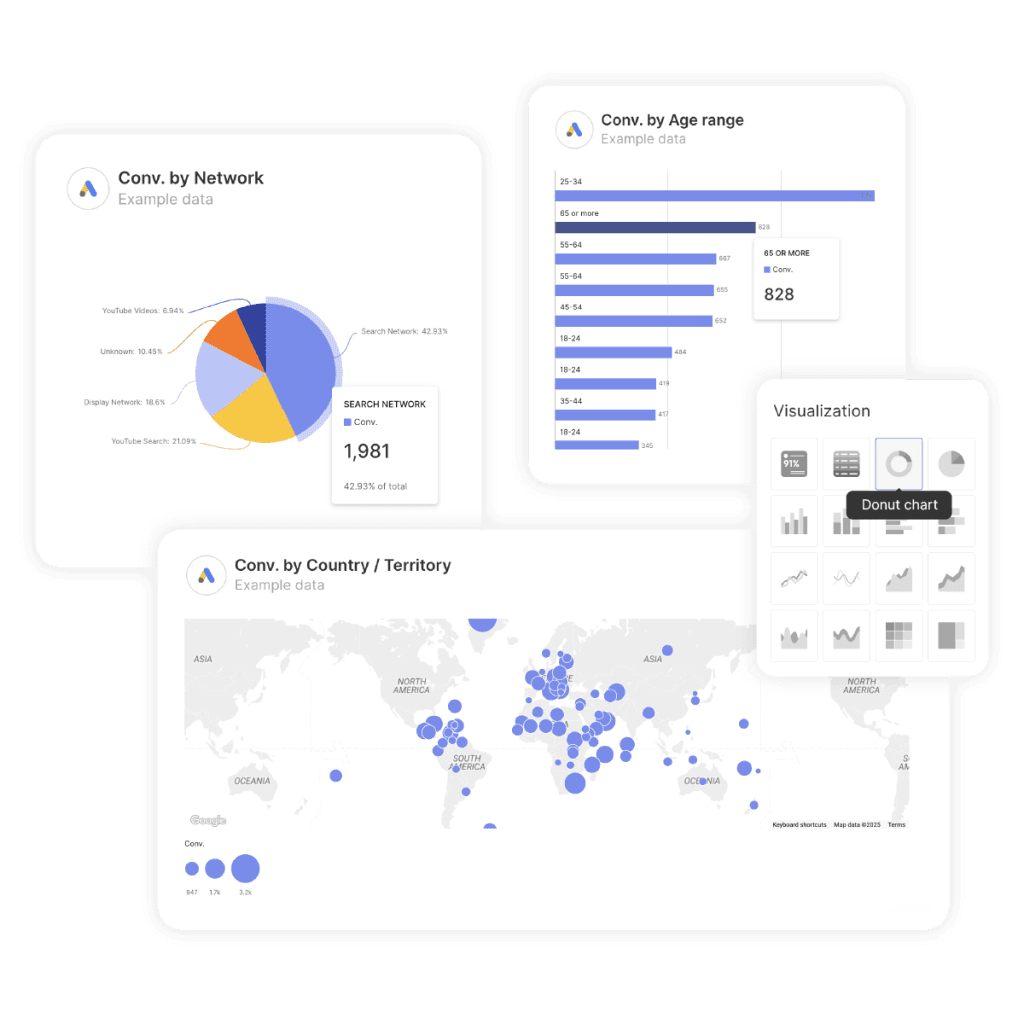
Open the Template Gallery and start from a ready-made preset, like a PPC report, then shape one master per service line. Link each client report to it. Change the master once (add a metric, swap a widget, fix a layout) and every linked report updates on its own, which is the practical argument for marketing report templates over one-off builds.This is where standardizing meets scaling.
One Master Template, Many Linked Reports
The mechanic that turns standardization into scale.
Change the master → every linked report updates. No rebuilding, no drift.
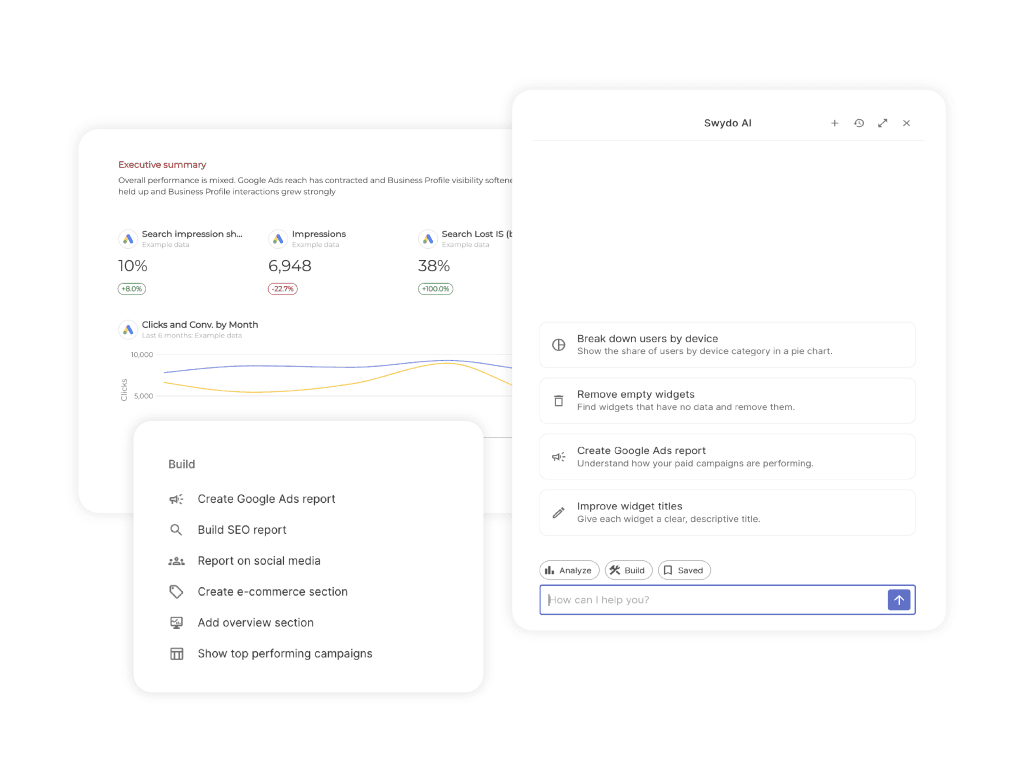
The first build no longer starts from a blank page either. Describe the report you want in plain language and Swydo’s agentic reporting builds the structure for you, sections, KPIs, tables, and charts included. From there you edit by asking, so changing a date range, a chart type, or a metric takes a sentence instead of a click path.
Save the prompt that produced your best master. That prompt becomes a written spec for what a PPC report contains, which puts it alongside your KPI library rather than in someone’s notes app. One document says what a metric means; the other says which metrics belong in the report.
One caution comes with the speed. A one-prompt report is fast enough that anyone can spin up a bespoke build for a single client, which is the exact drift master templates exist to prevent. Use it to create the master, then link clients to that master, so the speed lands in the build rather than in the number of report structures you maintain.
Worth knowing before you link fifty clients: once you unlink a report from its template, the unlink is permanent, and you’d rebuild from the template to link it again. Lock your master structure first.
Put Your Brand on Every Report
Set the look once so a client sees your brand and only yours. White-label reports support higher retainers than reports that look templated.
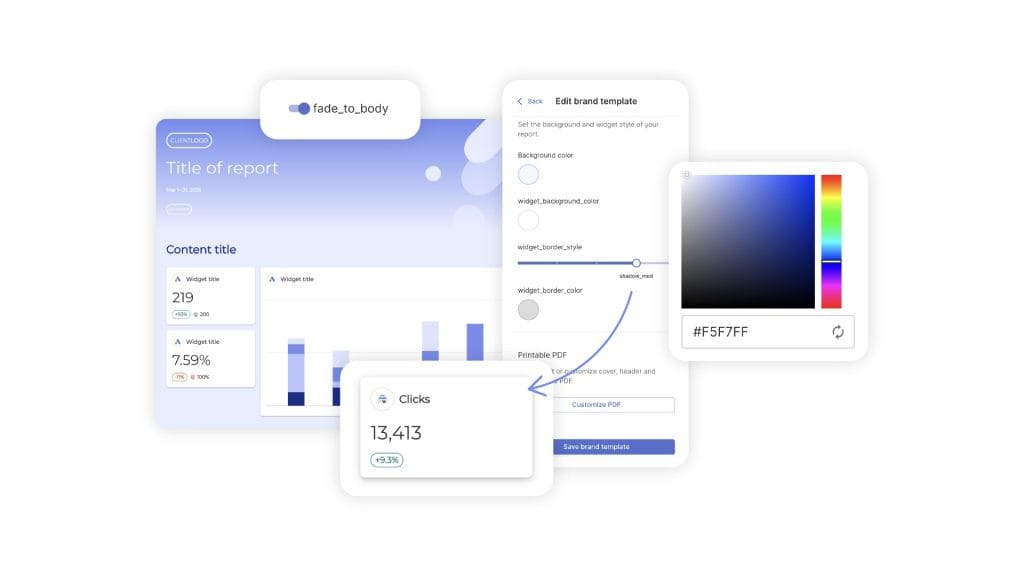
Open Templates → Brand Templates and set your colors, logo, and font from the 1,000+ Google Fonts available. Point a custom domain like reports.youragency.com at your dashboards with a CNAME record. Verify your sending domain so scheduled reports arrive from your address with no “via Swydo” tag. Switch off the Swydo logo in the report footer.
Most tools handle the colors and the logo and then stop at the email and domain layer, which is the part worth checking when you compare white-label reporting tools.
Write a One-Page Reporting SOP
Write the reporting process as a one-page standard aimed at your newest hire, and add one review step before anything reaches a client. A template shows what the report looks like; an SOP shows how it gets made, checked, and sent.
Keep it plain: which metrics, from which source, in which template, on what schedule, reviewed by whom. Require an executive summary and a next-steps line so every report leads with a read instead of a wall of numbers. This guide on how to write an executive summary shows the version clients actually use, and these habits sit at the center of solid client reporting best practices.
Two features keep the standard intact once other people are editing. Give freelancers and junior staff Contributor access so they edit their assigned clients while your master templates stay locked. And lean on Report Revision History, which holds 100 changes and restores any version from the last hour, for the moment someone “fixes” a report right before it goes out.
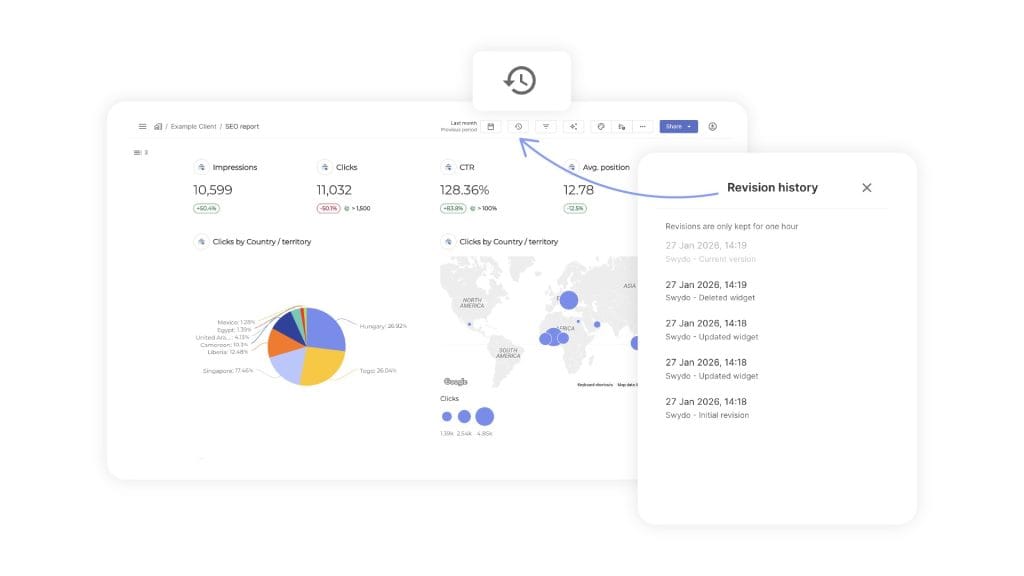
Revision history covers an hour, so treat it as in-session undo and accidental-overwrite recovery rather than a long-term audit log.
How to Scale Reporting Without More Headcount
The scale phase is four switches you flip once the standard holds. Connect data once, automate delivery, let monitoring replace manual checks, and match the output to each client. Each one works best on a solid base, which is the whole reason they come second.
Connect Each Account Once
Connect each account a single time at the client level and reuse it across every report. Manual data entry is the first thing to break at scale and the first thing worth cutting.
Coverage decides how much of that you can actually cut. Swydo runs 38 integrations and counting, from Google Ads and GA4 through Facebook Ads, LinkedIn, TikTok, Reddit Ads, Semrush, HubSpot, and CallRail. Every channel a tool doesn’t cover natively is a channel someone on your team pastes in by hand every month.
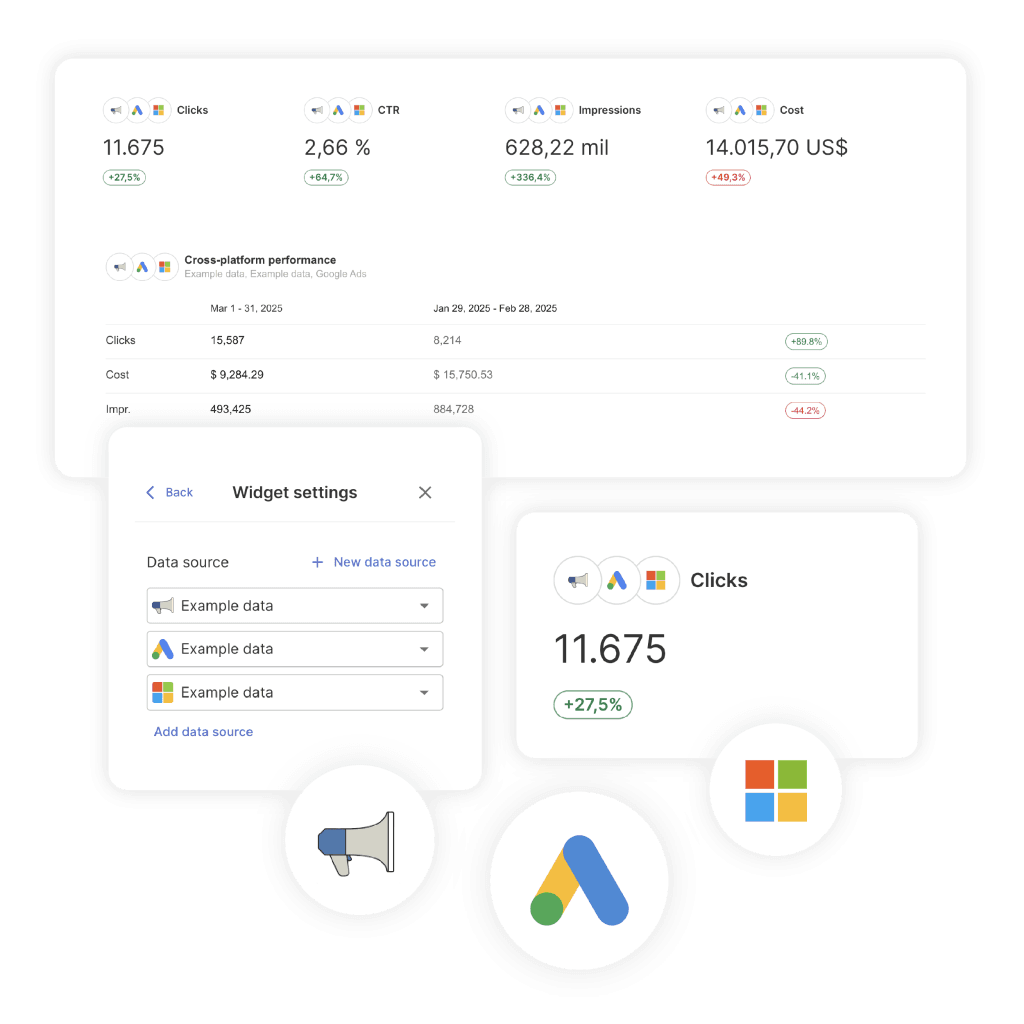
The cross-channel win lives here too. Insert a widget, click Add data source, and pick up to five ad platforms like Google, Meta, LinkedIn, and TikTok. Choose a metric like Cost, Conversions, Revenue, or ROAS. A client running four paid channels now gets one clean number in place of four scattered tables, and that combined source works in your monitoring boards, goals, and alerts as well as in the report.
Let Reports Send Themselves
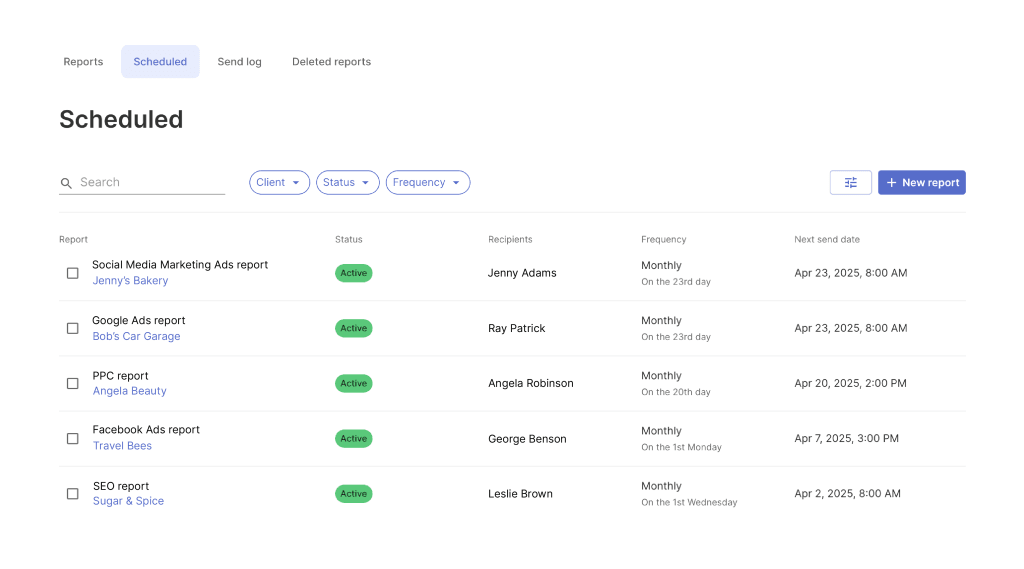
Set reports to build and send on their own, so delivery runs on a schedule instead of on someone remembering. At scale you manage those schedules in bulk rather than one at a time.
Go to Reporting → Scheduled, tick the reports you want, then hit Bulk Actions at the top right to change frequency, pause or resume, reassign the sender, or set the date range across many reports at once, which is the difference between running 5 schedules by hand and running 200.
Clients open the email before they open the report, so drop the AI Summary block into your email template. For scheduled reports it writes a fresh plain-language recap into every send.
Still deciding what to hand off? This is the core of what good report automation tools actually take off your plate.
Let the System Watch Every Client for You
Most mornings start the same way. Open one client’s dashboard, scan the numbers, confirm every feed is still live. Repeat for the next client, and the next, before you send a single report. That check is fine at five clients. At fifty, it eats most of a morning, every morning.
Swydo’s monitoring takes that off your plate. The system watches every client for you, so your day starts with the few things that need attention, not a full checklist. This is the shift from monitoring vs reporting, and it holds up whether you run 5 clients or 50.
Three pieces do the watching:
- Metrics Overview. The cross-client view you built for your KPI library doubles as your morning scan, showing every client’s numbers on one screen in place of fifty open dashboards.
- Goals. Pacing targets that show On Track, Off Track, or Achieved across every client at a glance.
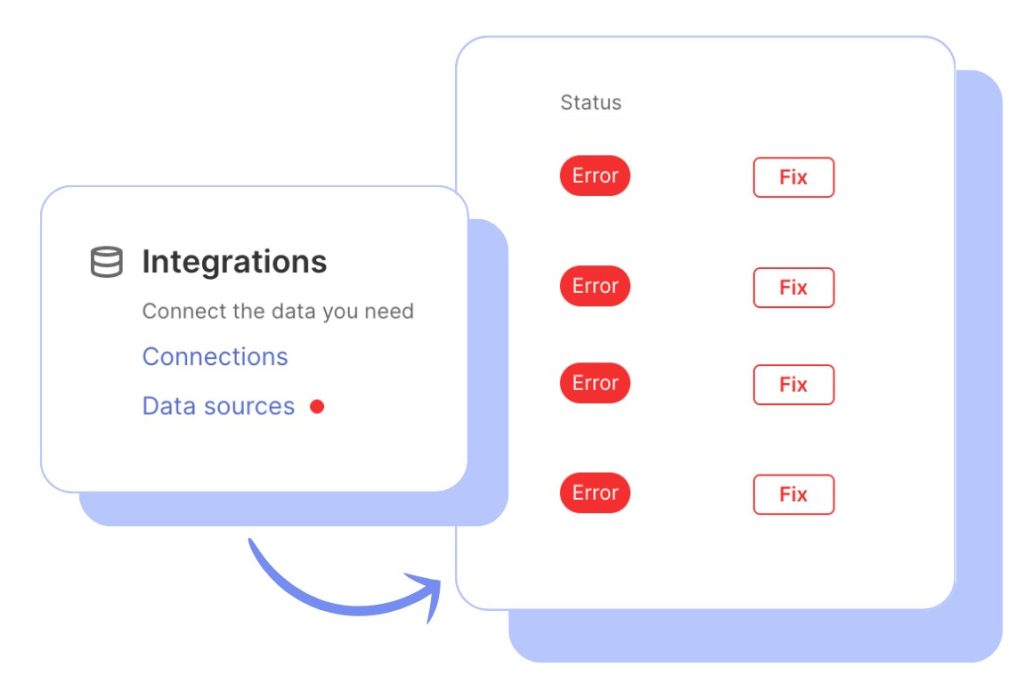
- Data Health Check Alerts. A broken connection gets a red dot and an email the moment a token expires, so a dead feed surfaces on its own instead of when a client spots stale numbers.
Then Alerts close the loop on the metrics themselves. Open Monitoring → Alerts, click +New Alert, pick the client, the data source, and the metric, set the trigger condition and a window of 1, 7, 30, or 90 days, then choose who gets notified. Swydo checks every morning and emails you the moment a result crosses the line, with a Slack ping if you connect it under Settings. You can also pause alerts on specific days, so weekend dips don’t wake anyone up.
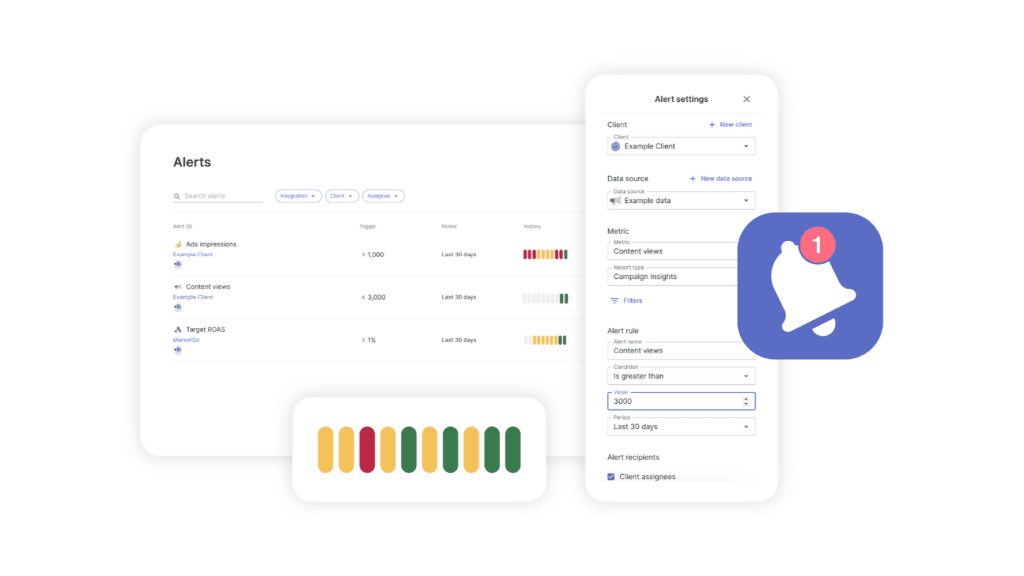
Want to see an alert fire on your own account? Connect one client in the trial and the first check lands within a day, no card required.
Match the Format to Each Client
Match the output to the client instead of forcing one format on everyone. The call between dashboards vs reports usually comes down to how often a client looks and whether they want to self-serve.
Some clients want a live view they can open any day. Others want a clean PDF on the first of the month and nothing else. A shared standard leaves room for both, off the same build.
Give Each Client One Portal Instead of a Pile of Links
A client portal collects the reports, boards, and goals you choose to share behind one secure link, so your client stops juggling four URLs and you stop resending them.
Open the client’s account and go to the Portal tab. Turn the portal on, then choose what goes in it:
- Reports for detailed channel performance.
- Boards for a quick overview of the KPIs that matter to them.
- Goals so they can watch progress against their own targets.
Preview it before you share. What you see in preview is what your client sees, which catches the half-finished widget while it’s still your problem.
Access stays under your control. Add a password when a client’s team asks for one. Regenerate the portal link the moment a contact leaves their company, which kills the previous link immediately. Update what’s shared whenever their reporting needs change, without issuing a new address.
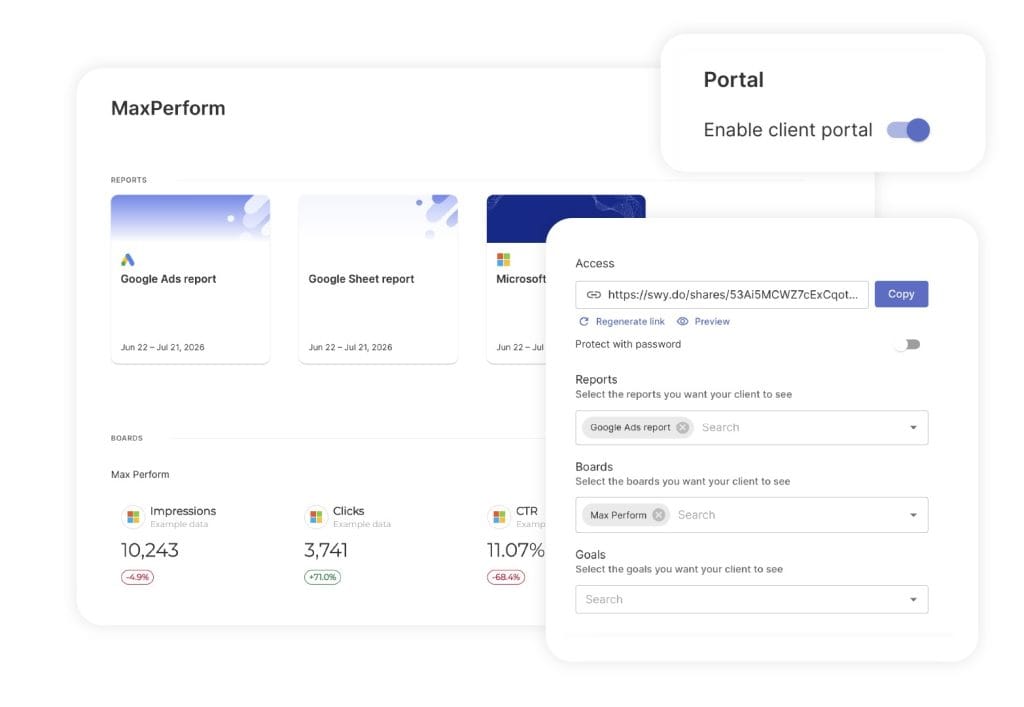
A portal shows what you publish to it and nothing more, so it isn’t a self-serve query tool. It works best once you’ve already decided what each client should see. Standardize the report first and the portal is a delivery choice; skip that step and it becomes one more surface to keep in sync.
What’s Different About Client Reporting Now
Three shifts changed what a good reporting setup looks like: AI writes the first draft, your conversion numbers got fuzzier, and new channels need a seat in the report. If your process predates these, close the gaps.
AI Handles the Writeup
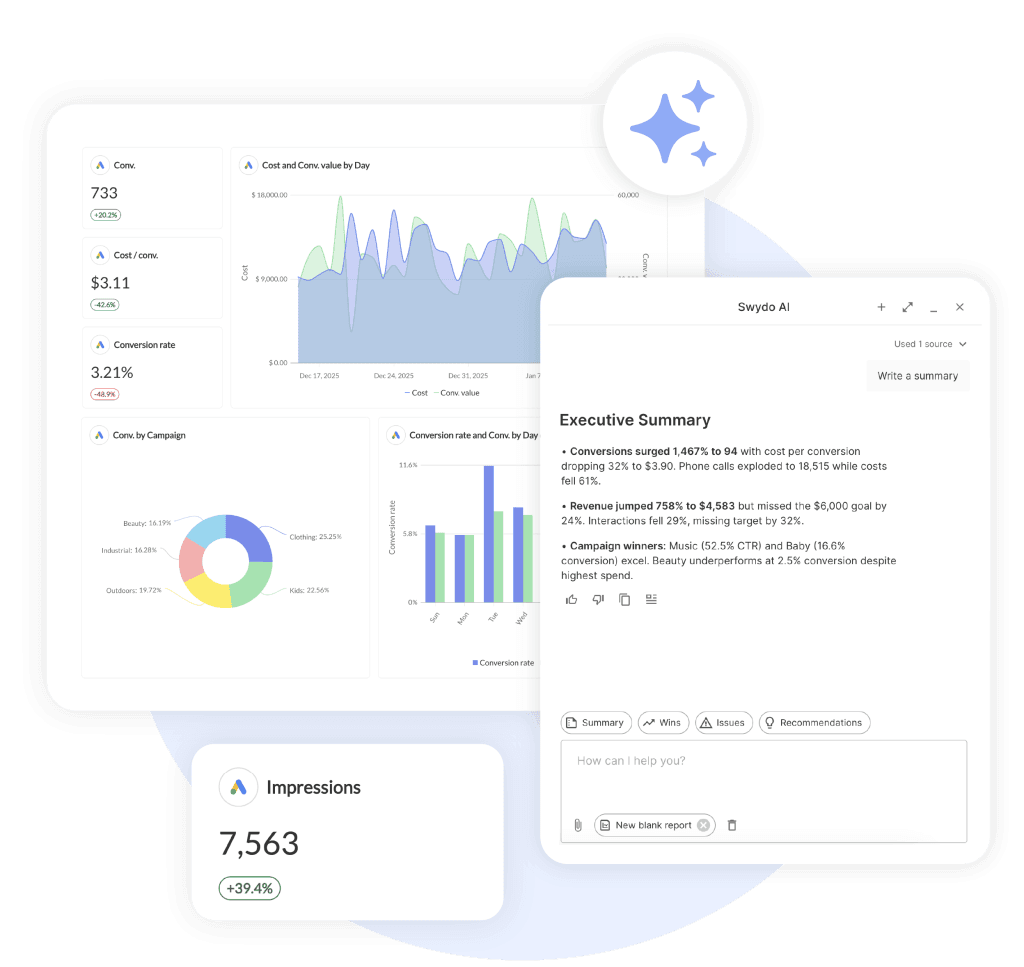
Commentary was always the slow half of a report and the half a client actually reads. Click the Swydo AI icon at the top of a report and pick Summary, Wins, Issues, or Recommendations. Use the paperclip to point it at one section, then drop the result into a text widget.
You can hand that capability to clients too. Turn AI on for your team and your clients from Settings in the left-side menu, and clients get a limited set of AI features inside their dashboard, in their own language. Every request they make draws from your credit pool, which is worth knowing before you switch it on across a roster of fifty.
Treat AI as the analyst who writes the rough draft and keep the sign-off yours. A misread trend in an auto-summary still carries your name on the report.
How the credits work. Your plan includes 4,000 AI credits a month. A report summary averages around 95 credits, so that’s roughly 40 summaries before you’re into overage. Credits reset monthly and don’t carry over. Larger reports take more processing and cost more credits per request, so a 12-section cross-channel master runs heavier than a single-channel snapshot.
You’re billed only for what you use. If you don’t touch the credits in a given month, you’re not charged for them. Set a spending limit up front and an unusually heavy month stays predictable, and Billing → View usage details breaks the spend down by thread and by team member when you want to know who’s running what.
Clients ask about the data, so have the answer ready. Requests are processed in the AWS cloud using commercially available models, routed globally depending on which region has capacity. Your data isn’t used to train models. The setup is GDPR compliant, and the existing data processing agreement already covers AWS, so nothing changes on the paperwork side.
Your Conversion Data Got Fuzzier
Privacy and consent rules mean platforms now estimate more of what you report instead of counting it exactly, wherever a consent banner gates the data. Lean harder on first-party data you own, and get ahead of the client conversation about why an estimated number is still an estimate rather than a mistake. Explain it early and you look like an advisor; skip it and a client reads the gap as a slip.
New Channels Need Room
Retail media, connected TV, TikTok, and Reddit moved from experiments to line items clients expect to see. A setup that only speaks Google and Meta is already a step behind. You already maintain standardized templates like a web analytics report and a rank-tracking report. Hold new channels to the same bar so each one slots in instead of becoming a one-off spreadsheet.
Where Looker Studio Breaks at Scale
Looker Studio is genuinely good for a handful of clients on mostly Google data, and it’s free. It has a breaking point, though, usually somewhere around ten to fifteen clients, and what you hit there is the ceiling of a free dashboard tool asked to do agency reporting at volume.
The pattern repeats. GA4’s API throws Looker (Data) Studio quota errors and charts go blank. Data blending caps at five sources, so real cross-channel views get awkward. Dashboards slow down as clients stack up. There’s no native white-label even on the paid tier, and no built-in scheduling or client management built for an agency roster.
To pull in non-Google platforms you bolt on Data Studio connectors that each carry a monthly fee, and that bill climbs with every client you add. None of it hurts at five clients, and all of it compounds at fifty.
The cost that decides it is maintenance time. The tool is free, but the hours you spend rebuilding dashboards, fixing connectors, and working around quotas are not, and past a certain client count those hours erase the savings. The full picture of scaling Data Studio and its limitations is worth reading before you commit a growing roster to it.
How to Choose a Reporting Tool That Scales With You
Four things decide a reporting tool: integration coverage, white-label, monitoring, and the cost-per-client as you grow. Most agencies underweight the last one, and it’s what sets your margin.
Three pricing models show up, and each suits a different shape of agency.
| Pricing model | How the bill grows | Best fit |
|---|---|---|
| Per client | Flat fee for each new client, however many channels they run | Many clients, few channels each |
| Per dashboard | Fee per dashboard, sources unlimited per dashboard | Few complex clients, many accounts each |
| Per data source | Base covers a set number of sources, and extra sources cost less as you add them | A moderate number of accounts per client |
Three Pricing Models, Three Agency Shapes
The model decides whether your bill grows with your revenue or ahead of it.
| Per client | Per dashboard | Per data source | |
| How the bill grows | Flat fee for each new client | Fee per dashboard, unlimited sources each | Base covers a set number of sources; extra sources cost less as you add them |
| Climbs fastest when | Clients run few channels each | You add separate dashboards | Each client runs many accounts |
| Best fit | Many simple clients | Few complex, multi-account clients | Moderate accounts per client + unlimited seats |
Worked example. Take 25 clients, each running 4 accounts, so 100 data sources. On a per-source model that’s a $49 base (10 sources included) plus 90 extra sources at $3.50 each, or $364 a month, with unlimited users, unlimited clients, and every feature included. Run those same 25 clients at 10 accounts each and the arithmetic turns, which is where a per-dashboard tool can win.
Swydo runs on the per-data-source model. The base plan is $49/month, includes 10 data sources, and comes with unlimited users and unlimited clients, with white-label, AI, and monitoring all in from the start. Extra sources drop in price as you grow: $3.50 each from 11 to 100, $2.50 from 101 to 500, $1.50 past that. Send reports daily or monthly for the same price. Seats are free, so your cost tracks the accounts you manage rather than the size of your team. Seasonal agency? Pause the subscription for $10/month instead of canceling.
Now the honest part. If every client runs eight or ten separate accounts, a per-source price climbs and a per-dashboard tool may cost you less. Swydo fits agencies with a moderate source count per client, which is most agencies but is worth checking against yours. Model it before you choose, the same way you’d weigh automated reporting tool pricing across any shortlist, and the head-to-heads on Swydo vs AgencyAnalytics and Swydo vs DashThis fill in the rest.
One more note for custom pipelines. There’s no public REST API, so custom data flows in through Google Sheets with Zapier or Make, which covers the large majority of what agencies ask for. For heavy data engineering, weigh that first.
Want a wider field before you shortlist? The roundup on selecting a marketing report automation tool and the guide to the best client reporting software lay out the options, including the Looker Studio alternative angle.
Common Mistakes That Cost You at Scale
Most setups fail from small habits that stay hidden until you’ve added clients, rather than one big error. Cut these from the start:
- A unique design for every client. Feels premium, and it caps how far you can scale. Standardize the structure, personalize the commentary.
- Vanity metrics with no tie to revenue. Impressions and follower counts train clients to value the wrong thing. Lead with the marketing KPIs your clients care about.
- Manual data pulls. The first thing to break, the easiest to automate away.
- Metric definitions that live only in people’s heads. They drift apart over time. The KPI library fixes that.
- Automation before the standard exists. That just ships inconsistency on a schedule.
- No review step. One check before send catches the broken widget and the misread trend.
- A dead connector nobody caught. A connection can fail quietly and feed stale data while the report still looks fine. Swydo’s Data Health Check Alerts flag a broken connection with a red dot and an email before it reaches a client. That’s the failure that does the most quiet damage when it slips by.
Final Thoughts
Reporting stops capping your growth the moment it’s standardized and automated. Set the standard first: one KPI library, master templates per service line, locked branding, a one-page SOP. Then scale. Connect data once, let reports send themselves, and swap manual checks for alerts.
Two things to keep. The order holds. Standardize, then automate, or you just scale the mess. And the number that sets your margin is the hours and cost per client as you grow, not a sticker price.
Get those two right and reporting stops deciding how big your agency can get.
Standardizing and Scaling Client Reporting FAQ
How agencies make reporting repeatable first, then grow it without adding hours
Standardized client reporting means every report you send uses the same metrics, layout, and branding, so each one is repeatable instead of rebuilt by hand. It works on two layers: the front your client sees (structure, KPIs, brand) and the back-end data that feeds it. You need both standardized before a new client can plug into a blueprint that already exists.
A KPI is a metric tied to a goal you're accountable for, while a plain metric is supporting context. Revenue, leads, and ROAS are usually KPIs; impressions, clicks, and sessions are usually the metrics that explain them. Define each one once, with a single calculation and a single owner, and "conversions" means the same thing in every report you send.
A client report should lead with an executive summary and a clear next step, then show the few KPIs tied to the client's goals with supporting metrics underneath for context. The essentials:
- An executive summary that states the takeaway up front
- Results measured against the client's goals
- A short explanation of what changed and why
- A next-steps line covering what you'll do next
Yes. Templates are what make consistent reporting possible at scale, because they let you build a report once and reuse it across every client. Build a few master templates by service line like PPC, SEO, and paid social, rather than one per client, so a single edit updates every linked report. A good template handles the structure and roughly 80% of the report, and your team adds the commentary specific to each client.
Write your standards down once and lock them, so individuals can't drift: one KPI library with a single definition per metric, master templates everyone builds from, and a one-page reporting SOP. The usual cause of drift is definitions living in people's heads, where one strategist counts form fills as conversions and another counts purchases. Give junior staff and freelancers contributor-level access so they edit only their assigned clients while the master templates stay locked.
A data source is one connected account or property, like a single Google Ads account, one GA4 property, or one Facebook Page. Cost and complexity scale with sources rather than clients, and one client running search, social, and analytics is already three to five sources. Count sources instead of clients to predict when your reporting will start to strain, because twenty clients can reach a hundred sources without anyone noticing.
Standardize first, then automate: build master templates and a shared KPI list, then connect data once, schedule delivery, and replace manual checks with alerts. The order matters, because automating before you standardize just sends inconsistent reports faster. Done in that order, your team spends its time reading and advising rather than assembling.
Connect each data source once, link each report to a master template, and schedule them to build and send on their own. From there you manage schedules in bulk, changing frequency or pausing across many clients at once, instead of touching each report by hand. The goal is delivery that runs on a schedule rather than on someone remembering to send it.
Once reporting is standardized and automated, a single client report should take minutes to review rather than hours to build. The benchmark to beat: in one survey of 713 marketers, 63% of data-work time went to collecting, cleaning, and formatting, which are the exact parts that automate away. If reporting still eats a full day or more each month, you've outgrown manual work.
There's no fixed number, because capacity depends on how standardized your process is rather than how many clients you have. Manual reporting tends to crack somewhere between 10 and 25 clients, and the real ceiling is your data-source count. Standardize and automate and you raise that ceiling far more than hiring does.
Most agencies send client reports monthly, with some adding a weekly or live view for hands-on clients, and the right cadence depends on how often the client actually looks. Send a monthly summary to clients who want the headline and give a live dashboard to clients who check constantly. Once delivery is automated, a faster cadence costs you no extra time.
It depends on the client. A dashboard is a live view they can open any time and filter themselves, while a report is a fixed snapshot you send on a schedule, usually as a PDF. Match the format to each client as part of scaling delivery, because the same standardized data ships either way without a rebuild.
A client portal is one secure link that holds the reports, boards, and goals you've chosen to share with a specific client, so they stop managing separate URLs for each one. You pick exactly what goes in, preview it before sharing, and can add a password or regenerate the link to revoke access instantly. It shows what you publish to it, so it works best once you've decided what that client should see.
The best client reporting tool is the one that covers your channels, white-labels fully, monitors your data, and keeps cost-per-client low as you grow. That last factor is the one most agencies overlook, and it's what sets your margin. Match the tool to how many accounts your clients actually run before you commit a growing roster to it.
Client reporting software is usually priced one of three ways: per client, per dashboard, or per data source. Per-client suits many clients with few channels each, per-dashboard suits a few complex clients with many accounts, and per-source suits a moderate number of accounts per client. The model decides whether your bill grows with your revenue or ahead of it, so model it against your own account mix before choosing.
In Swydo, AI runs on credits included with your plan: 4,000 a month, with an average report summary using about 95 credits, so roughly 40 summaries. Credits reset monthly and don't carry over, and you're billed only for what you actually use, with a spending limit you set yourself. Larger, more complex reports use more credits per request.
You can, but spreadsheets stop scaling once you're past a handful of clients, because every report becomes manual copy-paste that breaks and drifts. They're fine for one or two clients, or for piping in custom data a tool doesn't support natively. Past roughly five clients, the hours spent maintaining sheets and the errors they introduce usually cost more than a dedicated tool would.
Looker Studio works well for a few clients on mostly Google data, but it tends to break around ten to fifteen clients as API quota errors blank out charts and dashboards slow down. It also blends only five sources, has no native white-label, and offers no built-in scheduling or client management designed for an agency roster. The tool is free; the hours spent rebuilding dashboards and working around its limits are not.
White-label reporting means the report carries only your agency's branding, with no trace of the underlying tool. Full white-label covers four things:
- Your own colors, logo, and fonts
- A custom domain like reports.youragency.com
- A verified sending address so emails come from you
- No tool logo in the report footer
Branded reports support higher retainers, and most tools handle the visuals but stop short on the email and domain layer.
AI can write the commentary in a client report (the summary, wins, issues, and recommendations), and newer tools can draft the report structure itself from a plain-language description. Treat it as an analyst handing you a rough draft and keep the final sign-off yours, since a misread trend still carries your name.
In Swydo, AI requests are processed in the AWS cloud using commercially available models, routed globally depending on which region has capacity. Your data is not used to train models, and the offering is GDPR compliant under a data processing agreement that already covers AWS. Anything a client generates through a shared dashboard follows the same terms.
Conversion numbers often don't match because platforms now estimate part of what they report rather than counting every conversion, wherever privacy and consent rules gate the data. This is how attribution works now, not a tracking error, so expect some modeled numbers and lean on first-party data you own. Explain it to clients early and you read as an advisor rather than someone covering a mistake.
Blend the channels into one view, so a client running Google, Meta, LinkedIn, and TikTok sees a single combined number like total spend or blended ROAS instead of four separate tables. Most reporting tools let you pull several ad platforms into one widget and pick the metric to combine. The stronger versions let that combined source feed your monitoring and alerts too, not just the report.
Two habits catch most of them: one review step before any report goes out, and automated alerts that flag broken data connections. A connector can fail silently and feed stale numbers while the report still looks fine, which is the error that does the most damage before anyone notices. A human check plus data-health alerts catches both the broken widget and the misread trend.
Share one portal on your own domain rather than a separate URL for every report and dashboard. A portal holds the reports, boards, and goal progress you choose to publish, so the client has one place to look and you have one thing to update when their needs change. Add a password when a client asks for tighter control, and regenerate the portal link when a contact leaves their team to cut off the old one right away.
Standardize your reports, automate delivery, and take on more clients without adding hours.
Start Your Free Trial Today